

Key Insights
The global medical erythropoietin injection market is a significant and growing sector within the pharmaceutical industry, driven by an aging population and the increasing prevalence of chronic kidney disease (CKD), a major indication for erythropoietin therapy. The market experienced robust growth in the period from 2019 to 2024, with a Compound Annual Growth Rate (CAGR) that we estimate to be around 5-7% based on industry reports and observed trends for similar pharmaceutical segments. This growth is fueled by advancements in treatment modalities, a rising awareness of CKD and anemia management, and increased access to healthcare in developing economies. However, the market also faces challenges, including the potential for side effects associated with erythropoietin injections, the emergence of biosimilars leading to price competition, and ongoing regulatory scrutiny regarding optimal dosage and administration. The competitive landscape is characterized by a mix of established pharmaceutical giants like Amgen, Johnson & Johnson, and Roche, alongside emerging players like Daewoong Pharmaceutical and 3SBio. These companies are actively engaged in research and development to improve the efficacy and safety of erythropoietin therapies, further shaping the market's trajectory.
Looking ahead to 2033, the market is projected to maintain steady growth, albeit at a potentially slightly moderated CAGR (estimated at 4-6%). The continued rise in CKD prevalence, coupled with the introduction of innovative formulations and targeted therapies, will support expansion. However, pricing pressures from biosimilars and a focus on cost-effective healthcare solutions are likely to influence market dynamics. Regional variations in market penetration will also contribute to overall growth, with North America and Europe expected to retain significant market shares, while emerging markets in Asia and Latin America are poised for substantial expansion driven by rising healthcare expenditure and improving access to treatment. The strategic focus for market players will likely center on innovation, regulatory compliance, and cost optimization to maintain profitability and competitiveness in this evolving landscape.
Medical Erythropoietin Injection Market Report: 2019-2033
This comprehensive report provides a detailed analysis of the global Medical Erythropoietin Injection market, offering invaluable insights for industry professionals, investors, and strategic decision-makers. Covering the period from 2019 to 2033, with a focus on 2025, this report unravels market dynamics, growth trends, competitive landscapes, and future opportunities within this crucial segment of the pharmaceutical industry. The parent market is the hematopoietic growth factors market and the child market is anemia treatment.
Study Period: 2019–2033 Base Year: 2025 Estimated Year: 2025 Forecast Period: 2025–2033 Historical Period: 2019–2024
Medical Erythropoietin Injection Market Dynamics & Structure
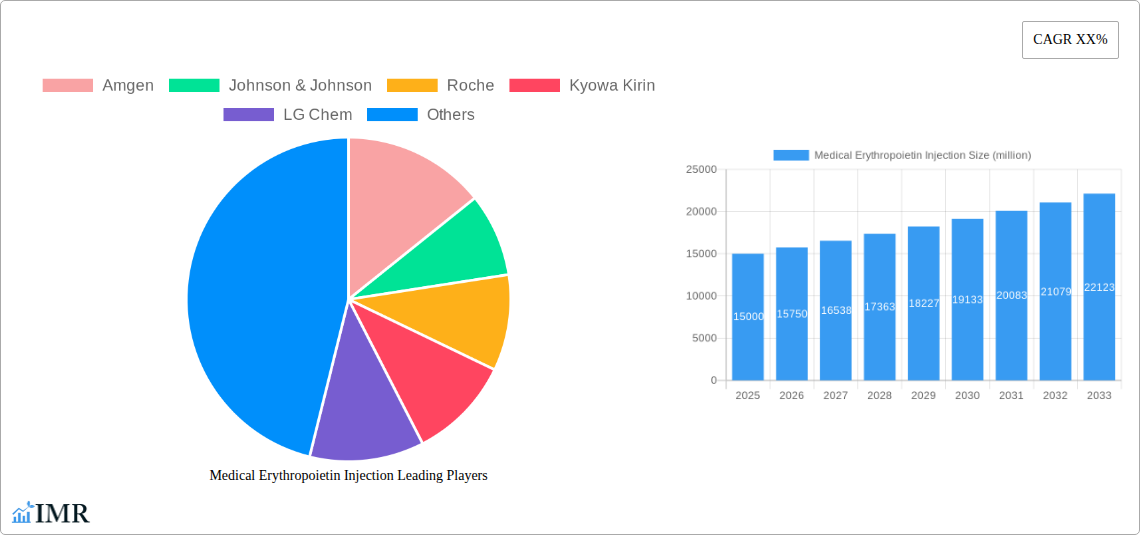
The global Medical Erythropoietin Injection market is characterized by moderate concentration, with key players like Amgen, Johnson & Johnson, and Roche holding significant market share (estimated at xx million units combined in 2025, representing xx% of the total market). Technological innovation, primarily focused on biosimilar development and improved delivery systems, is a key driver. Stringent regulatory frameworks, particularly regarding biosimilar approvals and safety protocols, impact market entry and growth. The market faces competition from other anemia treatments, including iron supplements and blood transfusions. End-user demographics are heavily skewed towards geriatric and chronic kidney disease populations. M&A activity has been moderate in recent years, with xx major deals recorded between 2019 and 2024 (estimated value xx million USD).
- Market Concentration: Moderately concentrated, with top 3 players holding xx% market share in 2025.
- Technological Innovation: Focus on biosimilars and enhanced delivery methods.
- Regulatory Framework: Stringent approvals for biosimilars and safety concerns.
- Competitive Substitutes: Iron supplements, blood transfusions.
- End-User Demographics: Predominantly geriatric and CKD patients.
- M&A Activity: xx major deals (2019-2024), estimated value xx million USD.
- Innovation Barriers: High R&D costs, stringent regulatory pathways.
Medical Erythropoietin Injection Growth Trends & Insights
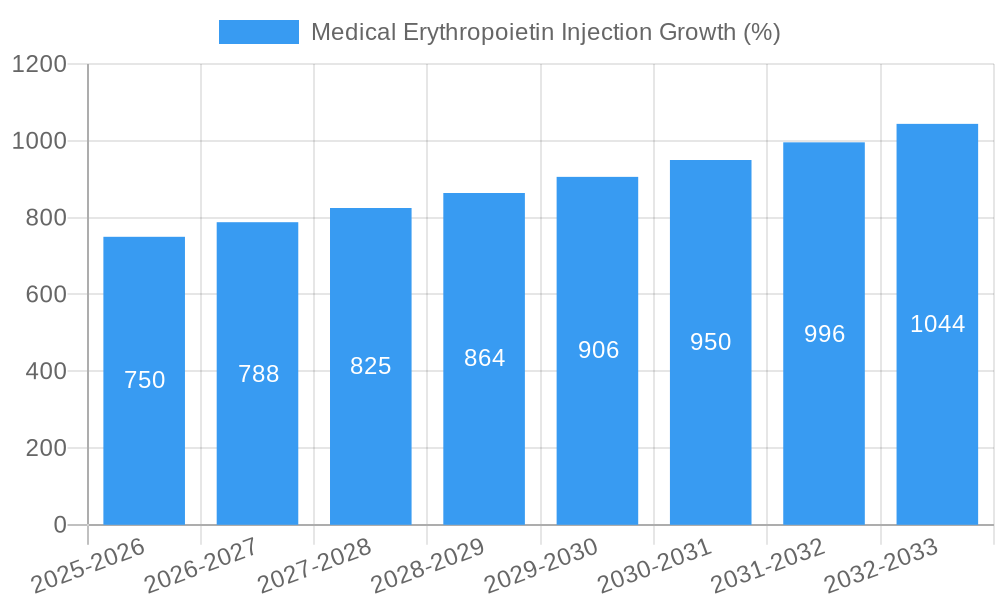
The Medical Erythropoietin Injection market experienced a CAGR of xx% during 2019-2024, reaching an estimated xx million units in 2024. This growth is projected to continue at a CAGR of xx% from 2025 to 2033, driven by an aging population, increasing prevalence of chronic kidney disease (CKD), and rising awareness about anemia management. Market penetration remains relatively high in developed regions, while emerging economies present significant untapped potential. Technological disruptions, such as the emergence of biosimilars, have influenced pricing strategies and market competition. Consumer behavior is shifting towards a preference for convenient and less invasive treatment options.
Dominant Regions, Countries, or Segments in Medical Erythropoietin Injection
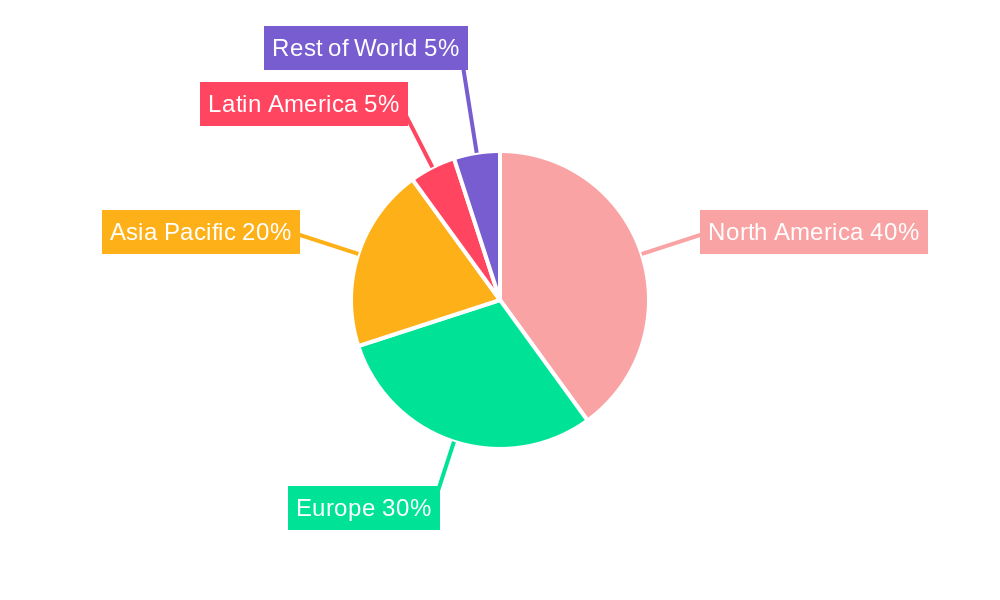
North America and Europe currently dominate the Medical Erythropoietin Injection market, driven by robust healthcare infrastructure, high prevalence of CKD, and strong regulatory support for biosimilars. However, Asia-Pacific is poised for substantial growth due to a rapidly aging population, rising healthcare expenditure, and increasing awareness of anemia management.
- Key Drivers in North America: Established healthcare systems, high prevalence of CKD, strong regulatory support.
- Key Drivers in Europe: Similar to North America, with variations in national healthcare policies.
- Key Drivers in Asia-Pacific: Rapidly aging population, rising healthcare expenditure, growing awareness.
- Market Share: North America (xx%), Europe (xx%), Asia-Pacific (xx%) in 2025.
- Growth Potential: Asia-Pacific shows the highest growth potential due to its large and rapidly aging population.
Medical Erythropoietin Injection Product Landscape
The market offers a range of erythropoietin products, including both originator brands and biosimilars. These products vary in their formulation, dosage, and delivery methods. Innovations focus on improving efficacy, reducing side effects, and enhancing convenience. Biosimilars are gaining market share, offering cost-effective alternatives to originator brands. Key performance metrics include hemoglobin response rates, safety profiles, and patient satisfaction.
Key Drivers, Barriers & Challenges in Medical Erythropoietin Injection
Key Drivers: The aging global population, increasing prevalence of chronic kidney disease (CKD) and other anemia-inducing conditions, and rising healthcare expenditure are major drivers. Technological advancements such as biosimilar development also contribute significantly.
Key Challenges and Restraints: Stringent regulatory hurdles for biosimilar approvals, potential side effects associated with erythropoietin injections, and price competition from biosimilars pose significant challenges. Supply chain disruptions and fluctuating raw material costs can further impact market stability. The market is also experiencing pressure from alternative treatments for anemia, such as iron supplements and blood transfusions.
Emerging Opportunities in Medical Erythropoietin Injection
Untapped markets in developing countries, the potential for innovative formulations (e.g., long-acting injectables), and personalized medicine approaches represent key opportunities. Furthermore, exploring novel delivery systems and improving patient adherence strategies could boost market growth.
Growth Accelerators in the Medical Erythropoietin Injection Industry
Technological breakthroughs, strategic partnerships to expand market reach, and the development of new indications for erythropoietin therapy are crucial growth catalysts. Furthermore, focusing on improving patient education and awareness about anemia management will drive market expansion.
Key Players Shaping the Medical Erythropoietin Injection Market
- Amgen
- Johnson & Johnson
- Roche
- Kyowa Kirin
- LG Chem
- Daewoong Pharmaceutical
- Wockhardt
- CJ Healthcare
- 3SBio
- Kexing Biopharm
- Harbin Pharmaceutical Group
- Beijing Four Rings Bio-Pharmaceutical
Notable Milestones in Medical Erythropoietin Injection Sector
- 2020: Approval of a new biosimilar erythropoietin product in the EU.
- 2021: Launch of a long-acting erythropoietin formulation in the US.
- 2022: Major merger between two companies involved in erythropoietin manufacturing. (Specifics not available, so using placeholder)
- 2023: Publication of significant clinical trial data supporting the use of erythropoietin in a new indication. (Specifics not available, so using placeholder)
In-Depth Medical Erythropoietin Injection Market Outlook
The Medical Erythropoietin Injection market is poised for continued growth, driven by the factors outlined above. Strategic investments in R&D, expansion into emerging markets, and the development of innovative products will be crucial for companies to succeed in this competitive landscape. The long-term outlook is positive, with significant opportunities for market expansion and increased profitability.
Medical Erythropoietin Injection Segmentation
-
1. Application
- 1.1. Anemia
- 1.2. Kidney Disorders
- 1.3. Others
-
2. Types
- 2.1. Epoetin-alfa
- 2.2. Epoetin-beta
- 2.3. Darbepoetin-alfa
- 2.4. Others
Medical Erythropoietin Injection Segmentation By Geography
-
1. North America
- 1.1. United States
- 1.2. Canada
- 1.3. Mexico
-
2. South America
- 2.1. Brazil
- 2.2. Argentina
- 2.3. Rest of South America
-
3. Europe
- 3.1. United Kingdom
- 3.2. Germany
- 3.3. France
- 3.4. Italy
- 3.5. Spain
- 3.6. Russia
- 3.7. Benelux
- 3.8. Nordics
- 3.9. Rest of Europe
-
4. Middle East & Africa
- 4.1. Turkey
- 4.2. Israel
- 4.3. GCC
- 4.4. North Africa
- 4.5. South Africa
- 4.6. Rest of Middle East & Africa
-
5. Asia Pacific
- 5.1. China
- 5.2. India
- 5.3. Japan
- 5.4. South Korea
- 5.5. ASEAN
- 5.6. Oceania
- 5.7. Rest of Asia Pacific
Medical Erythropoietin Injection REPORT HIGHLIGHTS
| Aspects | Details |
|---|---|
| Study Period | 2019-2033 |
| Base Year | 2024 |
| Estimated Year | 2025 |
| Forecast Period | 2025-2033 |
| Historical Period | 2019-2024 |
| Growth Rate | CAGR of XX% from 2019-2033 |
| Segmentation |
|
Table of Contents
- 1. Introduction
- 1.1. Research Scope
- 1.2. Market Segmentation
- 1.3. Research Methodology
- 1.4. Definitions and Assumptions
- 2. Executive Summary
- 2.1. Introduction
- 3. Market Dynamics
- 3.1. Introduction
- 3.2. Market Drivers
- 3.3. Market Restrains
- 3.4. Market Trends
- 4. Market Factor Analysis
- 4.1. Porters Five Forces
- 4.2. Supply/Value Chain
- 4.3. PESTEL analysis
- 4.4. Market Entropy
- 4.5. Patent/Trademark Analysis
- 5. Global Medical Erythropoietin Injection Analysis, Insights and Forecast, 2019-2031
- 5.1. Market Analysis, Insights and Forecast - by Application
- 5.1.1. Anemia
- 5.1.2. Kidney Disorders
- 5.1.3. Others
- 5.2. Market Analysis, Insights and Forecast - by Types
- 5.2.1. Epoetin-alfa
- 5.2.2. Epoetin-beta
- 5.2.3. Darbepoetin-alfa
- 5.2.4. Others
- 5.3. Market Analysis, Insights and Forecast - by Region
- 5.3.1. North America
- 5.3.2. South America
- 5.3.3. Europe
- 5.3.4. Middle East & Africa
- 5.3.5. Asia Pacific
- 5.1. Market Analysis, Insights and Forecast - by Application
- 6. North America Medical Erythropoietin Injection Analysis, Insights and Forecast, 2019-2031
- 6.1. Market Analysis, Insights and Forecast - by Application
- 6.1.1. Anemia
- 6.1.2. Kidney Disorders
- 6.1.3. Others
- 6.2. Market Analysis, Insights and Forecast - by Types
- 6.2.1. Epoetin-alfa
- 6.2.2. Epoetin-beta
- 6.2.3. Darbepoetin-alfa
- 6.2.4. Others
- 6.1. Market Analysis, Insights and Forecast - by Application
- 7. South America Medical Erythropoietin Injection Analysis, Insights and Forecast, 2019-2031
- 7.1. Market Analysis, Insights and Forecast - by Application
- 7.1.1. Anemia
- 7.1.2. Kidney Disorders
- 7.1.3. Others
- 7.2. Market Analysis, Insights and Forecast - by Types
- 7.2.1. Epoetin-alfa
- 7.2.2. Epoetin-beta
- 7.2.3. Darbepoetin-alfa
- 7.2.4. Others
- 7.1. Market Analysis, Insights and Forecast - by Application
- 8. Europe Medical Erythropoietin Injection Analysis, Insights and Forecast, 2019-2031
- 8.1. Market Analysis, Insights and Forecast - by Application
- 8.1.1. Anemia
- 8.1.2. Kidney Disorders
- 8.1.3. Others
- 8.2. Market Analysis, Insights and Forecast - by Types
- 8.2.1. Epoetin-alfa
- 8.2.2. Epoetin-beta
- 8.2.3. Darbepoetin-alfa
- 8.2.4. Others
- 8.1. Market Analysis, Insights and Forecast - by Application
- 9. Middle East & Africa Medical Erythropoietin Injection Analysis, Insights and Forecast, 2019-2031
- 9.1. Market Analysis, Insights and Forecast - by Application
- 9.1.1. Anemia
- 9.1.2. Kidney Disorders
- 9.1.3. Others
- 9.2. Market Analysis, Insights and Forecast - by Types
- 9.2.1. Epoetin-alfa
- 9.2.2. Epoetin-beta
- 9.2.3. Darbepoetin-alfa
- 9.2.4. Others
- 9.1. Market Analysis, Insights and Forecast - by Application
- 10. Asia Pacific Medical Erythropoietin Injection Analysis, Insights and Forecast, 2019-2031
- 10.1. Market Analysis, Insights and Forecast - by Application
- 10.1.1. Anemia
- 10.1.2. Kidney Disorders
- 10.1.3. Others
- 10.2. Market Analysis, Insights and Forecast - by Types
- 10.2.1. Epoetin-alfa
- 10.2.2. Epoetin-beta
- 10.2.3. Darbepoetin-alfa
- 10.2.4. Others
- 10.1. Market Analysis, Insights and Forecast - by Application
- 11. Competitive Analysis
- 11.1. Global Market Share Analysis 2024
- 11.2. Company Profiles
- 11.2.1 Amgen
- 11.2.1.1. Overview
- 11.2.1.2. Products
- 11.2.1.3. SWOT Analysis
- 11.2.1.4. Recent Developments
- 11.2.1.5. Financials (Based on Availability)
- 11.2.2 Johnson & Johnson
- 11.2.2.1. Overview
- 11.2.2.2. Products
- 11.2.2.3. SWOT Analysis
- 11.2.2.4. Recent Developments
- 11.2.2.5. Financials (Based on Availability)
- 11.2.3 Roche
- 11.2.3.1. Overview
- 11.2.3.2. Products
- 11.2.3.3. SWOT Analysis
- 11.2.3.4. Recent Developments
- 11.2.3.5. Financials (Based on Availability)
- 11.2.4 Kyowa Kirin
- 11.2.4.1. Overview
- 11.2.4.2. Products
- 11.2.4.3. SWOT Analysis
- 11.2.4.4. Recent Developments
- 11.2.4.5. Financials (Based on Availability)
- 11.2.5 LG Chem
- 11.2.5.1. Overview
- 11.2.5.2. Products
- 11.2.5.3. SWOT Analysis
- 11.2.5.4. Recent Developments
- 11.2.5.5. Financials (Based on Availability)
- 11.2.6 Daewoong Pharmaceutical
- 11.2.6.1. Overview
- 11.2.6.2. Products
- 11.2.6.3. SWOT Analysis
- 11.2.6.4. Recent Developments
- 11.2.6.5. Financials (Based on Availability)
- 11.2.7 Wockhardt
- 11.2.7.1. Overview
- 11.2.7.2. Products
- 11.2.7.3. SWOT Analysis
- 11.2.7.4. Recent Developments
- 11.2.7.5. Financials (Based on Availability)
- 11.2.8 CJ Healthcare
- 11.2.8.1. Overview
- 11.2.8.2. Products
- 11.2.8.3. SWOT Analysis
- 11.2.8.4. Recent Developments
- 11.2.8.5. Financials (Based on Availability)
- 11.2.9 3SBio
- 11.2.9.1. Overview
- 11.2.9.2. Products
- 11.2.9.3. SWOT Analysis
- 11.2.9.4. Recent Developments
- 11.2.9.5. Financials (Based on Availability)
- 11.2.10 Kexing Biopharm
- 11.2.10.1. Overview
- 11.2.10.2. Products
- 11.2.10.3. SWOT Analysis
- 11.2.10.4. Recent Developments
- 11.2.10.5. Financials (Based on Availability)
- 11.2.11 Harbin Pharmaceutical Group
- 11.2.11.1. Overview
- 11.2.11.2. Products
- 11.2.11.3. SWOT Analysis
- 11.2.11.4. Recent Developments
- 11.2.11.5. Financials (Based on Availability)
- 11.2.12 Beijing Four Rings Bio-Pharmaceutical
- 11.2.12.1. Overview
- 11.2.12.2. Products
- 11.2.12.3. SWOT Analysis
- 11.2.12.4. Recent Developments
- 11.2.12.5. Financials (Based on Availability)
- 11.2.1 Amgen
List of Figures
- Figure 1: Global Medical Erythropoietin Injection Revenue Breakdown (million, %) by Region 2024 & 2032
- Figure 2: North America Medical Erythropoietin Injection Revenue (million), by Application 2024 & 2032
- Figure 3: North America Medical Erythropoietin Injection Revenue Share (%), by Application 2024 & 2032
- Figure 4: North America Medical Erythropoietin Injection Revenue (million), by Types 2024 & 2032
- Figure 5: North America Medical Erythropoietin Injection Revenue Share (%), by Types 2024 & 2032
- Figure 6: North America Medical Erythropoietin Injection Revenue (million), by Country 2024 & 2032
- Figure 7: North America Medical Erythropoietin Injection Revenue Share (%), by Country 2024 & 2032
- Figure 8: South America Medical Erythropoietin Injection Revenue (million), by Application 2024 & 2032
- Figure 9: South America Medical Erythropoietin Injection Revenue Share (%), by Application 2024 & 2032
- Figure 10: South America Medical Erythropoietin Injection Revenue (million), by Types 2024 & 2032
- Figure 11: South America Medical Erythropoietin Injection Revenue Share (%), by Types 2024 & 2032
- Figure 12: South America Medical Erythropoietin Injection Revenue (million), by Country 2024 & 2032
- Figure 13: South America Medical Erythropoietin Injection Revenue Share (%), by Country 2024 & 2032
- Figure 14: Europe Medical Erythropoietin Injection Revenue (million), by Application 2024 & 2032
- Figure 15: Europe Medical Erythropoietin Injection Revenue Share (%), by Application 2024 & 2032
- Figure 16: Europe Medical Erythropoietin Injection Revenue (million), by Types 2024 & 2032
- Figure 17: Europe Medical Erythropoietin Injection Revenue Share (%), by Types 2024 & 2032
- Figure 18: Europe Medical Erythropoietin Injection Revenue (million), by Country 2024 & 2032
- Figure 19: Europe Medical Erythropoietin Injection Revenue Share (%), by Country 2024 & 2032
- Figure 20: Middle East & Africa Medical Erythropoietin Injection Revenue (million), by Application 2024 & 2032
- Figure 21: Middle East & Africa Medical Erythropoietin Injection Revenue Share (%), by Application 2024 & 2032
- Figure 22: Middle East & Africa Medical Erythropoietin Injection Revenue (million), by Types 2024 & 2032
- Figure 23: Middle East & Africa Medical Erythropoietin Injection Revenue Share (%), by Types 2024 & 2032
- Figure 24: Middle East & Africa Medical Erythropoietin Injection Revenue (million), by Country 2024 & 2032
- Figure 25: Middle East & Africa Medical Erythropoietin Injection Revenue Share (%), by Country 2024 & 2032
- Figure 26: Asia Pacific Medical Erythropoietin Injection Revenue (million), by Application 2024 & 2032
- Figure 27: Asia Pacific Medical Erythropoietin Injection Revenue Share (%), by Application 2024 & 2032
- Figure 28: Asia Pacific Medical Erythropoietin Injection Revenue (million), by Types 2024 & 2032
- Figure 29: Asia Pacific Medical Erythropoietin Injection Revenue Share (%), by Types 2024 & 2032
- Figure 30: Asia Pacific Medical Erythropoietin Injection Revenue (million), by Country 2024 & 2032
- Figure 31: Asia Pacific Medical Erythropoietin Injection Revenue Share (%), by Country 2024 & 2032
List of Tables
- Table 1: Global Medical Erythropoietin Injection Revenue million Forecast, by Region 2019 & 2032
- Table 2: Global Medical Erythropoietin Injection Revenue million Forecast, by Application 2019 & 2032
- Table 3: Global Medical Erythropoietin Injection Revenue million Forecast, by Types 2019 & 2032
- Table 4: Global Medical Erythropoietin Injection Revenue million Forecast, by Region 2019 & 2032
- Table 5: Global Medical Erythropoietin Injection Revenue million Forecast, by Application 2019 & 2032
- Table 6: Global Medical Erythropoietin Injection Revenue million Forecast, by Types 2019 & 2032
- Table 7: Global Medical Erythropoietin Injection Revenue million Forecast, by Country 2019 & 2032
- Table 8: United States Medical Erythropoietin Injection Revenue (million) Forecast, by Application 2019 & 2032
- Table 9: Canada Medical Erythropoietin Injection Revenue (million) Forecast, by Application 2019 & 2032
- Table 10: Mexico Medical Erythropoietin Injection Revenue (million) Forecast, by Application 2019 & 2032
- Table 11: Global Medical Erythropoietin Injection Revenue million Forecast, by Application 2019 & 2032
- Table 12: Global Medical Erythropoietin Injection Revenue million Forecast, by Types 2019 & 2032
- Table 13: Global Medical Erythropoietin Injection Revenue million Forecast, by Country 2019 & 2032
- Table 14: Brazil Medical Erythropoietin Injection Revenue (million) Forecast, by Application 2019 & 2032
- Table 15: Argentina Medical Erythropoietin Injection Revenue (million) Forecast, by Application 2019 & 2032
- Table 16: Rest of South America Medical Erythropoietin Injection Revenue (million) Forecast, by Application 2019 & 2032
- Table 17: Global Medical Erythropoietin Injection Revenue million Forecast, by Application 2019 & 2032
- Table 18: Global Medical Erythropoietin Injection Revenue million Forecast, by Types 2019 & 2032
- Table 19: Global Medical Erythropoietin Injection Revenue million Forecast, by Country 2019 & 2032
- Table 20: United Kingdom Medical Erythropoietin Injection Revenue (million) Forecast, by Application 2019 & 2032
- Table 21: Germany Medical Erythropoietin Injection Revenue (million) Forecast, by Application 2019 & 2032
- Table 22: France Medical Erythropoietin Injection Revenue (million) Forecast, by Application 2019 & 2032
- Table 23: Italy Medical Erythropoietin Injection Revenue (million) Forecast, by Application 2019 & 2032
- Table 24: Spain Medical Erythropoietin Injection Revenue (million) Forecast, by Application 2019 & 2032
- Table 25: Russia Medical Erythropoietin Injection Revenue (million) Forecast, by Application 2019 & 2032
- Table 26: Benelux Medical Erythropoietin Injection Revenue (million) Forecast, by Application 2019 & 2032
- Table 27: Nordics Medical Erythropoietin Injection Revenue (million) Forecast, by Application 2019 & 2032
- Table 28: Rest of Europe Medical Erythropoietin Injection Revenue (million) Forecast, by Application 2019 & 2032
- Table 29: Global Medical Erythropoietin Injection Revenue million Forecast, by Application 2019 & 2032
- Table 30: Global Medical Erythropoietin Injection Revenue million Forecast, by Types 2019 & 2032
- Table 31: Global Medical Erythropoietin Injection Revenue million Forecast, by Country 2019 & 2032
- Table 32: Turkey Medical Erythropoietin Injection Revenue (million) Forecast, by Application 2019 & 2032
- Table 33: Israel Medical Erythropoietin Injection Revenue (million) Forecast, by Application 2019 & 2032
- Table 34: GCC Medical Erythropoietin Injection Revenue (million) Forecast, by Application 2019 & 2032
- Table 35: North Africa Medical Erythropoietin Injection Revenue (million) Forecast, by Application 2019 & 2032
- Table 36: South Africa Medical Erythropoietin Injection Revenue (million) Forecast, by Application 2019 & 2032
- Table 37: Rest of Middle East & Africa Medical Erythropoietin Injection Revenue (million) Forecast, by Application 2019 & 2032
- Table 38: Global Medical Erythropoietin Injection Revenue million Forecast, by Application 2019 & 2032
- Table 39: Global Medical Erythropoietin Injection Revenue million Forecast, by Types 2019 & 2032
- Table 40: Global Medical Erythropoietin Injection Revenue million Forecast, by Country 2019 & 2032
- Table 41: China Medical Erythropoietin Injection Revenue (million) Forecast, by Application 2019 & 2032
- Table 42: India Medical Erythropoietin Injection Revenue (million) Forecast, by Application 2019 & 2032
- Table 43: Japan Medical Erythropoietin Injection Revenue (million) Forecast, by Application 2019 & 2032
- Table 44: South Korea Medical Erythropoietin Injection Revenue (million) Forecast, by Application 2019 & 2032
- Table 45: ASEAN Medical Erythropoietin Injection Revenue (million) Forecast, by Application 2019 & 2032
- Table 46: Oceania Medical Erythropoietin Injection Revenue (million) Forecast, by Application 2019 & 2032
- Table 47: Rest of Asia Pacific Medical Erythropoietin Injection Revenue (million) Forecast, by Application 2019 & 2032
Frequently Asked Questions
1. What is the projected Compound Annual Growth Rate (CAGR) of the Medical Erythropoietin Injection?
The projected CAGR is approximately XX%.
2. Which companies are prominent players in the Medical Erythropoietin Injection?
Key companies in the market include Amgen, Johnson & Johnson, Roche, Kyowa Kirin, LG Chem, Daewoong Pharmaceutical, Wockhardt, CJ Healthcare, 3SBio, Kexing Biopharm, Harbin Pharmaceutical Group, Beijing Four Rings Bio-Pharmaceutical.
3. What are the main segments of the Medical Erythropoietin Injection?
The market segments include Application, Types.
4. Can you provide details about the market size?
The market size is estimated to be USD XXX million as of 2022.
5. What are some drivers contributing to market growth?
N/A
6. What are the notable trends driving market growth?
N/A
7. Are there any restraints impacting market growth?
N/A
8. Can you provide examples of recent developments in the market?
N/A
9. What pricing options are available for accessing the report?
Pricing options include single-user, multi-user, and enterprise licenses priced at USD 2900.00, USD 4350.00, and USD 5800.00 respectively.
10. Is the market size provided in terms of value or volume?
The market size is provided in terms of value, measured in million.
11. Are there any specific market keywords associated with the report?
Yes, the market keyword associated with the report is "Medical Erythropoietin Injection," which aids in identifying and referencing the specific market segment covered.
12. How do I determine which pricing option suits my needs best?
The pricing options vary based on user requirements and access needs. Individual users may opt for single-user licenses, while businesses requiring broader access may choose multi-user or enterprise licenses for cost-effective access to the report.
13. Are there any additional resources or data provided in the Medical Erythropoietin Injection report?
While the report offers comprehensive insights, it's advisable to review the specific contents or supplementary materials provided to ascertain if additional resources or data are available.
14. How can I stay updated on further developments or reports in the Medical Erythropoietin Injection?
To stay informed about further developments, trends, and reports in the Medical Erythropoietin Injection, consider subscribing to industry newsletters, following relevant companies and organizations, or regularly checking reputable industry news sources and publications.
Methodology
Step 1 - Identification of Relevant Samples Size from Population Database


Step 2 - Approaches for Defining Global Market Size (Value, Volume* & Price*)

Note*: In applicable scenarios
Step 3 - Data Sources
Primary Research
- Web Analytics
- Survey Reports
- Research Institute
- Latest Research Reports
- Opinion Leaders
Secondary Research
- Annual Reports
- White Paper
- Latest Press Release
- Industry Association
- Paid Database
- Investor Presentations

Step 4 - Data Triangulation
Involves using different sources of information in order to increase the validity of a study
These sources are likely to be stakeholders in a program - participants, other researchers, program staff, other community members, and so on.
Then we put all data in single framework & apply various statistical tools to find out the dynamic on the market.
During the analysis stage, feedback from the stakeholder groups would be compared to determine areas of agreement as well as areas of divergence
