

Key Insights
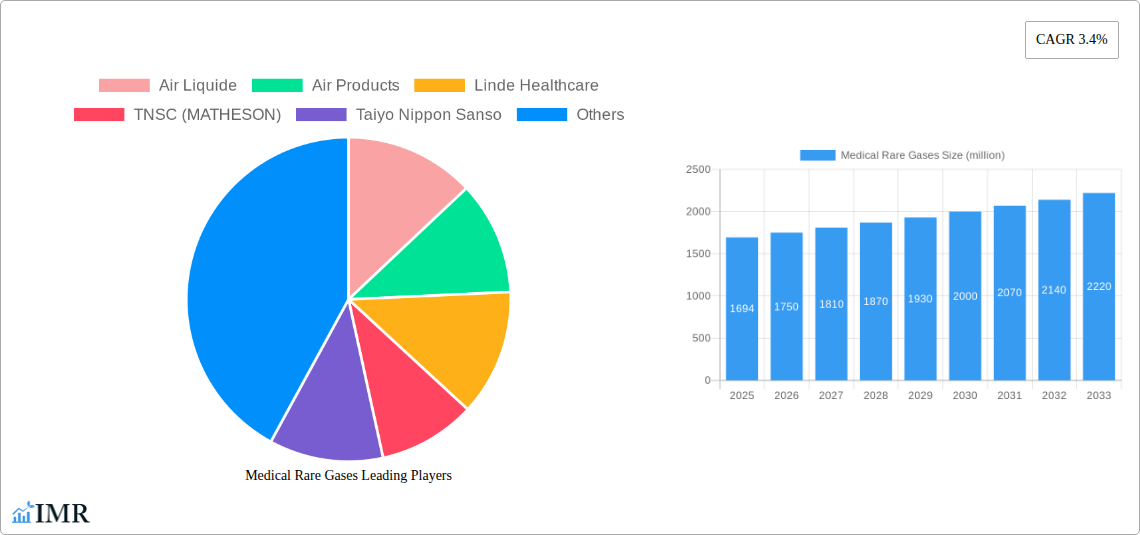
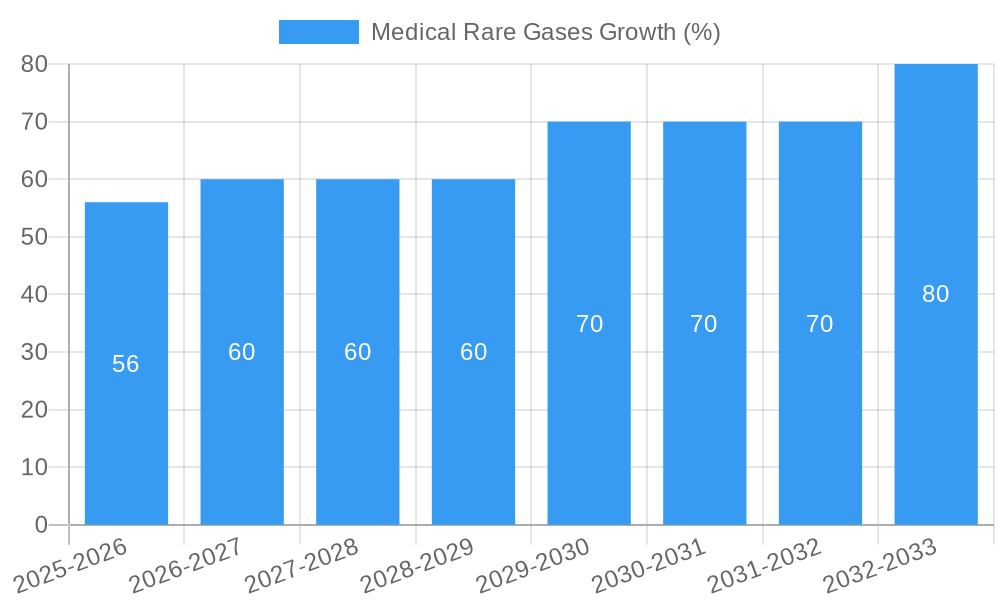
The medical rare gases market, currently valued at $1694 million in 2025, is projected to experience steady growth, driven by increasing demand for advanced medical technologies and procedures. The Compound Annual Growth Rate (CAGR) of 3.4% from 2025 to 2033 indicates a significant expansion, particularly fueled by the rising prevalence of chronic respiratory illnesses requiring specialized gas therapies like helium and xenon for imaging and treatment. Technological advancements in cryosurgery and laser treatments further contribute to market growth, as these procedures rely heavily on precision-controlled rare gas applications. Major players like Air Liquide, Air Products, and Linde Healthcare are at the forefront of innovation, constantly improving the efficiency and safety of their medical rare gas products and services. This competitive landscape fosters technological advancements and drives market expansion, although regulatory hurdles and the inherent challenges in gas handling and transportation can act as moderating factors. The market segmentation, while not explicitly provided, likely involves different rare gases (Helium, Xenon, Argon, Krypton etc.) used in various medical applications, with each segment exhibiting unique growth trajectories influenced by specific clinical needs and technological progress.
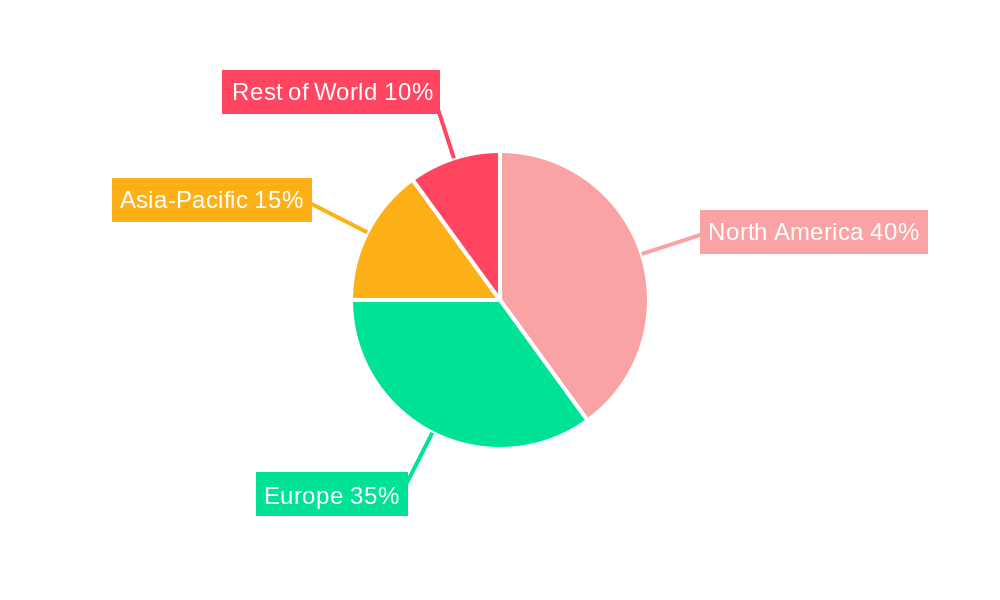
The forecast period (2025-2033) anticipates continued market expansion, exceeding $2,200 million by 2033, driven by factors such as aging populations requiring more advanced medical care and the development of novel therapeutic applications for rare gases. However, pricing pressures and potential competition from alternative medical technologies may moderate growth. Regional variations will likely reflect differences in healthcare infrastructure and spending, with North America and Europe dominating the market initially, followed by an increasing contribution from Asia-Pacific due to rising healthcare expenditure and economic development in the region. Strategic partnerships, mergers and acquisitions, and continuous research and development efforts by key players are anticipated to shape the market landscape during the forecast period.
Medical Rare Gases Market Report: 2019-2033
Dive deep into the lucrative medical rare gases market with this comprehensive report, providing an in-depth analysis of market dynamics, growth trends, and future opportunities. This report covers the parent market of industrial gases and the child market of medical gases, offering a complete perspective on this specialized sector. The study period spans from 2019 to 2033, with 2025 serving as both the base and estimated year. The forecast period is 2025-2033, and the historical period covers 2019-2024. The market is valued at xx million in 2025 and is projected to reach xx million by 2033.
Medical Rare Gases Market Dynamics & Structure
This section analyzes the competitive landscape, technological advancements, regulatory environment, and market trends within the medical rare gases industry. The market exhibits a moderately concentrated structure, with key players holding significant market share.
- Market Concentration: The top 5 players (Air Liquide, Air Products, Linde Healthcare, TNSC (Matheson), and Taiyo Nippon Sanso) account for approximately xx% of the global market share in 2025.
- Technological Innovation: Continuous innovation in gas purification, delivery systems, and medical applications is a major driver. Miniaturization and improved efficiency are key focus areas.
- Regulatory Frameworks: Stringent regulations regarding gas purity, safety, and handling impact market dynamics. Variations in regulatory landscapes across different regions influence market access.
- Competitive Product Substitutes: Limited viable substitutes exist for rare gases in specific medical applications, contributing to market stability.
- End-User Demographics: The growth of the aging population and increasing prevalence of chronic diseases fuel demand for medical rare gases.
- M&A Trends: The industry has witnessed xx M&A deals in the historical period (2019-2024), mainly focused on expanding product portfolios and geographic reach. Further consolidation is expected in the forecast period.
Medical Rare Gases Growth Trends & Insights
Utilizing comprehensive market research data, this section provides a detailed analysis of market size evolution, adoption rates, technological disruptions, and shifting consumer behaviors. The medical rare gases market is experiencing robust growth driven by increasing healthcare expenditure and advancements in medical technology.
The market exhibited a CAGR of xx% during the historical period (2019-2024) and is projected to maintain a CAGR of xx% during the forecast period (2025-2033). This growth is attributed to factors such as rising demand for minimally invasive surgeries, increased adoption of advanced imaging techniques (MRI, PET scans), and the growing preference for effective and safer anesthetic agents. Market penetration remains relatively high in developed economies but shows substantial growth potential in emerging markets. Technological advancements, such as improved gas delivery systems and new applications, further accelerate market expansion.
Dominant Regions, Countries, or Segments in Medical Rare Gases
North America currently dominates the medical rare gases market, followed by Europe and Asia Pacific. The dominance of North America is attributed to several factors:
- Advanced Healthcare Infrastructure: Highly developed healthcare infrastructure supports the widespread adoption of medical rare gases.
- High Healthcare Expenditure: Increased investment in healthcare research and development boosts demand.
- Stringent Regulatory Approvals: Facilitates the entry and availability of advanced medical gases.
- Strong Presence of Key Players: Major manufacturers have significant operational presence and distribution networks in the region.
However, Asia-Pacific is expected to witness the fastest growth rate during the forecast period, driven by rising healthcare expenditure, improving healthcare infrastructure, and an expanding middle class.
Medical Rare Gases Product Landscape
Medical rare gases, including helium, neon, argon, krypton, and xenon, find diverse applications in medical imaging (MRI, CT scans), laser surgery, cryosurgery, and anesthesia. Recent innovations focus on improving gas purity, enhancing delivery systems, and developing new applications, such as targeted drug delivery systems utilizing rare gases. The unique selling propositions revolve around the high purity and precision delivery of these gases for optimal clinical outcomes. Technological advancements focus on minimizing waste and improving efficiency of delivery systems.
Key Drivers, Barriers & Challenges in Medical Rare Gases
Key Drivers:
- Increasing demand from the healthcare sector fueled by the rising prevalence of chronic diseases.
- Technological advancements in medical equipment that rely on rare gases.
- Favorable regulatory environment in certain regions.
Challenges & Restraints:
- Price volatility of raw materials and potential supply chain disruptions.
- Stringent regulatory requirements for gas purity and safety standards create barriers for market entry for smaller players.
- Intense competition among established players.
Emerging Opportunities in Medical Rare Gases
Emerging opportunities include the exploration of novel applications in targeted drug delivery, improved gas purification techniques leading to cost reductions, and expansion into untapped markets in developing economies. The development of more efficient and cost-effective gas delivery systems presents significant opportunities for growth.
Growth Accelerators in the Medical Rare Gases Industry
Technological breakthroughs in gas separation and purification technologies are major catalysts for growth. Strategic partnerships between gas manufacturers and medical device companies are further accelerating market expansion. Market expansion into underpenetrated regions and new applications in emerging fields are also significant growth drivers.
Key Players Shaping the Medical Rare Gases Market
- Air Liquide
- Air Products
- Linde Healthcare
- TNSC (Matheson)
- Taiyo Nippon Sanso
- AMCS Corporation
- Jinhong Group
Notable Milestones in Medical Rare Gases Sector
- 2021: Air Liquide launched a new generation of medical-grade helium purification system.
- 2022: Linde Healthcare acquired a smaller medical gas company, expanding its market reach.
- 2023: Significant investment in R&D for developing new applications of xenon in anesthesia.
In-Depth Medical Rare Gases Market Outlook
The medical rare gases market is poised for continued growth, driven by technological innovation, expanding applications, and increasing healthcare spending globally. Strategic partnerships and market expansion into emerging economies represent significant opportunities for market players. The development of novel applications and cost-effective delivery systems will further propel market expansion in the coming years.
Medical Rare Gases Segmentation
-
1. Application
- 1.1. Hospitals and Clinics
- 1.2. Home Healthcare
- 1.3. Pharmaceutical and Biotechnology Industries
- 1.4. Others
-
2. Type
- 2.1. Neon
- 2.2. Krypton
- 2.3. Xenon
- 2.4. Others
Medical Rare Gases Segmentation By Geography
-
1. North America
- 1.1. United States
- 1.2. Canada
- 1.3. Mexico
-
2. South America
- 2.1. Brazil
- 2.2. Argentina
- 2.3. Rest of South America
-
3. Europe
- 3.1. United Kingdom
- 3.2. Germany
- 3.3. France
- 3.4. Italy
- 3.5. Spain
- 3.6. Russia
- 3.7. Benelux
- 3.8. Nordics
- 3.9. Rest of Europe
-
4. Middle East & Africa
- 4.1. Turkey
- 4.2. Israel
- 4.3. GCC
- 4.4. North Africa
- 4.5. South Africa
- 4.6. Rest of Middle East & Africa
-
5. Asia Pacific
- 5.1. China
- 5.2. India
- 5.3. Japan
- 5.4. South Korea
- 5.5. ASEAN
- 5.6. Oceania
- 5.7. Rest of Asia Pacific
Medical Rare Gases REPORT HIGHLIGHTS
| Aspects | Details |
|---|---|
| Study Period | 2019-2033 |
| Base Year | 2024 |
| Estimated Year | 2025 |
| Forecast Period | 2025-2033 |
| Historical Period | 2019-2024 |
| Growth Rate | CAGR of 3.4% from 2019-2033 |
| Segmentation |
|
Table of Contents
- 1. Introduction
- 1.1. Research Scope
- 1.2. Market Segmentation
- 1.3. Research Methodology
- 1.4. Definitions and Assumptions
- 2. Executive Summary
- 2.1. Introduction
- 3. Market Dynamics
- 3.1. Introduction
- 3.2. Market Drivers
- 3.3. Market Restrains
- 3.4. Market Trends
- 4. Market Factor Analysis
- 4.1. Porters Five Forces
- 4.2. Supply/Value Chain
- 4.3. PESTEL analysis
- 4.4. Market Entropy
- 4.5. Patent/Trademark Analysis
- 5. Global Medical Rare Gases Analysis, Insights and Forecast, 2019-2031
- 5.1. Market Analysis, Insights and Forecast - by Application
- 5.1.1. Hospitals and Clinics
- 5.1.2. Home Healthcare
- 5.1.3. Pharmaceutical and Biotechnology Industries
- 5.1.4. Others
- 5.2. Market Analysis, Insights and Forecast - by Type
- 5.2.1. Neon
- 5.2.2. Krypton
- 5.2.3. Xenon
- 5.2.4. Others
- 5.3. Market Analysis, Insights and Forecast - by Region
- 5.3.1. North America
- 5.3.2. South America
- 5.3.3. Europe
- 5.3.4. Middle East & Africa
- 5.3.5. Asia Pacific
- 5.1. Market Analysis, Insights and Forecast - by Application
- 6. North America Medical Rare Gases Analysis, Insights and Forecast, 2019-2031
- 6.1. Market Analysis, Insights and Forecast - by Application
- 6.1.1. Hospitals and Clinics
- 6.1.2. Home Healthcare
- 6.1.3. Pharmaceutical and Biotechnology Industries
- 6.1.4. Others
- 6.2. Market Analysis, Insights and Forecast - by Type
- 6.2.1. Neon
- 6.2.2. Krypton
- 6.2.3. Xenon
- 6.2.4. Others
- 6.1. Market Analysis, Insights and Forecast - by Application
- 7. South America Medical Rare Gases Analysis, Insights and Forecast, 2019-2031
- 7.1. Market Analysis, Insights and Forecast - by Application
- 7.1.1. Hospitals and Clinics
- 7.1.2. Home Healthcare
- 7.1.3. Pharmaceutical and Biotechnology Industries
- 7.1.4. Others
- 7.2. Market Analysis, Insights and Forecast - by Type
- 7.2.1. Neon
- 7.2.2. Krypton
- 7.2.3. Xenon
- 7.2.4. Others
- 7.1. Market Analysis, Insights and Forecast - by Application
- 8. Europe Medical Rare Gases Analysis, Insights and Forecast, 2019-2031
- 8.1. Market Analysis, Insights and Forecast - by Application
- 8.1.1. Hospitals and Clinics
- 8.1.2. Home Healthcare
- 8.1.3. Pharmaceutical and Biotechnology Industries
- 8.1.4. Others
- 8.2. Market Analysis, Insights and Forecast - by Type
- 8.2.1. Neon
- 8.2.2. Krypton
- 8.2.3. Xenon
- 8.2.4. Others
- 8.1. Market Analysis, Insights and Forecast - by Application
- 9. Middle East & Africa Medical Rare Gases Analysis, Insights and Forecast, 2019-2031
- 9.1. Market Analysis, Insights and Forecast - by Application
- 9.1.1. Hospitals and Clinics
- 9.1.2. Home Healthcare
- 9.1.3. Pharmaceutical and Biotechnology Industries
- 9.1.4. Others
- 9.2. Market Analysis, Insights and Forecast - by Type
- 9.2.1. Neon
- 9.2.2. Krypton
- 9.2.3. Xenon
- 9.2.4. Others
- 9.1. Market Analysis, Insights and Forecast - by Application
- 10. Asia Pacific Medical Rare Gases Analysis, Insights and Forecast, 2019-2031
- 10.1. Market Analysis, Insights and Forecast - by Application
- 10.1.1. Hospitals and Clinics
- 10.1.2. Home Healthcare
- 10.1.3. Pharmaceutical and Biotechnology Industries
- 10.1.4. Others
- 10.2. Market Analysis, Insights and Forecast - by Type
- 10.2.1. Neon
- 10.2.2. Krypton
- 10.2.3. Xenon
- 10.2.4. Others
- 10.1. Market Analysis, Insights and Forecast - by Application
- 11. Competitive Analysis
- 11.1. Global Market Share Analysis 2024
- 11.2. Company Profiles
- 11.2.1 Air Liquide
- 11.2.1.1. Overview
- 11.2.1.2. Products
- 11.2.1.3. SWOT Analysis
- 11.2.1.4. Recent Developments
- 11.2.1.5. Financials (Based on Availability)
- 11.2.2 Air Products
- 11.2.2.1. Overview
- 11.2.2.2. Products
- 11.2.2.3. SWOT Analysis
- 11.2.2.4. Recent Developments
- 11.2.2.5. Financials (Based on Availability)
- 11.2.3 Linde Healthcare
- 11.2.3.1. Overview
- 11.2.3.2. Products
- 11.2.3.3. SWOT Analysis
- 11.2.3.4. Recent Developments
- 11.2.3.5. Financials (Based on Availability)
- 11.2.4 TNSC (MATHESON)
- 11.2.4.1. Overview
- 11.2.4.2. Products
- 11.2.4.3. SWOT Analysis
- 11.2.4.4. Recent Developments
- 11.2.4.5. Financials (Based on Availability)
- 11.2.5 Taiyo Nippon Sanso
- 11.2.5.1. Overview
- 11.2.5.2. Products
- 11.2.5.3. SWOT Analysis
- 11.2.5.4. Recent Developments
- 11.2.5.5. Financials (Based on Availability)
- 11.2.6 AMCS Corporation
- 11.2.6.1. Overview
- 11.2.6.2. Products
- 11.2.6.3. SWOT Analysis
- 11.2.6.4. Recent Developments
- 11.2.6.5. Financials (Based on Availability)
- 11.2.7 Jinhong Group
- 11.2.7.1. Overview
- 11.2.7.2. Products
- 11.2.7.3. SWOT Analysis
- 11.2.7.4. Recent Developments
- 11.2.7.5. Financials (Based on Availability)
- 11.2.1 Air Liquide
List of Figures
- Figure 1: Global Medical Rare Gases Revenue Breakdown (million, %) by Region 2024 & 2032
- Figure 2: Global Medical Rare Gases Volume Breakdown (K, %) by Region 2024 & 2032
- Figure 3: North America Medical Rare Gases Revenue (million), by Application 2024 & 2032
- Figure 4: North America Medical Rare Gases Volume (K), by Application 2024 & 2032
- Figure 5: North America Medical Rare Gases Revenue Share (%), by Application 2024 & 2032
- Figure 6: North America Medical Rare Gases Volume Share (%), by Application 2024 & 2032
- Figure 7: North America Medical Rare Gases Revenue (million), by Type 2024 & 2032
- Figure 8: North America Medical Rare Gases Volume (K), by Type 2024 & 2032
- Figure 9: North America Medical Rare Gases Revenue Share (%), by Type 2024 & 2032
- Figure 10: North America Medical Rare Gases Volume Share (%), by Type 2024 & 2032
- Figure 11: North America Medical Rare Gases Revenue (million), by Country 2024 & 2032
- Figure 12: North America Medical Rare Gases Volume (K), by Country 2024 & 2032
- Figure 13: North America Medical Rare Gases Revenue Share (%), by Country 2024 & 2032
- Figure 14: North America Medical Rare Gases Volume Share (%), by Country 2024 & 2032
- Figure 15: South America Medical Rare Gases Revenue (million), by Application 2024 & 2032
- Figure 16: South America Medical Rare Gases Volume (K), by Application 2024 & 2032
- Figure 17: South America Medical Rare Gases Revenue Share (%), by Application 2024 & 2032
- Figure 18: South America Medical Rare Gases Volume Share (%), by Application 2024 & 2032
- Figure 19: South America Medical Rare Gases Revenue (million), by Type 2024 & 2032
- Figure 20: South America Medical Rare Gases Volume (K), by Type 2024 & 2032
- Figure 21: South America Medical Rare Gases Revenue Share (%), by Type 2024 & 2032
- Figure 22: South America Medical Rare Gases Volume Share (%), by Type 2024 & 2032
- Figure 23: South America Medical Rare Gases Revenue (million), by Country 2024 & 2032
- Figure 24: South America Medical Rare Gases Volume (K), by Country 2024 & 2032
- Figure 25: South America Medical Rare Gases Revenue Share (%), by Country 2024 & 2032
- Figure 26: South America Medical Rare Gases Volume Share (%), by Country 2024 & 2032
- Figure 27: Europe Medical Rare Gases Revenue (million), by Application 2024 & 2032
- Figure 28: Europe Medical Rare Gases Volume (K), by Application 2024 & 2032
- Figure 29: Europe Medical Rare Gases Revenue Share (%), by Application 2024 & 2032
- Figure 30: Europe Medical Rare Gases Volume Share (%), by Application 2024 & 2032
- Figure 31: Europe Medical Rare Gases Revenue (million), by Type 2024 & 2032
- Figure 32: Europe Medical Rare Gases Volume (K), by Type 2024 & 2032
- Figure 33: Europe Medical Rare Gases Revenue Share (%), by Type 2024 & 2032
- Figure 34: Europe Medical Rare Gases Volume Share (%), by Type 2024 & 2032
- Figure 35: Europe Medical Rare Gases Revenue (million), by Country 2024 & 2032
- Figure 36: Europe Medical Rare Gases Volume (K), by Country 2024 & 2032
- Figure 37: Europe Medical Rare Gases Revenue Share (%), by Country 2024 & 2032
- Figure 38: Europe Medical Rare Gases Volume Share (%), by Country 2024 & 2032
- Figure 39: Middle East & Africa Medical Rare Gases Revenue (million), by Application 2024 & 2032
- Figure 40: Middle East & Africa Medical Rare Gases Volume (K), by Application 2024 & 2032
- Figure 41: Middle East & Africa Medical Rare Gases Revenue Share (%), by Application 2024 & 2032
- Figure 42: Middle East & Africa Medical Rare Gases Volume Share (%), by Application 2024 & 2032
- Figure 43: Middle East & Africa Medical Rare Gases Revenue (million), by Type 2024 & 2032
- Figure 44: Middle East & Africa Medical Rare Gases Volume (K), by Type 2024 & 2032
- Figure 45: Middle East & Africa Medical Rare Gases Revenue Share (%), by Type 2024 & 2032
- Figure 46: Middle East & Africa Medical Rare Gases Volume Share (%), by Type 2024 & 2032
- Figure 47: Middle East & Africa Medical Rare Gases Revenue (million), by Country 2024 & 2032
- Figure 48: Middle East & Africa Medical Rare Gases Volume (K), by Country 2024 & 2032
- Figure 49: Middle East & Africa Medical Rare Gases Revenue Share (%), by Country 2024 & 2032
- Figure 50: Middle East & Africa Medical Rare Gases Volume Share (%), by Country 2024 & 2032
- Figure 51: Asia Pacific Medical Rare Gases Revenue (million), by Application 2024 & 2032
- Figure 52: Asia Pacific Medical Rare Gases Volume (K), by Application 2024 & 2032
- Figure 53: Asia Pacific Medical Rare Gases Revenue Share (%), by Application 2024 & 2032
- Figure 54: Asia Pacific Medical Rare Gases Volume Share (%), by Application 2024 & 2032
- Figure 55: Asia Pacific Medical Rare Gases Revenue (million), by Type 2024 & 2032
- Figure 56: Asia Pacific Medical Rare Gases Volume (K), by Type 2024 & 2032
- Figure 57: Asia Pacific Medical Rare Gases Revenue Share (%), by Type 2024 & 2032
- Figure 58: Asia Pacific Medical Rare Gases Volume Share (%), by Type 2024 & 2032
- Figure 59: Asia Pacific Medical Rare Gases Revenue (million), by Country 2024 & 2032
- Figure 60: Asia Pacific Medical Rare Gases Volume (K), by Country 2024 & 2032
- Figure 61: Asia Pacific Medical Rare Gases Revenue Share (%), by Country 2024 & 2032
- Figure 62: Asia Pacific Medical Rare Gases Volume Share (%), by Country 2024 & 2032
List of Tables
- Table 1: Global Medical Rare Gases Revenue million Forecast, by Region 2019 & 2032
- Table 2: Global Medical Rare Gases Volume K Forecast, by Region 2019 & 2032
- Table 3: Global Medical Rare Gases Revenue million Forecast, by Application 2019 & 2032
- Table 4: Global Medical Rare Gases Volume K Forecast, by Application 2019 & 2032
- Table 5: Global Medical Rare Gases Revenue million Forecast, by Type 2019 & 2032
- Table 6: Global Medical Rare Gases Volume K Forecast, by Type 2019 & 2032
- Table 7: Global Medical Rare Gases Revenue million Forecast, by Region 2019 & 2032
- Table 8: Global Medical Rare Gases Volume K Forecast, by Region 2019 & 2032
- Table 9: Global Medical Rare Gases Revenue million Forecast, by Application 2019 & 2032
- Table 10: Global Medical Rare Gases Volume K Forecast, by Application 2019 & 2032
- Table 11: Global Medical Rare Gases Revenue million Forecast, by Type 2019 & 2032
- Table 12: Global Medical Rare Gases Volume K Forecast, by Type 2019 & 2032
- Table 13: Global Medical Rare Gases Revenue million Forecast, by Country 2019 & 2032
- Table 14: Global Medical Rare Gases Volume K Forecast, by Country 2019 & 2032
- Table 15: United States Medical Rare Gases Revenue (million) Forecast, by Application 2019 & 2032
- Table 16: United States Medical Rare Gases Volume (K) Forecast, by Application 2019 & 2032
- Table 17: Canada Medical Rare Gases Revenue (million) Forecast, by Application 2019 & 2032
- Table 18: Canada Medical Rare Gases Volume (K) Forecast, by Application 2019 & 2032
- Table 19: Mexico Medical Rare Gases Revenue (million) Forecast, by Application 2019 & 2032
- Table 20: Mexico Medical Rare Gases Volume (K) Forecast, by Application 2019 & 2032
- Table 21: Global Medical Rare Gases Revenue million Forecast, by Application 2019 & 2032
- Table 22: Global Medical Rare Gases Volume K Forecast, by Application 2019 & 2032
- Table 23: Global Medical Rare Gases Revenue million Forecast, by Type 2019 & 2032
- Table 24: Global Medical Rare Gases Volume K Forecast, by Type 2019 & 2032
- Table 25: Global Medical Rare Gases Revenue million Forecast, by Country 2019 & 2032
- Table 26: Global Medical Rare Gases Volume K Forecast, by Country 2019 & 2032
- Table 27: Brazil Medical Rare Gases Revenue (million) Forecast, by Application 2019 & 2032
- Table 28: Brazil Medical Rare Gases Volume (K) Forecast, by Application 2019 & 2032
- Table 29: Argentina Medical Rare Gases Revenue (million) Forecast, by Application 2019 & 2032
- Table 30: Argentina Medical Rare Gases Volume (K) Forecast, by Application 2019 & 2032
- Table 31: Rest of South America Medical Rare Gases Revenue (million) Forecast, by Application 2019 & 2032
- Table 32: Rest of South America Medical Rare Gases Volume (K) Forecast, by Application 2019 & 2032
- Table 33: Global Medical Rare Gases Revenue million Forecast, by Application 2019 & 2032
- Table 34: Global Medical Rare Gases Volume K Forecast, by Application 2019 & 2032
- Table 35: Global Medical Rare Gases Revenue million Forecast, by Type 2019 & 2032
- Table 36: Global Medical Rare Gases Volume K Forecast, by Type 2019 & 2032
- Table 37: Global Medical Rare Gases Revenue million Forecast, by Country 2019 & 2032
- Table 38: Global Medical Rare Gases Volume K Forecast, by Country 2019 & 2032
- Table 39: United Kingdom Medical Rare Gases Revenue (million) Forecast, by Application 2019 & 2032
- Table 40: United Kingdom Medical Rare Gases Volume (K) Forecast, by Application 2019 & 2032
- Table 41: Germany Medical Rare Gases Revenue (million) Forecast, by Application 2019 & 2032
- Table 42: Germany Medical Rare Gases Volume (K) Forecast, by Application 2019 & 2032
- Table 43: France Medical Rare Gases Revenue (million) Forecast, by Application 2019 & 2032
- Table 44: France Medical Rare Gases Volume (K) Forecast, by Application 2019 & 2032
- Table 45: Italy Medical Rare Gases Revenue (million) Forecast, by Application 2019 & 2032
- Table 46: Italy Medical Rare Gases Volume (K) Forecast, by Application 2019 & 2032
- Table 47: Spain Medical Rare Gases Revenue (million) Forecast, by Application 2019 & 2032
- Table 48: Spain Medical Rare Gases Volume (K) Forecast, by Application 2019 & 2032
- Table 49: Russia Medical Rare Gases Revenue (million) Forecast, by Application 2019 & 2032
- Table 50: Russia Medical Rare Gases Volume (K) Forecast, by Application 2019 & 2032
- Table 51: Benelux Medical Rare Gases Revenue (million) Forecast, by Application 2019 & 2032
- Table 52: Benelux Medical Rare Gases Volume (K) Forecast, by Application 2019 & 2032
- Table 53: Nordics Medical Rare Gases Revenue (million) Forecast, by Application 2019 & 2032
- Table 54: Nordics Medical Rare Gases Volume (K) Forecast, by Application 2019 & 2032
- Table 55: Rest of Europe Medical Rare Gases Revenue (million) Forecast, by Application 2019 & 2032
- Table 56: Rest of Europe Medical Rare Gases Volume (K) Forecast, by Application 2019 & 2032
- Table 57: Global Medical Rare Gases Revenue million Forecast, by Application 2019 & 2032
- Table 58: Global Medical Rare Gases Volume K Forecast, by Application 2019 & 2032
- Table 59: Global Medical Rare Gases Revenue million Forecast, by Type 2019 & 2032
- Table 60: Global Medical Rare Gases Volume K Forecast, by Type 2019 & 2032
- Table 61: Global Medical Rare Gases Revenue million Forecast, by Country 2019 & 2032
- Table 62: Global Medical Rare Gases Volume K Forecast, by Country 2019 & 2032
- Table 63: Turkey Medical Rare Gases Revenue (million) Forecast, by Application 2019 & 2032
- Table 64: Turkey Medical Rare Gases Volume (K) Forecast, by Application 2019 & 2032
- Table 65: Israel Medical Rare Gases Revenue (million) Forecast, by Application 2019 & 2032
- Table 66: Israel Medical Rare Gases Volume (K) Forecast, by Application 2019 & 2032
- Table 67: GCC Medical Rare Gases Revenue (million) Forecast, by Application 2019 & 2032
- Table 68: GCC Medical Rare Gases Volume (K) Forecast, by Application 2019 & 2032
- Table 69: North Africa Medical Rare Gases Revenue (million) Forecast, by Application 2019 & 2032
- Table 70: North Africa Medical Rare Gases Volume (K) Forecast, by Application 2019 & 2032
- Table 71: South Africa Medical Rare Gases Revenue (million) Forecast, by Application 2019 & 2032
- Table 72: South Africa Medical Rare Gases Volume (K) Forecast, by Application 2019 & 2032
- Table 73: Rest of Middle East & Africa Medical Rare Gases Revenue (million) Forecast, by Application 2019 & 2032
- Table 74: Rest of Middle East & Africa Medical Rare Gases Volume (K) Forecast, by Application 2019 & 2032
- Table 75: Global Medical Rare Gases Revenue million Forecast, by Application 2019 & 2032
- Table 76: Global Medical Rare Gases Volume K Forecast, by Application 2019 & 2032
- Table 77: Global Medical Rare Gases Revenue million Forecast, by Type 2019 & 2032
- Table 78: Global Medical Rare Gases Volume K Forecast, by Type 2019 & 2032
- Table 79: Global Medical Rare Gases Revenue million Forecast, by Country 2019 & 2032
- Table 80: Global Medical Rare Gases Volume K Forecast, by Country 2019 & 2032
- Table 81: China Medical Rare Gases Revenue (million) Forecast, by Application 2019 & 2032
- Table 82: China Medical Rare Gases Volume (K) Forecast, by Application 2019 & 2032
- Table 83: India Medical Rare Gases Revenue (million) Forecast, by Application 2019 & 2032
- Table 84: India Medical Rare Gases Volume (K) Forecast, by Application 2019 & 2032
- Table 85: Japan Medical Rare Gases Revenue (million) Forecast, by Application 2019 & 2032
- Table 86: Japan Medical Rare Gases Volume (K) Forecast, by Application 2019 & 2032
- Table 87: South Korea Medical Rare Gases Revenue (million) Forecast, by Application 2019 & 2032
- Table 88: South Korea Medical Rare Gases Volume (K) Forecast, by Application 2019 & 2032
- Table 89: ASEAN Medical Rare Gases Revenue (million) Forecast, by Application 2019 & 2032
- Table 90: ASEAN Medical Rare Gases Volume (K) Forecast, by Application 2019 & 2032
- Table 91: Oceania Medical Rare Gases Revenue (million) Forecast, by Application 2019 & 2032
- Table 92: Oceania Medical Rare Gases Volume (K) Forecast, by Application 2019 & 2032
- Table 93: Rest of Asia Pacific Medical Rare Gases Revenue (million) Forecast, by Application 2019 & 2032
- Table 94: Rest of Asia Pacific Medical Rare Gases Volume (K) Forecast, by Application 2019 & 2032
Frequently Asked Questions
1. What is the projected Compound Annual Growth Rate (CAGR) of the Medical Rare Gases?
The projected CAGR is approximately 3.4%.
2. Which companies are prominent players in the Medical Rare Gases?
Key companies in the market include Air Liquide, Air Products, Linde Healthcare, TNSC (MATHESON), Taiyo Nippon Sanso, AMCS Corporation, Jinhong Group.
3. What are the main segments of the Medical Rare Gases?
The market segments include Application, Type.
4. Can you provide details about the market size?
The market size is estimated to be USD 1694 million as of 2022.
5. What are some drivers contributing to market growth?
N/A
6. What are the notable trends driving market growth?
N/A
7. Are there any restraints impacting market growth?
N/A
8. Can you provide examples of recent developments in the market?
N/A
9. What pricing options are available for accessing the report?
Pricing options include single-user, multi-user, and enterprise licenses priced at USD 3950.00, USD 5925.00, and USD 7900.00 respectively.
10. Is the market size provided in terms of value or volume?
The market size is provided in terms of value, measured in million and volume, measured in K.
11. Are there any specific market keywords associated with the report?
Yes, the market keyword associated with the report is "Medical Rare Gases," which aids in identifying and referencing the specific market segment covered.
12. How do I determine which pricing option suits my needs best?
The pricing options vary based on user requirements and access needs. Individual users may opt for single-user licenses, while businesses requiring broader access may choose multi-user or enterprise licenses for cost-effective access to the report.
13. Are there any additional resources or data provided in the Medical Rare Gases report?
While the report offers comprehensive insights, it's advisable to review the specific contents or supplementary materials provided to ascertain if additional resources or data are available.
14. How can I stay updated on further developments or reports in the Medical Rare Gases?
To stay informed about further developments, trends, and reports in the Medical Rare Gases, consider subscribing to industry newsletters, following relevant companies and organizations, or regularly checking reputable industry news sources and publications.
Methodology
Step 1 - Identification of Relevant Samples Size from Population Database


Step 2 - Approaches for Defining Global Market Size (Value, Volume* & Price*)

Note*: In applicable scenarios
Step 3 - Data Sources
Primary Research
- Web Analytics
- Survey Reports
- Research Institute
- Latest Research Reports
- Opinion Leaders
Secondary Research
- Annual Reports
- White Paper
- Latest Press Release
- Industry Association
- Paid Database
- Investor Presentations

Step 4 - Data Triangulation
Involves using different sources of information in order to increase the validity of a study
These sources are likely to be stakeholders in a program - participants, other researchers, program staff, other community members, and so on.
Then we put all data in single framework & apply various statistical tools to find out the dynamic on the market.
During the analysis stage, feedback from the stakeholder groups would be compared to determine areas of agreement as well as areas of divergence
