

Key Insights
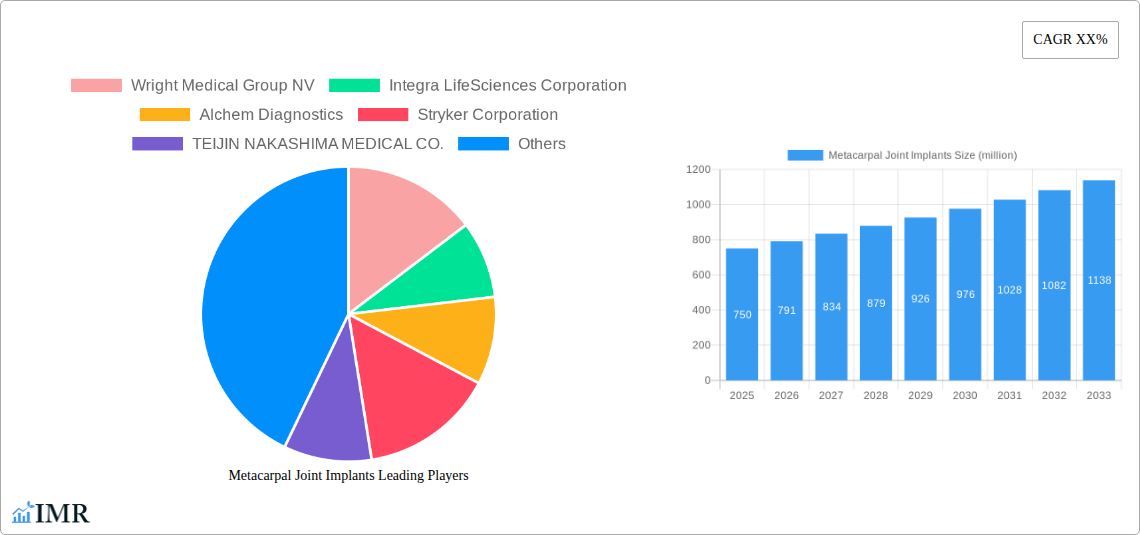
The global metacarpal joint implants market is experiencing robust growth, driven by an aging population, increasing prevalence of osteoarthritis and rheumatoid arthritis, and advancements in implant technology leading to improved surgical outcomes and patient satisfaction. The market's Compound Annual Growth Rate (CAGR) is estimated at 5.5% from 2025 to 2033, with a projected market size of $750 million in 2025. This growth is fueled by the increasing adoption of minimally invasive surgical techniques, resulting in reduced recovery times and improved patient outcomes. Furthermore, the development of biocompatible and durable materials for implants is contributing to the market's expansion. Key players such as Wright Medical Group NV, Integra LifeSciences Corporation, and Stryker Corporation are driving innovation through research and development, leading to the introduction of new and improved implants.
Despite these positive trends, challenges remain. High surgical costs, potential complications associated with the procedure, and the availability of alternative treatment options act as restraints. However, the continued increase in the geriatric population and rising incidence of hand-related conditions are expected to outweigh these constraints. Market segmentation is primarily based on implant type (e.g., silicone, metal), surgical approach, and end-user (hospitals, ambulatory surgical centers). Regional variations in healthcare infrastructure and access to advanced surgical technologies influence market growth, with North America and Europe currently holding significant market shares. The forecast period of 2025-2033 suggests a continued upward trajectory, supported by ongoing technological improvements and a growing need for effective hand surgery solutions.
Metacarpal Joint Implants Market Report: 2019-2033
This comprehensive report provides an in-depth analysis of the global Metacarpal Joint Implants market, encompassing market dynamics, growth trends, regional analysis, competitive landscape, and future outlook. The study period covers 2019-2033, with 2025 serving as the base and estimated year. The report caters to industry professionals, investors, and stakeholders seeking a complete understanding of this dynamic sector. The parent market is Orthopedic Implants and the child market is Hand & Wrist Implants.
Metacarpal Joint Implants Market Dynamics & Structure
This section analyzes the market's structure, identifying key trends influencing its evolution. The market size in 2025 is estimated at $xx million, expected to reach $xx million by 2033, exhibiting a CAGR of xx%.
- Market Concentration: The market is moderately concentrated, with key players holding significant market share. Wright Medical Group NV and Stryker Corporation are estimated to hold xx% and xx% market share respectively in 2025.
- Technological Innovation: Advancements in biomaterials, minimally invasive surgical techniques, and implant designs drive market growth. The adoption of 3D-printed implants is increasing, contributing to improved patient outcomes.
- Regulatory Landscape: Stringent regulatory approvals for medical devices influence market dynamics. Compliance with standards like FDA regulations impacts product launches and market entry.
- Competitive Landscape: The market is competitive, with established players and emerging companies vying for market share. Competitive strategies include product differentiation, technological advancements, and strategic partnerships. The total number of M&A deals in the past five years is estimated at xx.
- End-User Demographics: The aging population and increasing incidence of osteoarthritis and rheumatoid arthritis fuel market growth. A rising demand for improved hand function and quality of life drives the adoption of metacarpal joint implants.
- M&A Activity: The last 5 years have seen xx major mergers and acquisitions within the industry, primarily focused on expanding product portfolios and geographic reach.
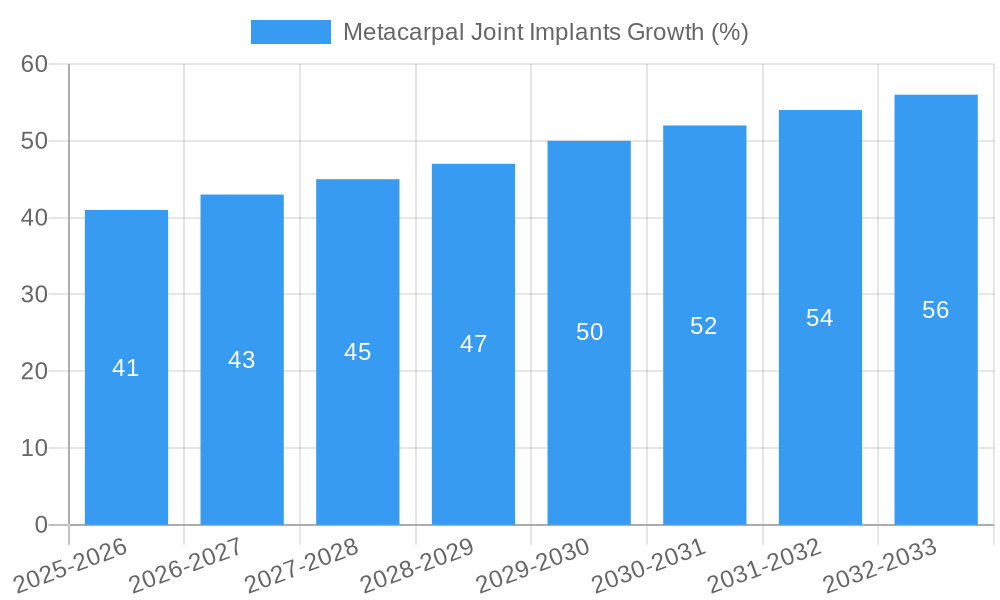
Metacarpal Joint Implants Growth Trends & Insights
This section analyzes historical and projected growth trends, focusing on adoption rates, technological disruptions, and consumer behavior shifts, using data from various market research reports. The report leverages proprietary data and industry analysis to provide comprehensive insights.
The market witnessed significant growth during the historical period (2019-2024), driven primarily by an aging population and increasing prevalence of hand-related conditions. The adoption rate of metacarpal joint implants has steadily increased, with a noticeable surge in recent years owing to technological advancements in implant design and surgical techniques. Technological disruptions, particularly the introduction of minimally invasive surgical techniques, have led to improved patient outcomes and reduced recovery times, boosting market adoption. Consumer behavior is shifting towards preference for personalized treatment plans and minimally invasive procedures resulting in a higher acceptance rate of implants.
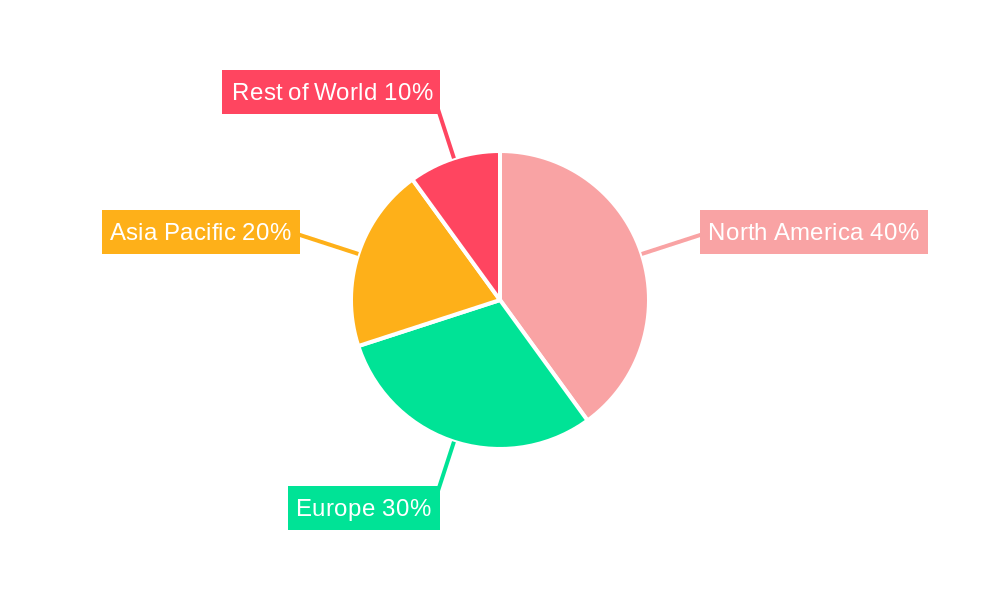
Dominant Regions, Countries, or Segments in Metacarpal Joint Implants
North America currently dominates the global metacarpal joint implants market, driven by factors such as advanced healthcare infrastructure, high disposable incomes, and a large aging population.
- Key Drivers in North America:
- Advanced healthcare infrastructure and high adoption rates of advanced surgical techniques.
- High prevalence of osteoarthritis and rheumatoid arthritis.
- Favorable reimbursement policies for orthopedic procedures.
- Other Regions: Europe and Asia-Pacific are expected to witness significant growth during the forecast period due to rising healthcare expenditure and increasing awareness about hand surgeries. However, limited healthcare infrastructure and lower disposable incomes in certain regions may hinder growth.
- Market Share & Growth Potential: North America holds an estimated xx% market share in 2025. Asia-Pacific is expected to exhibit the highest growth rate during the forecast period.
Metacarpal Joint Implants Product Landscape
The metacarpal joint implants market offers a range of products, including resurfacing implants, total joint replacements, and custom-designed implants. These implants vary in materials (e.g., metal alloys, polymers), design features, and functionalities. Recent innovations focus on enhancing implant durability, biocompatibility, and osseointegration. Unique selling propositions often center on minimally invasive surgical approaches and improved patient recovery times.
Key Drivers, Barriers & Challenges in Metacarpal Joint Implants
Key Drivers:
- Increasing prevalence of arthritis and other hand conditions.
- Technological advancements in implant designs and surgical techniques.
- Rising healthcare expenditure and improved insurance coverage.
Key Barriers & Challenges:
- High cost of implants and procedures.
- Potential complications associated with surgery.
- Stringent regulatory requirements for medical devices.
- Competition from alternative treatment options.
Emerging Opportunities in Metacarpal Joint Implants
Emerging opportunities include the development of biocompatible and biodegradable implants, personalized implant designs using 3D printing, and minimally invasive surgical techniques. Expansion into untapped markets in developing economies also presents significant potential. Further, growing awareness about the benefits of metacarpal joint implants and increasing access to better healthcare are also driving opportunities.
Growth Accelerators in the Metacarpal Joint Implants Industry
Long-term growth will be propelled by continuous technological advancements, the development of innovative implant designs, and expansion into new markets. Strategic partnerships between medical device companies and healthcare providers will also play a crucial role in accelerating market growth.
Key Players Shaping the Metacarpal Joint Implants Market
- Wright Medical Group NV
- Integra LifeSciences Corporation
- Alchem Diagnostics
- Stryker Corporation
- TEIJIN NAKASHIMA MEDICAL CO.,LTD
- Johnson & Johnson Medical Limited
- VILEX,LLC
- Merete GmbH
Notable Milestones in Metacarpal Joint Implants Sector
- 2020: Stryker Corporation launches a new line of minimally invasive metacarpal joint implants.
- 2022: Wright Medical Group NV announces a strategic partnership with a leading orthopedic hospital for clinical trials of a novel implant design.
- 2023: Integra LifeSciences Corporation receives FDA approval for a new biocompatible material used in metacarpal joint implants. (Further milestones can be added based on available information)
In-Depth Metacarpal Joint Implants Market Outlook
The future of the metacarpal joint implants market is promising, driven by continuous innovation, increasing demand, and expanding market penetration. Strategic investments in research and development, along with the development of personalized medicine solutions, will shape the future trajectory of this market. The market is poised for strong growth due to the factors described throughout this report, offering substantial opportunities for both established players and new entrants.
Metacarpal Joint Implants Segmentation
-
1. Application
- 1.1. Hospital
- 1.2. Specialty Clinic
- 1.3. Other
-
2. Types
- 2.1. Metallic
- 2.2. Ceramic
- 2.3. Polymeric
Metacarpal Joint Implants Segmentation By Geography
-
1. North America
- 1.1. United States
- 1.2. Canada
- 1.3. Mexico
-
2. South America
- 2.1. Brazil
- 2.2. Argentina
- 2.3. Rest of South America
-
3. Europe
- 3.1. United Kingdom
- 3.2. Germany
- 3.3. France
- 3.4. Italy
- 3.5. Spain
- 3.6. Russia
- 3.7. Benelux
- 3.8. Nordics
- 3.9. Rest of Europe
-
4. Middle East & Africa
- 4.1. Turkey
- 4.2. Israel
- 4.3. GCC
- 4.4. North Africa
- 4.5. South Africa
- 4.6. Rest of Middle East & Africa
-
5. Asia Pacific
- 5.1. China
- 5.2. India
- 5.3. Japan
- 5.4. South Korea
- 5.5. ASEAN
- 5.6. Oceania
- 5.7. Rest of Asia Pacific
Metacarpal Joint Implants REPORT HIGHLIGHTS
| Aspects | Details |
|---|---|
| Study Period | 2019-2033 |
| Base Year | 2024 |
| Estimated Year | 2025 |
| Forecast Period | 2025-2033 |
| Historical Period | 2019-2024 |
| Growth Rate | CAGR of XX% from 2019-2033 |
| Segmentation |
|
Table of Contents
- 1. Introduction
- 1.1. Research Scope
- 1.2. Market Segmentation
- 1.3. Research Methodology
- 1.4. Definitions and Assumptions
- 2. Executive Summary
- 2.1. Introduction
- 3. Market Dynamics
- 3.1. Introduction
- 3.2. Market Drivers
- 3.3. Market Restrains
- 3.4. Market Trends
- 4. Market Factor Analysis
- 4.1. Porters Five Forces
- 4.2. Supply/Value Chain
- 4.3. PESTEL analysis
- 4.4. Market Entropy
- 4.5. Patent/Trademark Analysis
- 5. Global Metacarpal Joint Implants Analysis, Insights and Forecast, 2019-2031
- 5.1. Market Analysis, Insights and Forecast - by Application
- 5.1.1. Hospital
- 5.1.2. Specialty Clinic
- 5.1.3. Other
- 5.2. Market Analysis, Insights and Forecast - by Types
- 5.2.1. Metallic
- 5.2.2. Ceramic
- 5.2.3. Polymeric
- 5.3. Market Analysis, Insights and Forecast - by Region
- 5.3.1. North America
- 5.3.2. South America
- 5.3.3. Europe
- 5.3.4. Middle East & Africa
- 5.3.5. Asia Pacific
- 5.1. Market Analysis, Insights and Forecast - by Application
- 6. North America Metacarpal Joint Implants Analysis, Insights and Forecast, 2019-2031
- 6.1. Market Analysis, Insights and Forecast - by Application
- 6.1.1. Hospital
- 6.1.2. Specialty Clinic
- 6.1.3. Other
- 6.2. Market Analysis, Insights and Forecast - by Types
- 6.2.1. Metallic
- 6.2.2. Ceramic
- 6.2.3. Polymeric
- 6.1. Market Analysis, Insights and Forecast - by Application
- 7. South America Metacarpal Joint Implants Analysis, Insights and Forecast, 2019-2031
- 7.1. Market Analysis, Insights and Forecast - by Application
- 7.1.1. Hospital
- 7.1.2. Specialty Clinic
- 7.1.3. Other
- 7.2. Market Analysis, Insights and Forecast - by Types
- 7.2.1. Metallic
- 7.2.2. Ceramic
- 7.2.3. Polymeric
- 7.1. Market Analysis, Insights and Forecast - by Application
- 8. Europe Metacarpal Joint Implants Analysis, Insights and Forecast, 2019-2031
- 8.1. Market Analysis, Insights and Forecast - by Application
- 8.1.1. Hospital
- 8.1.2. Specialty Clinic
- 8.1.3. Other
- 8.2. Market Analysis, Insights and Forecast - by Types
- 8.2.1. Metallic
- 8.2.2. Ceramic
- 8.2.3. Polymeric
- 8.1. Market Analysis, Insights and Forecast - by Application
- 9. Middle East & Africa Metacarpal Joint Implants Analysis, Insights and Forecast, 2019-2031
- 9.1. Market Analysis, Insights and Forecast - by Application
- 9.1.1. Hospital
- 9.1.2. Specialty Clinic
- 9.1.3. Other
- 9.2. Market Analysis, Insights and Forecast - by Types
- 9.2.1. Metallic
- 9.2.2. Ceramic
- 9.2.3. Polymeric
- 9.1. Market Analysis, Insights and Forecast - by Application
- 10. Asia Pacific Metacarpal Joint Implants Analysis, Insights and Forecast, 2019-2031
- 10.1. Market Analysis, Insights and Forecast - by Application
- 10.1.1. Hospital
- 10.1.2. Specialty Clinic
- 10.1.3. Other
- 10.2. Market Analysis, Insights and Forecast - by Types
- 10.2.1. Metallic
- 10.2.2. Ceramic
- 10.2.3. Polymeric
- 10.1. Market Analysis, Insights and Forecast - by Application
- 11. Competitive Analysis
- 11.1. Global Market Share Analysis 2024
- 11.2. Company Profiles
- 11.2.1 Wright Medical Group NV
- 11.2.1.1. Overview
- 11.2.1.2. Products
- 11.2.1.3. SWOT Analysis
- 11.2.1.4. Recent Developments
- 11.2.1.5. Financials (Based on Availability)
- 11.2.2 Integra LifeSciences Corporation
- 11.2.2.1. Overview
- 11.2.2.2. Products
- 11.2.2.3. SWOT Analysis
- 11.2.2.4. Recent Developments
- 11.2.2.5. Financials (Based on Availability)
- 11.2.3 Alchem Diagnostics
- 11.2.3.1. Overview
- 11.2.3.2. Products
- 11.2.3.3. SWOT Analysis
- 11.2.3.4. Recent Developments
- 11.2.3.5. Financials (Based on Availability)
- 11.2.4 Stryker Corporation
- 11.2.4.1. Overview
- 11.2.4.2. Products
- 11.2.4.3. SWOT Analysis
- 11.2.4.4. Recent Developments
- 11.2.4.5. Financials (Based on Availability)
- 11.2.5 TEIJIN NAKASHIMA MEDICAL CO.
- 11.2.5.1. Overview
- 11.2.5.2. Products
- 11.2.5.3. SWOT Analysis
- 11.2.5.4. Recent Developments
- 11.2.5.5. Financials (Based on Availability)
- 11.2.6 LTD
- 11.2.6.1. Overview
- 11.2.6.2. Products
- 11.2.6.3. SWOT Analysis
- 11.2.6.4. Recent Developments
- 11.2.6.5. Financials (Based on Availability)
- 11.2.7 Johnson & Johnson Medical Limited
- 11.2.7.1. Overview
- 11.2.7.2. Products
- 11.2.7.3. SWOT Analysis
- 11.2.7.4. Recent Developments
- 11.2.7.5. Financials (Based on Availability)
- 11.2.8 VILEX
- 11.2.8.1. Overview
- 11.2.8.2. Products
- 11.2.8.3. SWOT Analysis
- 11.2.8.4. Recent Developments
- 11.2.8.5. Financials (Based on Availability)
- 11.2.9 LLC
- 11.2.9.1. Overview
- 11.2.9.2. Products
- 11.2.9.3. SWOT Analysis
- 11.2.9.4. Recent Developments
- 11.2.9.5. Financials (Based on Availability)
- 11.2.10 Merete GmbH
- 11.2.10.1. Overview
- 11.2.10.2. Products
- 11.2.10.3. SWOT Analysis
- 11.2.10.4. Recent Developments
- 11.2.10.5. Financials (Based on Availability)
- 11.2.1 Wright Medical Group NV
List of Figures
- Figure 1: Global Metacarpal Joint Implants Revenue Breakdown (million, %) by Region 2024 & 2032
- Figure 2: Global Metacarpal Joint Implants Volume Breakdown (K, %) by Region 2024 & 2032
- Figure 3: North America Metacarpal Joint Implants Revenue (million), by Application 2024 & 2032
- Figure 4: North America Metacarpal Joint Implants Volume (K), by Application 2024 & 2032
- Figure 5: North America Metacarpal Joint Implants Revenue Share (%), by Application 2024 & 2032
- Figure 6: North America Metacarpal Joint Implants Volume Share (%), by Application 2024 & 2032
- Figure 7: North America Metacarpal Joint Implants Revenue (million), by Types 2024 & 2032
- Figure 8: North America Metacarpal Joint Implants Volume (K), by Types 2024 & 2032
- Figure 9: North America Metacarpal Joint Implants Revenue Share (%), by Types 2024 & 2032
- Figure 10: North America Metacarpal Joint Implants Volume Share (%), by Types 2024 & 2032
- Figure 11: North America Metacarpal Joint Implants Revenue (million), by Country 2024 & 2032
- Figure 12: North America Metacarpal Joint Implants Volume (K), by Country 2024 & 2032
- Figure 13: North America Metacarpal Joint Implants Revenue Share (%), by Country 2024 & 2032
- Figure 14: North America Metacarpal Joint Implants Volume Share (%), by Country 2024 & 2032
- Figure 15: South America Metacarpal Joint Implants Revenue (million), by Application 2024 & 2032
- Figure 16: South America Metacarpal Joint Implants Volume (K), by Application 2024 & 2032
- Figure 17: South America Metacarpal Joint Implants Revenue Share (%), by Application 2024 & 2032
- Figure 18: South America Metacarpal Joint Implants Volume Share (%), by Application 2024 & 2032
- Figure 19: South America Metacarpal Joint Implants Revenue (million), by Types 2024 & 2032
- Figure 20: South America Metacarpal Joint Implants Volume (K), by Types 2024 & 2032
- Figure 21: South America Metacarpal Joint Implants Revenue Share (%), by Types 2024 & 2032
- Figure 22: South America Metacarpal Joint Implants Volume Share (%), by Types 2024 & 2032
- Figure 23: South America Metacarpal Joint Implants Revenue (million), by Country 2024 & 2032
- Figure 24: South America Metacarpal Joint Implants Volume (K), by Country 2024 & 2032
- Figure 25: South America Metacarpal Joint Implants Revenue Share (%), by Country 2024 & 2032
- Figure 26: South America Metacarpal Joint Implants Volume Share (%), by Country 2024 & 2032
- Figure 27: Europe Metacarpal Joint Implants Revenue (million), by Application 2024 & 2032
- Figure 28: Europe Metacarpal Joint Implants Volume (K), by Application 2024 & 2032
- Figure 29: Europe Metacarpal Joint Implants Revenue Share (%), by Application 2024 & 2032
- Figure 30: Europe Metacarpal Joint Implants Volume Share (%), by Application 2024 & 2032
- Figure 31: Europe Metacarpal Joint Implants Revenue (million), by Types 2024 & 2032
- Figure 32: Europe Metacarpal Joint Implants Volume (K), by Types 2024 & 2032
- Figure 33: Europe Metacarpal Joint Implants Revenue Share (%), by Types 2024 & 2032
- Figure 34: Europe Metacarpal Joint Implants Volume Share (%), by Types 2024 & 2032
- Figure 35: Europe Metacarpal Joint Implants Revenue (million), by Country 2024 & 2032
- Figure 36: Europe Metacarpal Joint Implants Volume (K), by Country 2024 & 2032
- Figure 37: Europe Metacarpal Joint Implants Revenue Share (%), by Country 2024 & 2032
- Figure 38: Europe Metacarpal Joint Implants Volume Share (%), by Country 2024 & 2032
- Figure 39: Middle East & Africa Metacarpal Joint Implants Revenue (million), by Application 2024 & 2032
- Figure 40: Middle East & Africa Metacarpal Joint Implants Volume (K), by Application 2024 & 2032
- Figure 41: Middle East & Africa Metacarpal Joint Implants Revenue Share (%), by Application 2024 & 2032
- Figure 42: Middle East & Africa Metacarpal Joint Implants Volume Share (%), by Application 2024 & 2032
- Figure 43: Middle East & Africa Metacarpal Joint Implants Revenue (million), by Types 2024 & 2032
- Figure 44: Middle East & Africa Metacarpal Joint Implants Volume (K), by Types 2024 & 2032
- Figure 45: Middle East & Africa Metacarpal Joint Implants Revenue Share (%), by Types 2024 & 2032
- Figure 46: Middle East & Africa Metacarpal Joint Implants Volume Share (%), by Types 2024 & 2032
- Figure 47: Middle East & Africa Metacarpal Joint Implants Revenue (million), by Country 2024 & 2032
- Figure 48: Middle East & Africa Metacarpal Joint Implants Volume (K), by Country 2024 & 2032
- Figure 49: Middle East & Africa Metacarpal Joint Implants Revenue Share (%), by Country 2024 & 2032
- Figure 50: Middle East & Africa Metacarpal Joint Implants Volume Share (%), by Country 2024 & 2032
- Figure 51: Asia Pacific Metacarpal Joint Implants Revenue (million), by Application 2024 & 2032
- Figure 52: Asia Pacific Metacarpal Joint Implants Volume (K), by Application 2024 & 2032
- Figure 53: Asia Pacific Metacarpal Joint Implants Revenue Share (%), by Application 2024 & 2032
- Figure 54: Asia Pacific Metacarpal Joint Implants Volume Share (%), by Application 2024 & 2032
- Figure 55: Asia Pacific Metacarpal Joint Implants Revenue (million), by Types 2024 & 2032
- Figure 56: Asia Pacific Metacarpal Joint Implants Volume (K), by Types 2024 & 2032
- Figure 57: Asia Pacific Metacarpal Joint Implants Revenue Share (%), by Types 2024 & 2032
- Figure 58: Asia Pacific Metacarpal Joint Implants Volume Share (%), by Types 2024 & 2032
- Figure 59: Asia Pacific Metacarpal Joint Implants Revenue (million), by Country 2024 & 2032
- Figure 60: Asia Pacific Metacarpal Joint Implants Volume (K), by Country 2024 & 2032
- Figure 61: Asia Pacific Metacarpal Joint Implants Revenue Share (%), by Country 2024 & 2032
- Figure 62: Asia Pacific Metacarpal Joint Implants Volume Share (%), by Country 2024 & 2032
List of Tables
- Table 1: Global Metacarpal Joint Implants Revenue million Forecast, by Region 2019 & 2032
- Table 2: Global Metacarpal Joint Implants Volume K Forecast, by Region 2019 & 2032
- Table 3: Global Metacarpal Joint Implants Revenue million Forecast, by Application 2019 & 2032
- Table 4: Global Metacarpal Joint Implants Volume K Forecast, by Application 2019 & 2032
- Table 5: Global Metacarpal Joint Implants Revenue million Forecast, by Types 2019 & 2032
- Table 6: Global Metacarpal Joint Implants Volume K Forecast, by Types 2019 & 2032
- Table 7: Global Metacarpal Joint Implants Revenue million Forecast, by Region 2019 & 2032
- Table 8: Global Metacarpal Joint Implants Volume K Forecast, by Region 2019 & 2032
- Table 9: Global Metacarpal Joint Implants Revenue million Forecast, by Application 2019 & 2032
- Table 10: Global Metacarpal Joint Implants Volume K Forecast, by Application 2019 & 2032
- Table 11: Global Metacarpal Joint Implants Revenue million Forecast, by Types 2019 & 2032
- Table 12: Global Metacarpal Joint Implants Volume K Forecast, by Types 2019 & 2032
- Table 13: Global Metacarpal Joint Implants Revenue million Forecast, by Country 2019 & 2032
- Table 14: Global Metacarpal Joint Implants Volume K Forecast, by Country 2019 & 2032
- Table 15: United States Metacarpal Joint Implants Revenue (million) Forecast, by Application 2019 & 2032
- Table 16: United States Metacarpal Joint Implants Volume (K) Forecast, by Application 2019 & 2032
- Table 17: Canada Metacarpal Joint Implants Revenue (million) Forecast, by Application 2019 & 2032
- Table 18: Canada Metacarpal Joint Implants Volume (K) Forecast, by Application 2019 & 2032
- Table 19: Mexico Metacarpal Joint Implants Revenue (million) Forecast, by Application 2019 & 2032
- Table 20: Mexico Metacarpal Joint Implants Volume (K) Forecast, by Application 2019 & 2032
- Table 21: Global Metacarpal Joint Implants Revenue million Forecast, by Application 2019 & 2032
- Table 22: Global Metacarpal Joint Implants Volume K Forecast, by Application 2019 & 2032
- Table 23: Global Metacarpal Joint Implants Revenue million Forecast, by Types 2019 & 2032
- Table 24: Global Metacarpal Joint Implants Volume K Forecast, by Types 2019 & 2032
- Table 25: Global Metacarpal Joint Implants Revenue million Forecast, by Country 2019 & 2032
- Table 26: Global Metacarpal Joint Implants Volume K Forecast, by Country 2019 & 2032
- Table 27: Brazil Metacarpal Joint Implants Revenue (million) Forecast, by Application 2019 & 2032
- Table 28: Brazil Metacarpal Joint Implants Volume (K) Forecast, by Application 2019 & 2032
- Table 29: Argentina Metacarpal Joint Implants Revenue (million) Forecast, by Application 2019 & 2032
- Table 30: Argentina Metacarpal Joint Implants Volume (K) Forecast, by Application 2019 & 2032
- Table 31: Rest of South America Metacarpal Joint Implants Revenue (million) Forecast, by Application 2019 & 2032
- Table 32: Rest of South America Metacarpal Joint Implants Volume (K) Forecast, by Application 2019 & 2032
- Table 33: Global Metacarpal Joint Implants Revenue million Forecast, by Application 2019 & 2032
- Table 34: Global Metacarpal Joint Implants Volume K Forecast, by Application 2019 & 2032
- Table 35: Global Metacarpal Joint Implants Revenue million Forecast, by Types 2019 & 2032
- Table 36: Global Metacarpal Joint Implants Volume K Forecast, by Types 2019 & 2032
- Table 37: Global Metacarpal Joint Implants Revenue million Forecast, by Country 2019 & 2032
- Table 38: Global Metacarpal Joint Implants Volume K Forecast, by Country 2019 & 2032
- Table 39: United Kingdom Metacarpal Joint Implants Revenue (million) Forecast, by Application 2019 & 2032
- Table 40: United Kingdom Metacarpal Joint Implants Volume (K) Forecast, by Application 2019 & 2032
- Table 41: Germany Metacarpal Joint Implants Revenue (million) Forecast, by Application 2019 & 2032
- Table 42: Germany Metacarpal Joint Implants Volume (K) Forecast, by Application 2019 & 2032
- Table 43: France Metacarpal Joint Implants Revenue (million) Forecast, by Application 2019 & 2032
- Table 44: France Metacarpal Joint Implants Volume (K) Forecast, by Application 2019 & 2032
- Table 45: Italy Metacarpal Joint Implants Revenue (million) Forecast, by Application 2019 & 2032
- Table 46: Italy Metacarpal Joint Implants Volume (K) Forecast, by Application 2019 & 2032
- Table 47: Spain Metacarpal Joint Implants Revenue (million) Forecast, by Application 2019 & 2032
- Table 48: Spain Metacarpal Joint Implants Volume (K) Forecast, by Application 2019 & 2032
- Table 49: Russia Metacarpal Joint Implants Revenue (million) Forecast, by Application 2019 & 2032
- Table 50: Russia Metacarpal Joint Implants Volume (K) Forecast, by Application 2019 & 2032
- Table 51: Benelux Metacarpal Joint Implants Revenue (million) Forecast, by Application 2019 & 2032
- Table 52: Benelux Metacarpal Joint Implants Volume (K) Forecast, by Application 2019 & 2032
- Table 53: Nordics Metacarpal Joint Implants Revenue (million) Forecast, by Application 2019 & 2032
- Table 54: Nordics Metacarpal Joint Implants Volume (K) Forecast, by Application 2019 & 2032
- Table 55: Rest of Europe Metacarpal Joint Implants Revenue (million) Forecast, by Application 2019 & 2032
- Table 56: Rest of Europe Metacarpal Joint Implants Volume (K) Forecast, by Application 2019 & 2032
- Table 57: Global Metacarpal Joint Implants Revenue million Forecast, by Application 2019 & 2032
- Table 58: Global Metacarpal Joint Implants Volume K Forecast, by Application 2019 & 2032
- Table 59: Global Metacarpal Joint Implants Revenue million Forecast, by Types 2019 & 2032
- Table 60: Global Metacarpal Joint Implants Volume K Forecast, by Types 2019 & 2032
- Table 61: Global Metacarpal Joint Implants Revenue million Forecast, by Country 2019 & 2032
- Table 62: Global Metacarpal Joint Implants Volume K Forecast, by Country 2019 & 2032
- Table 63: Turkey Metacarpal Joint Implants Revenue (million) Forecast, by Application 2019 & 2032
- Table 64: Turkey Metacarpal Joint Implants Volume (K) Forecast, by Application 2019 & 2032
- Table 65: Israel Metacarpal Joint Implants Revenue (million) Forecast, by Application 2019 & 2032
- Table 66: Israel Metacarpal Joint Implants Volume (K) Forecast, by Application 2019 & 2032
- Table 67: GCC Metacarpal Joint Implants Revenue (million) Forecast, by Application 2019 & 2032
- Table 68: GCC Metacarpal Joint Implants Volume (K) Forecast, by Application 2019 & 2032
- Table 69: North Africa Metacarpal Joint Implants Revenue (million) Forecast, by Application 2019 & 2032
- Table 70: North Africa Metacarpal Joint Implants Volume (K) Forecast, by Application 2019 & 2032
- Table 71: South Africa Metacarpal Joint Implants Revenue (million) Forecast, by Application 2019 & 2032
- Table 72: South Africa Metacarpal Joint Implants Volume (K) Forecast, by Application 2019 & 2032
- Table 73: Rest of Middle East & Africa Metacarpal Joint Implants Revenue (million) Forecast, by Application 2019 & 2032
- Table 74: Rest of Middle East & Africa Metacarpal Joint Implants Volume (K) Forecast, by Application 2019 & 2032
- Table 75: Global Metacarpal Joint Implants Revenue million Forecast, by Application 2019 & 2032
- Table 76: Global Metacarpal Joint Implants Volume K Forecast, by Application 2019 & 2032
- Table 77: Global Metacarpal Joint Implants Revenue million Forecast, by Types 2019 & 2032
- Table 78: Global Metacarpal Joint Implants Volume K Forecast, by Types 2019 & 2032
- Table 79: Global Metacarpal Joint Implants Revenue million Forecast, by Country 2019 & 2032
- Table 80: Global Metacarpal Joint Implants Volume K Forecast, by Country 2019 & 2032
- Table 81: China Metacarpal Joint Implants Revenue (million) Forecast, by Application 2019 & 2032
- Table 82: China Metacarpal Joint Implants Volume (K) Forecast, by Application 2019 & 2032
- Table 83: India Metacarpal Joint Implants Revenue (million) Forecast, by Application 2019 & 2032
- Table 84: India Metacarpal Joint Implants Volume (K) Forecast, by Application 2019 & 2032
- Table 85: Japan Metacarpal Joint Implants Revenue (million) Forecast, by Application 2019 & 2032
- Table 86: Japan Metacarpal Joint Implants Volume (K) Forecast, by Application 2019 & 2032
- Table 87: South Korea Metacarpal Joint Implants Revenue (million) Forecast, by Application 2019 & 2032
- Table 88: South Korea Metacarpal Joint Implants Volume (K) Forecast, by Application 2019 & 2032
- Table 89: ASEAN Metacarpal Joint Implants Revenue (million) Forecast, by Application 2019 & 2032
- Table 90: ASEAN Metacarpal Joint Implants Volume (K) Forecast, by Application 2019 & 2032
- Table 91: Oceania Metacarpal Joint Implants Revenue (million) Forecast, by Application 2019 & 2032
- Table 92: Oceania Metacarpal Joint Implants Volume (K) Forecast, by Application 2019 & 2032
- Table 93: Rest of Asia Pacific Metacarpal Joint Implants Revenue (million) Forecast, by Application 2019 & 2032
- Table 94: Rest of Asia Pacific Metacarpal Joint Implants Volume (K) Forecast, by Application 2019 & 2032
Frequently Asked Questions
1. What is the projected Compound Annual Growth Rate (CAGR) of the Metacarpal Joint Implants?
The projected CAGR is approximately XX%.
2. Which companies are prominent players in the Metacarpal Joint Implants?
Key companies in the market include Wright Medical Group NV, Integra LifeSciences Corporation, Alchem Diagnostics, Stryker Corporation, TEIJIN NAKASHIMA MEDICAL CO., LTD, Johnson & Johnson Medical Limited, VILEX, LLC, Merete GmbH.
3. What are the main segments of the Metacarpal Joint Implants?
The market segments include Application, Types.
4. Can you provide details about the market size?
The market size is estimated to be USD XXX million as of 2022.
5. What are some drivers contributing to market growth?
N/A
6. What are the notable trends driving market growth?
N/A
7. Are there any restraints impacting market growth?
N/A
8. Can you provide examples of recent developments in the market?
N/A
9. What pricing options are available for accessing the report?
Pricing options include single-user, multi-user, and enterprise licenses priced at USD 3950.00, USD 5925.00, and USD 7900.00 respectively.
10. Is the market size provided in terms of value or volume?
The market size is provided in terms of value, measured in million and volume, measured in K.
11. Are there any specific market keywords associated with the report?
Yes, the market keyword associated with the report is "Metacarpal Joint Implants," which aids in identifying and referencing the specific market segment covered.
12. How do I determine which pricing option suits my needs best?
The pricing options vary based on user requirements and access needs. Individual users may opt for single-user licenses, while businesses requiring broader access may choose multi-user or enterprise licenses for cost-effective access to the report.
13. Are there any additional resources or data provided in the Metacarpal Joint Implants report?
While the report offers comprehensive insights, it's advisable to review the specific contents or supplementary materials provided to ascertain if additional resources or data are available.
14. How can I stay updated on further developments or reports in the Metacarpal Joint Implants?
To stay informed about further developments, trends, and reports in the Metacarpal Joint Implants, consider subscribing to industry newsletters, following relevant companies and organizations, or regularly checking reputable industry news sources and publications.
Methodology
Step 1 - Identification of Relevant Samples Size from Population Database


Step 2 - Approaches for Defining Global Market Size (Value, Volume* & Price*)

Note*: In applicable scenarios
Step 3 - Data Sources
Primary Research
- Web Analytics
- Survey Reports
- Research Institute
- Latest Research Reports
- Opinion Leaders
Secondary Research
- Annual Reports
- White Paper
- Latest Press Release
- Industry Association
- Paid Database
- Investor Presentations

Step 4 - Data Triangulation
Involves using different sources of information in order to increase the validity of a study
These sources are likely to be stakeholders in a program - participants, other researchers, program staff, other community members, and so on.
Then we put all data in single framework & apply various statistical tools to find out the dynamic on the market.
During the analysis stage, feedback from the stakeholder groups would be compared to determine areas of agreement as well as areas of divergence
