

Key Insights
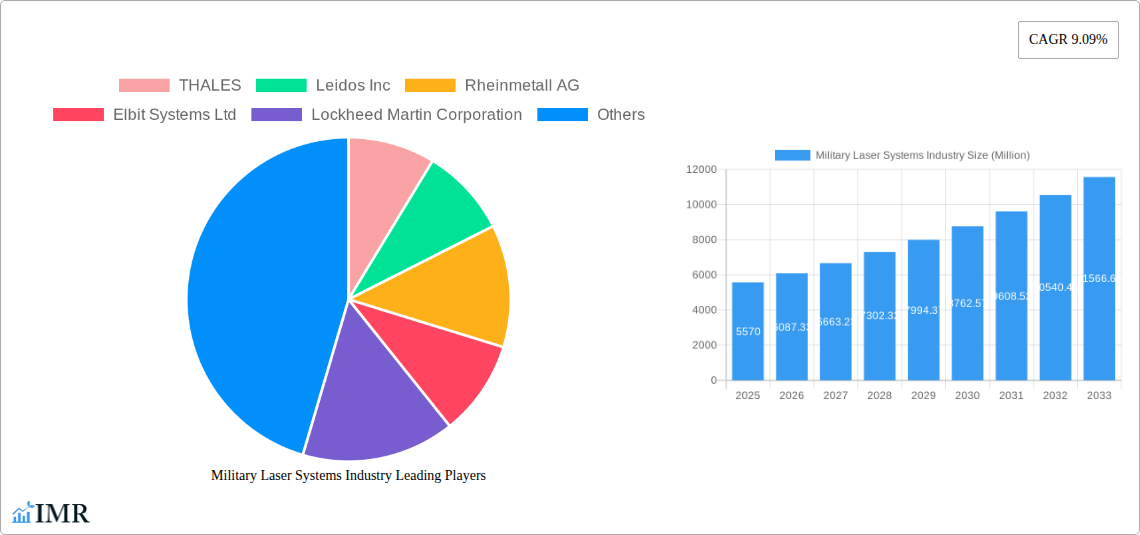
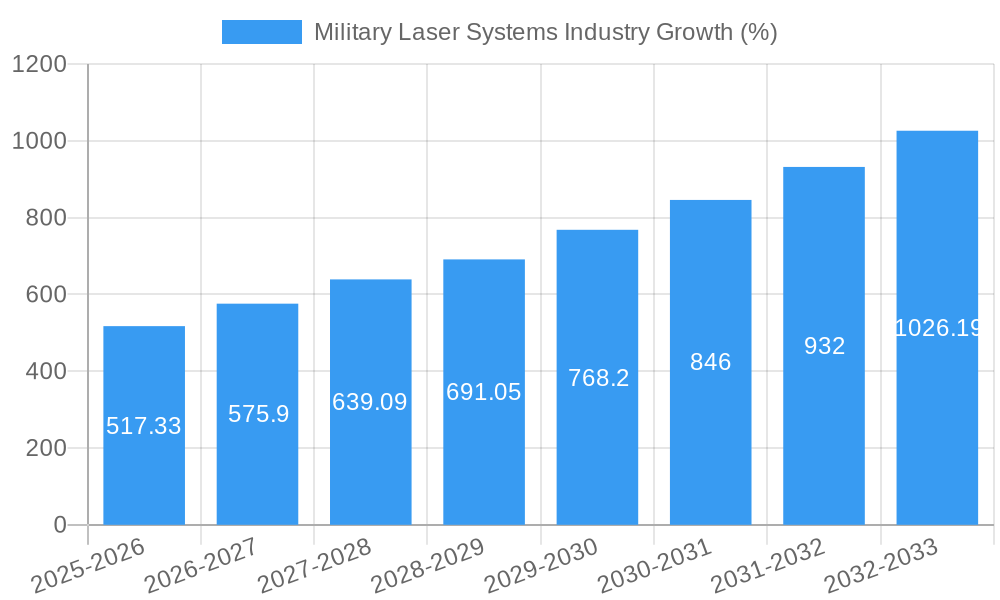
The Military Laser Systems market, valued at $5.57 billion in 2025, is projected to experience robust growth, driven by a compound annual growth rate (CAGR) of 9.09% from 2025 to 2033. This expansion is fueled by several key factors. Firstly, the increasing demand for precise and long-range targeting solutions across various military applications, including directed energy weapons (DEWs), significantly boosts market growth. Advancements in solid-state laser technology, offering enhanced efficiency and power output compared to gas lasers, are driving adoption across different military platforms. Furthermore, the integration of laser systems into sophisticated guidance systems and laser sights/designators/rangefinders enhances accuracy and effectiveness in modern warfare, stimulating market demand. Government investments in research and development of advanced laser technologies, coupled with rising geopolitical tensions and the ongoing need for technological superiority, further fuel market expansion.
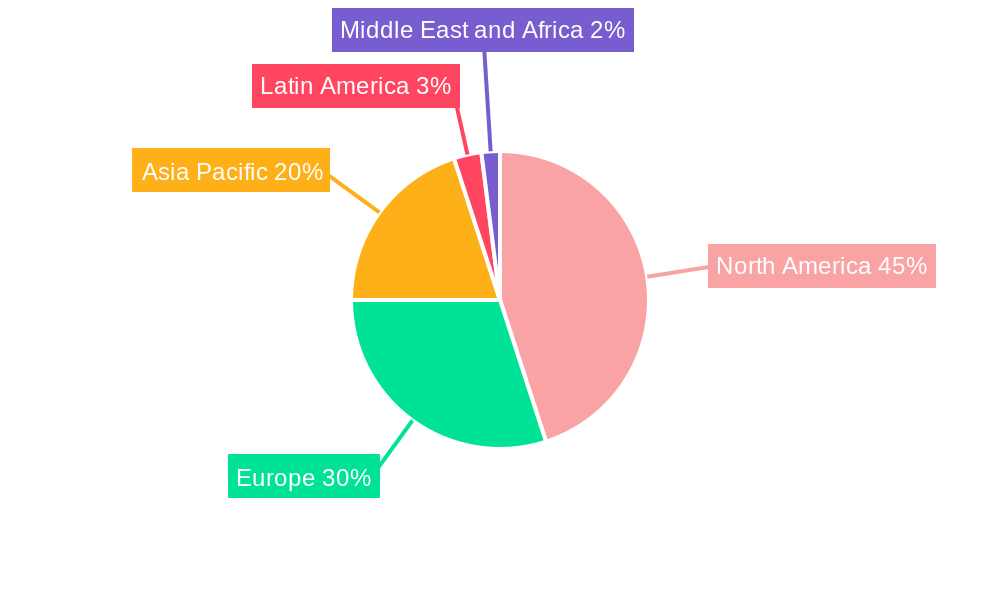
The market segmentation reveals a significant contribution from North America, driven by strong defense budgets and technological advancements within the region. Europe and the Asia-Pacific region also show substantial growth potential, owing to increased defense spending and modernization efforts in several countries. Competitive landscape analysis reveals prominent players like Thales, Lockheed Martin, and Rheinmetall, constantly innovating and investing in next-generation laser technologies. However, challenges such as the high cost of advanced laser systems and potential regulatory hurdles associated with the development and deployment of DEWs could act as restraints on market growth in the foreseeable future. Despite these restraints, the ongoing trend toward increased defense spending globally, coupled with technological progress, paints a promising picture for continued expansion in the military laser systems market throughout the forecast period.
This comprehensive report provides a detailed analysis of the Military Laser Systems industry, encompassing market dynamics, growth trends, regional landscapes, product innovations, and key players. With a focus on the parent market of defense technology and the child market of military laser systems, this report offers invaluable insights for industry professionals, investors, and strategic decision-makers. The study period covers 2019-2033, with 2025 as the base and estimated year. The forecast period spans 2025-2033, and the historical period encompasses 2019-2024. The market size is presented in million units.
Military Laser Systems Industry Market Dynamics & Structure
The military laser systems market is characterized by a moderately concentrated landscape with key players holding significant market share. Technological innovation, particularly in solid-state lasers and directed energy weapons, is a primary driver. Stringent regulatory frameworks and export controls influence market access. Competitive product substitutes, such as conventional weaponry, pose challenges, while the increasing demand for precision-guided munitions and advanced defense systems fuels growth. End-users primarily comprise military branches (Army, Navy, Air Force) and defense contractors globally. M&A activity remains moderate, with an estimated xx deals annually in the historical period, leading to consolidation and enhanced market share for larger players.
- Market Concentration: Moderately concentrated, with top 5 players holding approximately xx% market share in 2025.
- Technological Innovation: Rapid advancements in solid-state lasers, increasing power and efficiency.
- Regulatory Frameworks: Stringent export controls and safety regulations impacting market expansion.
- Competitive Substitutes: Conventional weapons systems pose a competitive threat.
- M&A Activity: Average of xx M&A deals per year (2019-2024).
Military Laser Systems Industry Growth Trends & Insights
The military laser systems market witnessed robust growth during the historical period (2019-2024), with a CAGR of xx%. This growth is attributed to increasing defense budgets globally, rising demand for advanced weaponry, and technological advancements. Market penetration of laser-based systems in various applications (e.g., directed energy weapons, guidance systems) is steadily increasing. Technological disruptions, particularly the development of high-power fiber lasers, are reshaping the market. Consumer behavior shifts, marked by a preference for precise and less collateral-damage-causing weapons systems, are further driving market expansion. The forecast period (2025-2033) projects a CAGR of xx%, reaching an estimated market size of xx million units by 2033. The market value is expected to reach xx Million USD by 2033.
Dominant Regions, Countries, or Segments in Military Laser Systems Industry
North America currently dominates the military laser systems market, driven by significant defense spending, technological advancements, and a strong presence of major players like Lockheed Martin and RTX Corporation. The US military’s focus on directed energy weapons is a key factor. Europe follows, with significant contributions from countries like the UK, France, and Germany, fuelled by robust defense budgets and technological expertise. Within segments, directed energy weapons and solid-state lasers are the fastest-growing applications and technologies respectively.
- North America: High defense budgets, technological leadership, and strong industry presence.
- Europe: Significant defense spending, technological expertise, and collaborative projects.
- Asia-Pacific: Growing defense budgets and increasing adoption of advanced technologies.
- Dominant Technology Segment: Solid-state lasers (xx% market share in 2025), driven by efficiency and scalability.
- Dominant Application Segment: Directed Energy Weapons (xx% market share in 2025), fuelled by strategic military focus.
Military Laser Systems Industry Product Landscape
The market offers a diverse range of laser systems, including solid-state, gas, and fiber lasers, each designed for specific applications. Product innovations focus on enhancing power output, precision, range, and thermal management. Directed energy weapons are witnessing significant advancements, with a shift towards compact, deployable systems. Unique selling propositions include enhanced accuracy, reduced collateral damage, and cost-effectiveness compared to conventional weaponry. Technological advancements in beam control and power scaling are key differentiators.
Key Drivers, Barriers & Challenges in Military Laser Systems Industry
Key Drivers:
- Increasing defense budgets globally.
- Growing demand for precision-guided munitions and advanced weaponry.
- Technological advancements in laser technology, increasing power and efficiency.
- Focus on directed energy weapons.
Key Barriers and Challenges:
- High initial investment costs for laser systems.
- Technological limitations in power scaling and atmospheric effects.
- Supply chain disruptions impacting component availability.
- Stringent regulatory hurdles and export controls.
- Intense competition among established players.
Emerging Opportunities in Military Laser Systems Industry
Emerging opportunities include the development of more compact, lightweight laser weapon systems for deployment on various platforms, including unmanned aerial vehicles (UAVs). Expansion into new applications like counter-drone systems and laser-based countermeasures presents significant potential. Further exploration into the use of high-energy lasers in space-based weapons systems is also a notable future development. Advances in artificial intelligence (AI) integration for autonomous targeting and control will provide further opportunities.
Growth Accelerators in the Military Laser Systems Industry Industry
Technological breakthroughs in laser power scaling, beam control, and thermal management are critical growth catalysts. Strategic partnerships between defense contractors and technology firms accelerate innovation and market penetration. Expanding collaborations between government agencies and research institutions support the development of next-generation laser systems. Increasing global defense spending across multiple countries provides a strong market pull for the adoption of these technologies.
Key Players Shaping the Military Laser Systems Market
- THALES
- Leidos Inc
- Rheinmetall AG
- Elbit Systems Ltd
- Lockheed Martin Corporation
- MBDA
- IAI
- Rafael Advanced Defense Systems Ltd
- RTX Corporation
- BAE Systems plc
- Northrop Grumman Corporation
- The Boeing Company
Notable Milestones in Military Laser Systems Industry Sector
- June 2023: RTX Corporation delivers the fourth combat-ready 10 KW laser weapon to the US Air Force.
- April 2023: US DoD selects NUBURU Inc. for a contract supporting solid-state high-energy laser weapon systems.
- March 2023: Blighter Surveillance Systems awarded a contract for radars in a UK MoD laser weapon project.
In-Depth Military Laser Systems Industry Market Outlook
The future of the military laser systems market is bright, driven by continuous technological advancements, increasing defense budgets, and a growing demand for precise, effective weapons systems. Strategic investments in R&D, coupled with strong government support, will fuel innovation. The market's expansion into new applications, including counter-drone technologies and space-based systems, will create lucrative opportunities for industry players. The market is poised for significant growth, with substantial potential for both established and emerging players to capitalize on emerging technologies and global market demands.
Military Laser Systems Industry Segmentation
-
1. Technology
- 1.1. Solid-state Lasers
- 1.2. Gas Lasers
- 1.3. Other Technologies
-
2. Application
- 2.1. Directed Energy Weapons
- 2.2. Guidance Systems
- 2.3. Laser Sights, Designators, and Rangefinders
- 2.4. Other Applications
Military Laser Systems Industry Segmentation By Geography
-
1. North America
- 1.1. United States
- 1.2. Canada
-
2. Europe
- 2.1. United Kingdom
- 2.2. Germany
- 2.3. France
- 2.4. Italy
- 2.5. Russia
- 2.6. Rest of Europe
-
3. Asia Pacific
- 3.1. China
- 3.2. India
- 3.3. Japan
- 3.4. South Korea
- 3.5. Rest of Asia Pacific
-
4. Latin America
- 4.1. Brazil
- 4.2. Rest of Latin America
-
5. Middle East and Africa
- 5.1. United Arab Emirates
- 5.2. Saudi Arabia
- 5.3. Israel
- 5.4. Rest of Middle East and Africa
Military Laser Systems Industry REPORT HIGHLIGHTS
| Aspects | Details |
|---|---|
| Study Period | 2019-2033 |
| Base Year | 2024 |
| Estimated Year | 2025 |
| Forecast Period | 2025-2033 |
| Historical Period | 2019-2024 |
| Growth Rate | CAGR of 9.09% from 2019-2033 |
| Segmentation |
|
Table of Contents
- 1. Introduction
- 1.1. Research Scope
- 1.2. Market Segmentation
- 1.3. Research Methodology
- 1.4. Definitions and Assumptions
- 2. Executive Summary
- 2.1. Introduction
- 3. Market Dynamics
- 3.1. Introduction
- 3.2. Market Drivers
- 3.2.1. Increase in Internet of Things (IoT) and Autonomous Systems; Rise in Demand for Military and Defense Satellite Communication Solutions
- 3.3. Market Restrains
- 3.3.1. Cybersecurity Threats to Satellite Communication; Interference in Transmission of Data
- 3.4. Market Trends
- 3.4.1. Directed Energy Weapons Segment Projected to Exhibit the Highest CAGR During the Forecast Period
- 4. Market Factor Analysis
- 4.1. Porters Five Forces
- 4.2. Supply/Value Chain
- 4.3. PESTEL analysis
- 4.4. Market Entropy
- 4.5. Patent/Trademark Analysis
- 5. Global Military Laser Systems Industry Analysis, Insights and Forecast, 2019-2031
- 5.1. Market Analysis, Insights and Forecast - by Technology
- 5.1.1. Solid-state Lasers
- 5.1.2. Gas Lasers
- 5.1.3. Other Technologies
- 5.2. Market Analysis, Insights and Forecast - by Application
- 5.2.1. Directed Energy Weapons
- 5.2.2. Guidance Systems
- 5.2.3. Laser Sights, Designators, and Rangefinders
- 5.2.4. Other Applications
- 5.3. Market Analysis, Insights and Forecast - by Region
- 5.3.1. North America
- 5.3.2. Europe
- 5.3.3. Asia Pacific
- 5.3.4. Latin America
- 5.3.5. Middle East and Africa
- 5.1. Market Analysis, Insights and Forecast - by Technology
- 6. North America Military Laser Systems Industry Analysis, Insights and Forecast, 2019-2031
- 6.1. Market Analysis, Insights and Forecast - by Technology
- 6.1.1. Solid-state Lasers
- 6.1.2. Gas Lasers
- 6.1.3. Other Technologies
- 6.2. Market Analysis, Insights and Forecast - by Application
- 6.2.1. Directed Energy Weapons
- 6.2.2. Guidance Systems
- 6.2.3. Laser Sights, Designators, and Rangefinders
- 6.2.4. Other Applications
- 6.1. Market Analysis, Insights and Forecast - by Technology
- 7. Europe Military Laser Systems Industry Analysis, Insights and Forecast, 2019-2031
- 7.1. Market Analysis, Insights and Forecast - by Technology
- 7.1.1. Solid-state Lasers
- 7.1.2. Gas Lasers
- 7.1.3. Other Technologies
- 7.2. Market Analysis, Insights and Forecast - by Application
- 7.2.1. Directed Energy Weapons
- 7.2.2. Guidance Systems
- 7.2.3. Laser Sights, Designators, and Rangefinders
- 7.2.4. Other Applications
- 7.1. Market Analysis, Insights and Forecast - by Technology
- 8. Asia Pacific Military Laser Systems Industry Analysis, Insights and Forecast, 2019-2031
- 8.1. Market Analysis, Insights and Forecast - by Technology
- 8.1.1. Solid-state Lasers
- 8.1.2. Gas Lasers
- 8.1.3. Other Technologies
- 8.2. Market Analysis, Insights and Forecast - by Application
- 8.2.1. Directed Energy Weapons
- 8.2.2. Guidance Systems
- 8.2.3. Laser Sights, Designators, and Rangefinders
- 8.2.4. Other Applications
- 8.1. Market Analysis, Insights and Forecast - by Technology
- 9. Latin America Military Laser Systems Industry Analysis, Insights and Forecast, 2019-2031
- 9.1. Market Analysis, Insights and Forecast - by Technology
- 9.1.1. Solid-state Lasers
- 9.1.2. Gas Lasers
- 9.1.3. Other Technologies
- 9.2. Market Analysis, Insights and Forecast - by Application
- 9.2.1. Directed Energy Weapons
- 9.2.2. Guidance Systems
- 9.2.3. Laser Sights, Designators, and Rangefinders
- 9.2.4. Other Applications
- 9.1. Market Analysis, Insights and Forecast - by Technology
- 10. Middle East and Africa Military Laser Systems Industry Analysis, Insights and Forecast, 2019-2031
- 10.1. Market Analysis, Insights and Forecast - by Technology
- 10.1.1. Solid-state Lasers
- 10.1.2. Gas Lasers
- 10.1.3. Other Technologies
- 10.2. Market Analysis, Insights and Forecast - by Application
- 10.2.1. Directed Energy Weapons
- 10.2.2. Guidance Systems
- 10.2.3. Laser Sights, Designators, and Rangefinders
- 10.2.4. Other Applications
- 10.1. Market Analysis, Insights and Forecast - by Technology
- 11. North America Military Laser Systems Industry Analysis, Insights and Forecast, 2019-2031
- 11.1. Market Analysis, Insights and Forecast - By Country/Sub-region
- 11.1.1 United States
- 11.1.2 Canada
- 12. Europe Military Laser Systems Industry Analysis, Insights and Forecast, 2019-2031
- 12.1. Market Analysis, Insights and Forecast - By Country/Sub-region
- 12.1.1 United Kingdom
- 12.1.2 Germany
- 12.1.3 France
- 12.1.4 Italy
- 12.1.5 Russia
- 12.1.6 Rest of Europe
- 13. Asia Pacific Military Laser Systems Industry Analysis, Insights and Forecast, 2019-2031
- 13.1. Market Analysis, Insights and Forecast - By Country/Sub-region
- 13.1.1 China
- 13.1.2 India
- 13.1.3 Japan
- 13.1.4 South Korea
- 13.1.5 Rest of Asia Pacific
- 14. Latin America Military Laser Systems Industry Analysis, Insights and Forecast, 2019-2031
- 14.1. Market Analysis, Insights and Forecast - By Country/Sub-region
- 14.1.1 Brazil
- 14.1.2 Rest of Latin America
- 15. Middle East and Africa Military Laser Systems Industry Analysis, Insights and Forecast, 2019-2031
- 15.1. Market Analysis, Insights and Forecast - By Country/Sub-region
- 15.1.1 United Arab Emirates
- 15.1.2 Saudi Arabia
- 15.1.3 Israel
- 15.1.4 Rest of Middle East and Africa
- 16. Competitive Analysis
- 16.1. Global Market Share Analysis 2024
- 16.2. Company Profiles
- 16.2.1 THALES
- 16.2.1.1. Overview
- 16.2.1.2. Products
- 16.2.1.3. SWOT Analysis
- 16.2.1.4. Recent Developments
- 16.2.1.5. Financials (Based on Availability)
- 16.2.2 Leidos Inc
- 16.2.2.1. Overview
- 16.2.2.2. Products
- 16.2.2.3. SWOT Analysis
- 16.2.2.4. Recent Developments
- 16.2.2.5. Financials (Based on Availability)
- 16.2.3 Rheinmetall AG
- 16.2.3.1. Overview
- 16.2.3.2. Products
- 16.2.3.3. SWOT Analysis
- 16.2.3.4. Recent Developments
- 16.2.3.5. Financials (Based on Availability)
- 16.2.4 Elbit Systems Ltd
- 16.2.4.1. Overview
- 16.2.4.2. Products
- 16.2.4.3. SWOT Analysis
- 16.2.4.4. Recent Developments
- 16.2.4.5. Financials (Based on Availability)
- 16.2.5 Lockheed Martin Corporation
- 16.2.5.1. Overview
- 16.2.5.2. Products
- 16.2.5.3. SWOT Analysis
- 16.2.5.4. Recent Developments
- 16.2.5.5. Financials (Based on Availability)
- 16.2.6 MBDA
- 16.2.6.1. Overview
- 16.2.6.2. Products
- 16.2.6.3. SWOT Analysis
- 16.2.6.4. Recent Developments
- 16.2.6.5. Financials (Based on Availability)
- 16.2.7 IAI
- 16.2.7.1. Overview
- 16.2.7.2. Products
- 16.2.7.3. SWOT Analysis
- 16.2.7.4. Recent Developments
- 16.2.7.5. Financials (Based on Availability)
- 16.2.8 Rafael Advanced Defense Systems Ltd
- 16.2.8.1. Overview
- 16.2.8.2. Products
- 16.2.8.3. SWOT Analysis
- 16.2.8.4. Recent Developments
- 16.2.8.5. Financials (Based on Availability)
- 16.2.9 RTX Corporation
- 16.2.9.1. Overview
- 16.2.9.2. Products
- 16.2.9.3. SWOT Analysis
- 16.2.9.4. Recent Developments
- 16.2.9.5. Financials (Based on Availability)
- 16.2.10 BAE Systems plc
- 16.2.10.1. Overview
- 16.2.10.2. Products
- 16.2.10.3. SWOT Analysis
- 16.2.10.4. Recent Developments
- 16.2.10.5. Financials (Based on Availability)
- 16.2.11 Northrop Grumman Corporation
- 16.2.11.1. Overview
- 16.2.11.2. Products
- 16.2.11.3. SWOT Analysis
- 16.2.11.4. Recent Developments
- 16.2.11.5. Financials (Based on Availability)
- 16.2.12 The Boeing Company
- 16.2.12.1. Overview
- 16.2.12.2. Products
- 16.2.12.3. SWOT Analysis
- 16.2.12.4. Recent Developments
- 16.2.12.5. Financials (Based on Availability)
- 16.2.1 THALES
List of Figures
- Figure 1: Global Military Laser Systems Industry Revenue Breakdown (Million, %) by Region 2024 & 2032
- Figure 2: North America Military Laser Systems Industry Revenue (Million), by Country 2024 & 2032
- Figure 3: North America Military Laser Systems Industry Revenue Share (%), by Country 2024 & 2032
- Figure 4: Europe Military Laser Systems Industry Revenue (Million), by Country 2024 & 2032
- Figure 5: Europe Military Laser Systems Industry Revenue Share (%), by Country 2024 & 2032
- Figure 6: Asia Pacific Military Laser Systems Industry Revenue (Million), by Country 2024 & 2032
- Figure 7: Asia Pacific Military Laser Systems Industry Revenue Share (%), by Country 2024 & 2032
- Figure 8: Latin America Military Laser Systems Industry Revenue (Million), by Country 2024 & 2032
- Figure 9: Latin America Military Laser Systems Industry Revenue Share (%), by Country 2024 & 2032
- Figure 10: Middle East and Africa Military Laser Systems Industry Revenue (Million), by Country 2024 & 2032
- Figure 11: Middle East and Africa Military Laser Systems Industry Revenue Share (%), by Country 2024 & 2032
- Figure 12: North America Military Laser Systems Industry Revenue (Million), by Technology 2024 & 2032
- Figure 13: North America Military Laser Systems Industry Revenue Share (%), by Technology 2024 & 2032
- Figure 14: North America Military Laser Systems Industry Revenue (Million), by Application 2024 & 2032
- Figure 15: North America Military Laser Systems Industry Revenue Share (%), by Application 2024 & 2032
- Figure 16: North America Military Laser Systems Industry Revenue (Million), by Country 2024 & 2032
- Figure 17: North America Military Laser Systems Industry Revenue Share (%), by Country 2024 & 2032
- Figure 18: Europe Military Laser Systems Industry Revenue (Million), by Technology 2024 & 2032
- Figure 19: Europe Military Laser Systems Industry Revenue Share (%), by Technology 2024 & 2032
- Figure 20: Europe Military Laser Systems Industry Revenue (Million), by Application 2024 & 2032
- Figure 21: Europe Military Laser Systems Industry Revenue Share (%), by Application 2024 & 2032
- Figure 22: Europe Military Laser Systems Industry Revenue (Million), by Country 2024 & 2032
- Figure 23: Europe Military Laser Systems Industry Revenue Share (%), by Country 2024 & 2032
- Figure 24: Asia Pacific Military Laser Systems Industry Revenue (Million), by Technology 2024 & 2032
- Figure 25: Asia Pacific Military Laser Systems Industry Revenue Share (%), by Technology 2024 & 2032
- Figure 26: Asia Pacific Military Laser Systems Industry Revenue (Million), by Application 2024 & 2032
- Figure 27: Asia Pacific Military Laser Systems Industry Revenue Share (%), by Application 2024 & 2032
- Figure 28: Asia Pacific Military Laser Systems Industry Revenue (Million), by Country 2024 & 2032
- Figure 29: Asia Pacific Military Laser Systems Industry Revenue Share (%), by Country 2024 & 2032
- Figure 30: Latin America Military Laser Systems Industry Revenue (Million), by Technology 2024 & 2032
- Figure 31: Latin America Military Laser Systems Industry Revenue Share (%), by Technology 2024 & 2032
- Figure 32: Latin America Military Laser Systems Industry Revenue (Million), by Application 2024 & 2032
- Figure 33: Latin America Military Laser Systems Industry Revenue Share (%), by Application 2024 & 2032
- Figure 34: Latin America Military Laser Systems Industry Revenue (Million), by Country 2024 & 2032
- Figure 35: Latin America Military Laser Systems Industry Revenue Share (%), by Country 2024 & 2032
- Figure 36: Middle East and Africa Military Laser Systems Industry Revenue (Million), by Technology 2024 & 2032
- Figure 37: Middle East and Africa Military Laser Systems Industry Revenue Share (%), by Technology 2024 & 2032
- Figure 38: Middle East and Africa Military Laser Systems Industry Revenue (Million), by Application 2024 & 2032
- Figure 39: Middle East and Africa Military Laser Systems Industry Revenue Share (%), by Application 2024 & 2032
- Figure 40: Middle East and Africa Military Laser Systems Industry Revenue (Million), by Country 2024 & 2032
- Figure 41: Middle East and Africa Military Laser Systems Industry Revenue Share (%), by Country 2024 & 2032
List of Tables
- Table 1: Global Military Laser Systems Industry Revenue Million Forecast, by Region 2019 & 2032
- Table 2: Global Military Laser Systems Industry Revenue Million Forecast, by Technology 2019 & 2032
- Table 3: Global Military Laser Systems Industry Revenue Million Forecast, by Application 2019 & 2032
- Table 4: Global Military Laser Systems Industry Revenue Million Forecast, by Region 2019 & 2032
- Table 5: Global Military Laser Systems Industry Revenue Million Forecast, by Country 2019 & 2032
- Table 6: United States Military Laser Systems Industry Revenue (Million) Forecast, by Application 2019 & 2032
- Table 7: Canada Military Laser Systems Industry Revenue (Million) Forecast, by Application 2019 & 2032
- Table 8: Global Military Laser Systems Industry Revenue Million Forecast, by Country 2019 & 2032
- Table 9: United Kingdom Military Laser Systems Industry Revenue (Million) Forecast, by Application 2019 & 2032
- Table 10: Germany Military Laser Systems Industry Revenue (Million) Forecast, by Application 2019 & 2032
- Table 11: France Military Laser Systems Industry Revenue (Million) Forecast, by Application 2019 & 2032
- Table 12: Italy Military Laser Systems Industry Revenue (Million) Forecast, by Application 2019 & 2032
- Table 13: Russia Military Laser Systems Industry Revenue (Million) Forecast, by Application 2019 & 2032
- Table 14: Rest of Europe Military Laser Systems Industry Revenue (Million) Forecast, by Application 2019 & 2032
- Table 15: Global Military Laser Systems Industry Revenue Million Forecast, by Country 2019 & 2032
- Table 16: China Military Laser Systems Industry Revenue (Million) Forecast, by Application 2019 & 2032
- Table 17: India Military Laser Systems Industry Revenue (Million) Forecast, by Application 2019 & 2032
- Table 18: Japan Military Laser Systems Industry Revenue (Million) Forecast, by Application 2019 & 2032
- Table 19: South Korea Military Laser Systems Industry Revenue (Million) Forecast, by Application 2019 & 2032
- Table 20: Rest of Asia Pacific Military Laser Systems Industry Revenue (Million) Forecast, by Application 2019 & 2032
- Table 21: Global Military Laser Systems Industry Revenue Million Forecast, by Country 2019 & 2032
- Table 22: Brazil Military Laser Systems Industry Revenue (Million) Forecast, by Application 2019 & 2032
- Table 23: Rest of Latin America Military Laser Systems Industry Revenue (Million) Forecast, by Application 2019 & 2032
- Table 24: Global Military Laser Systems Industry Revenue Million Forecast, by Country 2019 & 2032
- Table 25: United Arab Emirates Military Laser Systems Industry Revenue (Million) Forecast, by Application 2019 & 2032
- Table 26: Saudi Arabia Military Laser Systems Industry Revenue (Million) Forecast, by Application 2019 & 2032
- Table 27: Israel Military Laser Systems Industry Revenue (Million) Forecast, by Application 2019 & 2032
- Table 28: Rest of Middle East and Africa Military Laser Systems Industry Revenue (Million) Forecast, by Application 2019 & 2032
- Table 29: Global Military Laser Systems Industry Revenue Million Forecast, by Technology 2019 & 2032
- Table 30: Global Military Laser Systems Industry Revenue Million Forecast, by Application 2019 & 2032
- Table 31: Global Military Laser Systems Industry Revenue Million Forecast, by Country 2019 & 2032
- Table 32: United States Military Laser Systems Industry Revenue (Million) Forecast, by Application 2019 & 2032
- Table 33: Canada Military Laser Systems Industry Revenue (Million) Forecast, by Application 2019 & 2032
- Table 34: Global Military Laser Systems Industry Revenue Million Forecast, by Technology 2019 & 2032
- Table 35: Global Military Laser Systems Industry Revenue Million Forecast, by Application 2019 & 2032
- Table 36: Global Military Laser Systems Industry Revenue Million Forecast, by Country 2019 & 2032
- Table 37: United Kingdom Military Laser Systems Industry Revenue (Million) Forecast, by Application 2019 & 2032
- Table 38: Germany Military Laser Systems Industry Revenue (Million) Forecast, by Application 2019 & 2032
- Table 39: France Military Laser Systems Industry Revenue (Million) Forecast, by Application 2019 & 2032
- Table 40: Italy Military Laser Systems Industry Revenue (Million) Forecast, by Application 2019 & 2032
- Table 41: Russia Military Laser Systems Industry Revenue (Million) Forecast, by Application 2019 & 2032
- Table 42: Rest of Europe Military Laser Systems Industry Revenue (Million) Forecast, by Application 2019 & 2032
- Table 43: Global Military Laser Systems Industry Revenue Million Forecast, by Technology 2019 & 2032
- Table 44: Global Military Laser Systems Industry Revenue Million Forecast, by Application 2019 & 2032
- Table 45: Global Military Laser Systems Industry Revenue Million Forecast, by Country 2019 & 2032
- Table 46: China Military Laser Systems Industry Revenue (Million) Forecast, by Application 2019 & 2032
- Table 47: India Military Laser Systems Industry Revenue (Million) Forecast, by Application 2019 & 2032
- Table 48: Japan Military Laser Systems Industry Revenue (Million) Forecast, by Application 2019 & 2032
- Table 49: South Korea Military Laser Systems Industry Revenue (Million) Forecast, by Application 2019 & 2032
- Table 50: Rest of Asia Pacific Military Laser Systems Industry Revenue (Million) Forecast, by Application 2019 & 2032
- Table 51: Global Military Laser Systems Industry Revenue Million Forecast, by Technology 2019 & 2032
- Table 52: Global Military Laser Systems Industry Revenue Million Forecast, by Application 2019 & 2032
- Table 53: Global Military Laser Systems Industry Revenue Million Forecast, by Country 2019 & 2032
- Table 54: Brazil Military Laser Systems Industry Revenue (Million) Forecast, by Application 2019 & 2032
- Table 55: Rest of Latin America Military Laser Systems Industry Revenue (Million) Forecast, by Application 2019 & 2032
- Table 56: Global Military Laser Systems Industry Revenue Million Forecast, by Technology 2019 & 2032
- Table 57: Global Military Laser Systems Industry Revenue Million Forecast, by Application 2019 & 2032
- Table 58: Global Military Laser Systems Industry Revenue Million Forecast, by Country 2019 & 2032
- Table 59: United Arab Emirates Military Laser Systems Industry Revenue (Million) Forecast, by Application 2019 & 2032
- Table 60: Saudi Arabia Military Laser Systems Industry Revenue (Million) Forecast, by Application 2019 & 2032
- Table 61: Israel Military Laser Systems Industry Revenue (Million) Forecast, by Application 2019 & 2032
- Table 62: Rest of Middle East and Africa Military Laser Systems Industry Revenue (Million) Forecast, by Application 2019 & 2032
Frequently Asked Questions
1. What is the projected Compound Annual Growth Rate (CAGR) of the Military Laser Systems Industry?
The projected CAGR is approximately 9.09%.
2. Which companies are prominent players in the Military Laser Systems Industry?
Key companies in the market include THALES, Leidos Inc, Rheinmetall AG, Elbit Systems Ltd, Lockheed Martin Corporation, MBDA, IAI, Rafael Advanced Defense Systems Ltd, RTX Corporation, BAE Systems plc, Northrop Grumman Corporation, The Boeing Company.
3. What are the main segments of the Military Laser Systems Industry?
The market segments include Technology, Application.
4. Can you provide details about the market size?
The market size is estimated to be USD 5.57 Million as of 2022.
5. What are some drivers contributing to market growth?
Increase in Internet of Things (IoT) and Autonomous Systems; Rise in Demand for Military and Defense Satellite Communication Solutions.
6. What are the notable trends driving market growth?
Directed Energy Weapons Segment Projected to Exhibit the Highest CAGR During the Forecast Period.
7. Are there any restraints impacting market growth?
Cybersecurity Threats to Satellite Communication; Interference in Transmission of Data.
8. Can you provide examples of recent developments in the market?
June 2023: RTX Corporation delivered the fourth combat-ready laser weapon to the US Air Force. The new palletized laser weapon was the first 10 KW laser built to US military specifications in a stand-alone configuration that can be moved and mounted anywhere it's needed.
9. What pricing options are available for accessing the report?
Pricing options include single-user, multi-user, and enterprise licenses priced at USD 4750, USD 5250, and USD 8750 respectively.
10. Is the market size provided in terms of value or volume?
The market size is provided in terms of value, measured in Million.
11. Are there any specific market keywords associated with the report?
Yes, the market keyword associated with the report is "Military Laser Systems Industry," which aids in identifying and referencing the specific market segment covered.
12. How do I determine which pricing option suits my needs best?
The pricing options vary based on user requirements and access needs. Individual users may opt for single-user licenses, while businesses requiring broader access may choose multi-user or enterprise licenses for cost-effective access to the report.
13. Are there any additional resources or data provided in the Military Laser Systems Industry report?
While the report offers comprehensive insights, it's advisable to review the specific contents or supplementary materials provided to ascertain if additional resources or data are available.
14. How can I stay updated on further developments or reports in the Military Laser Systems Industry?
To stay informed about further developments, trends, and reports in the Military Laser Systems Industry, consider subscribing to industry newsletters, following relevant companies and organizations, or regularly checking reputable industry news sources and publications.
Methodology
Step 1 - Identification of Relevant Samples Size from Population Database


Step 2 - Approaches for Defining Global Market Size (Value, Volume* & Price*)

Note*: In applicable scenarios
Step 3 - Data Sources
Primary Research
- Web Analytics
- Survey Reports
- Research Institute
- Latest Research Reports
- Opinion Leaders
Secondary Research
- Annual Reports
- White Paper
- Latest Press Release
- Industry Association
- Paid Database
- Investor Presentations

Step 4 - Data Triangulation
Involves using different sources of information in order to increase the validity of a study
These sources are likely to be stakeholders in a program - participants, other researchers, program staff, other community members, and so on.
Then we put all data in single framework & apply various statistical tools to find out the dynamic on the market.
During the analysis stage, feedback from the stakeholder groups would be compared to determine areas of agreement as well as areas of divergence
