

Key Insights
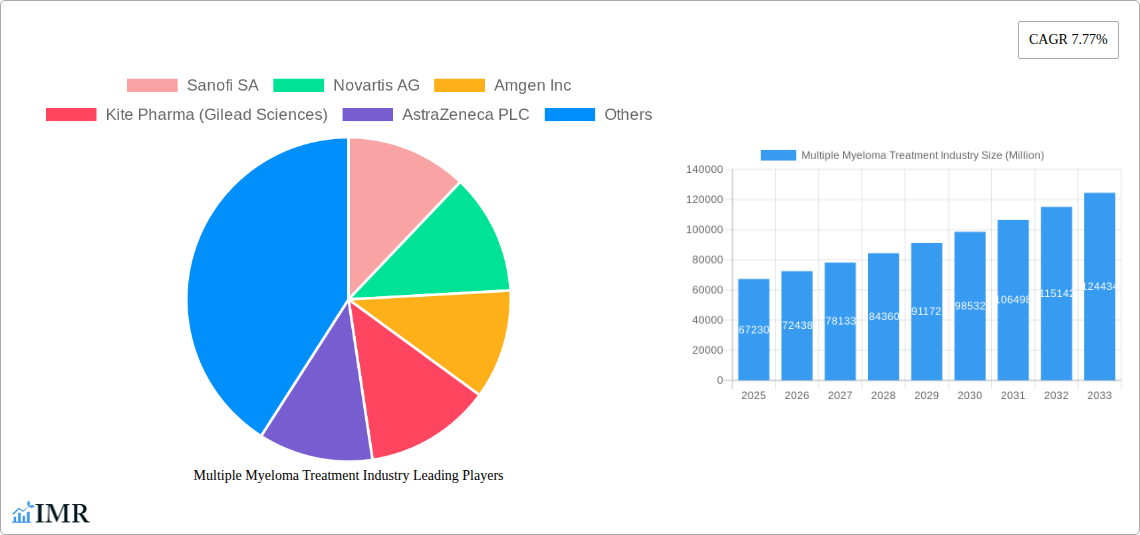
The multiple myeloma treatment market, valued at $67.23 billion in 2025, is projected to experience robust growth, driven by a rising prevalence of the disease globally, an aging population, and continuous advancements in treatment modalities. The market's Compound Annual Growth Rate (CAGR) of 7.77% from 2025 to 2033 indicates significant expansion potential. Key growth drivers include the increasing availability of novel therapies like CAR T-cell therapy and immunomodulatory drugs, offering improved efficacy and survival rates for patients. Furthermore, ongoing research and development efforts are leading to the introduction of more targeted and personalized treatments, catering to specific patient needs and genetic profiles. While the high cost of treatment remains a significant restraint, especially in developing economies, the expanding healthcare infrastructure and increased insurance coverage are gradually mitigating this challenge. The market is segmented by disease condition (multiple myeloma predominantly), therapy type (chemotherapy, immunotherapy, targeted therapy), and end-user (hospitals, medical stores, e-commerce platforms). North America currently holds a substantial market share due to advanced healthcare infrastructure and high drug adoption rates, though the Asia-Pacific region is projected to witness the fastest growth due to rising awareness and increasing disposable incomes. Major market players such as Sanofi, Novartis, Amgen, and others are actively investing in research and development, driving innovation and competition within the market.
The segmentation of the multiple myeloma treatment market reveals a dynamic landscape. Chemotherapy remains a significant component, but immunotherapy and targeted therapies are rapidly gaining traction due to their improved efficacy and reduced side effects. The rise of personalized medicine and biomarker-driven treatment selection further contributes to the market's growth, as treatments are becoming increasingly tailored to individual patient characteristics. The competitive landscape is intensely competitive, with numerous pharmaceutical companies engaged in a race to develop and market the most effective and safe treatment options. Strategic partnerships, mergers, and acquisitions are frequently observed as companies seek to expand their portfolios and gain a stronger foothold in this lucrative market. While the historical period (2019-2024) reflects a steady growth trajectory, the future (2025-2033) promises even more substantial expansion, fueled by the ongoing advancements in treatment and rising disease prevalence.
Multiple Myeloma Treatment Industry Market Report: 2019-2033
This comprehensive report provides a detailed analysis of the Multiple Myeloma Treatment industry, encompassing market dynamics, growth trends, competitive landscape, and future outlook. With a focus on the parent market (Oncology therapeutics) and child market (Multiple Myeloma Treatment), this report is an invaluable resource for industry professionals, investors, and researchers seeking a deep understanding of this rapidly evolving sector. The study period covers 2019-2033, with 2025 as the base and estimated year. The forecast period extends from 2025-2033, and the historical period encompasses 2019-2024. The total market size in 2025 is estimated at $XX Billion.
Multiple Myeloma Treatment Industry Market Dynamics & Structure
The Multiple Myeloma Treatment market is characterized by a moderately concentrated structure, with key players holding significant market share. Technological innovation, particularly in immunotherapy and targeted therapies, is a major driver of growth. Stringent regulatory frameworks, including FDA approvals, significantly impact market access and timelines. Competitive pressure arises from the availability of substitute therapies and the emergence of biosimilars. The end-user demographic is primarily comprised of hospitals and specialized oncology clinics. M&A activity is prevalent, reflecting industry consolidation and the pursuit of innovative treatment modalities.
- Market Concentration: Top 5 players account for approximately XX% of the market in 2025.
- Technological Innovation: Focus on CAR T-cell therapy, bispecific antibodies, and novel immunomodulatory drugs.
- Regulatory Landscape: Stringent approval processes influence market entry and pricing.
- Competitive Substitutes: Existing therapies and emerging treatments create competitive pressure.
- End-User Demographics: Hospitals and specialized clinics dominate, with a growing role for e-commerce in certain regions.
- M&A Activity: XX major deals observed between 2019-2024, with a predicted XX deals in the forecast period.
Multiple Myeloma Treatment Industry Growth Trends & Insights
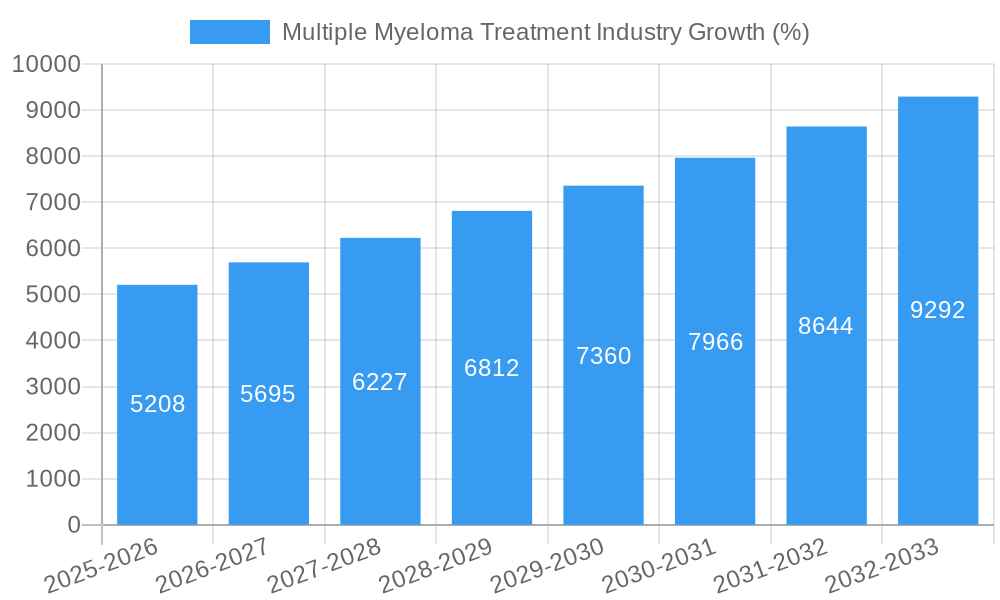
The Multiple Myeloma Treatment market exhibits robust growth, driven by increasing prevalence of multiple myeloma, advancements in treatment modalities, and rising healthcare expenditure. The market size is projected to expand at a CAGR of XX% during the forecast period (2025-2033), reaching an estimated $XX Billion by 2033. This growth is fueled by increased adoption of novel therapies, improving treatment outcomes, and expanding access to healthcare in emerging economies. Technological advancements, such as the development of next-generation immunotherapies and targeted therapies, are further accelerating market growth. Changes in consumer behavior, driven by increased awareness and patient advocacy, also contribute to market expansion.
Dominant Regions, Countries, or Segments in Multiple Myeloma Treatment Industry
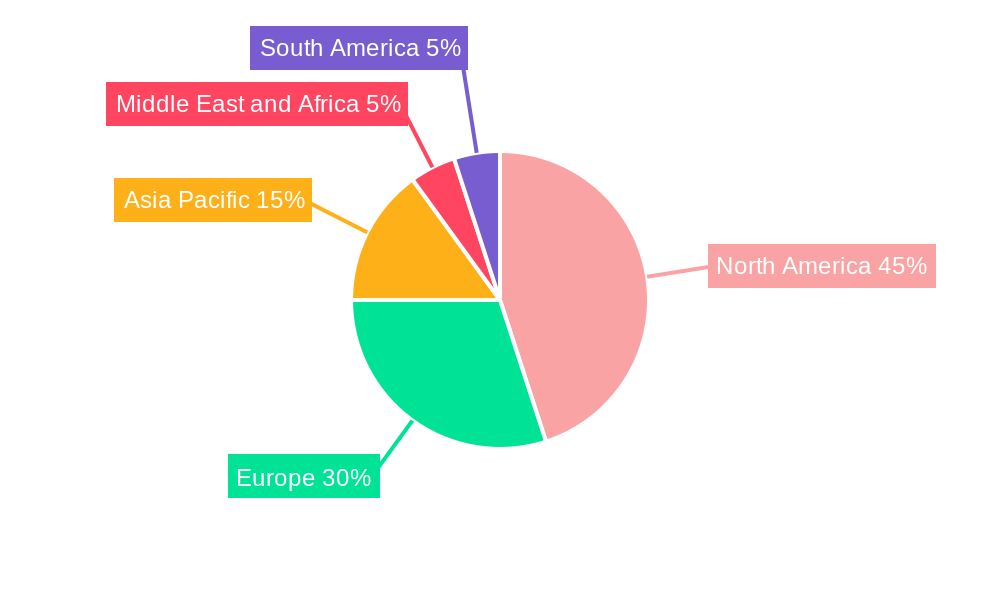
North America currently holds the largest market share due to high healthcare spending, robust research and development activities, and early adoption of advanced therapies. However, Asia-Pacific is projected to experience the fastest growth rate owing to increasing prevalence of multiple myeloma, expanding healthcare infrastructure, and rising disposable incomes.
- By Disease Condition: Myeloma segment dominates, followed by Lymphoma and Leukemia.
- By Therapy: Immunotherapy and Targeted Therapy are the fastest-growing segments, driven by superior efficacy.
- By End User: Hospital Pharmacies account for the largest share due to their role in administering complex treatments.
Key Drivers:
- High prevalence of multiple myeloma globally.
- Technological advancements in treatment modalities.
- Increasing healthcare expenditure.
- Favorable reimbursement policies in developed nations.
Multiple Myeloma Treatment Industry Product Landscape
The Multiple Myeloma Treatment market is characterized by a diverse range of therapies, including chemotherapy, immunotherapy (such as CAR T-cell therapy and checkpoint inhibitors), targeted therapy (e.g., proteasome inhibitors, immunomodulatory drugs), and other emerging modalities. Product innovation focuses on improving efficacy, reducing toxicity, and enhancing patient convenience. Unique selling propositions often center on improved response rates, extended progression-free survival, and manageable side effects. Technological advancements are driving the development of personalized medicine approaches, enabling more targeted and effective treatments.
Key Drivers, Barriers & Challenges in Multiple Myeloma Treatment Industry
Key Drivers:
- Rising prevalence of multiple myeloma.
- Increased investment in R&D.
- Growing awareness and patient advocacy.
Challenges:
- High cost of innovative therapies.
- Resistance to treatment.
- Limited access to advanced therapies in developing countries.
- Regulatory hurdles for new drug approvals.
Emerging Opportunities in Multiple Myeloma Treatment Industry
Emerging opportunities lie in personalized medicine approaches, combination therapies, and the development of novel treatment modalities for relapsed/refractory disease. Untapped markets in developing countries represent significant growth potential. The rising adoption of telemedicine and digital health tools offers opportunities to improve patient access and management.
Growth Accelerators in the Multiple Myeloma Treatment Industry
Long-term growth will be fueled by continuous innovation in treatment modalities, strategic collaborations between pharmaceutical companies and research institutions, and expansion into emerging markets. The increasing use of big data and AI in drug discovery and development will further accelerate market growth.
Key Players Shaping the Multiple Myeloma Treatment Market
- Sanofi SA
- Novartis AG
- Amgen Inc
- Kite Pharma (Gilead Sciences)
- AstraZeneca PLC
- F Hoffmann-LA Roche Ltd
- Atara Biotherapeutics
- AbbVie Inc
- Incyte Corporation
- Johnson & Johnson
- Bristol-Myers Squibb Company
- Celldex Therapeutics Inc
- GlaxoSmithKline PLC
- Takeda Pharmaceutical Co Ltd
- Pfizer Inc
Notable Milestones in Multiple Myeloma Treatment Industry Sector
- March 2021: Sanofi SA received US FDA approval for Sarclisa (isatuximab).
- February 2021: TG Therapeutics Inc. received US FDA accelerated approval for UKONIQ (umbralisib).
In-Depth Multiple Myeloma Treatment Industry Market Outlook
The Multiple Myeloma Treatment market is poised for continued expansion, driven by a robust pipeline of innovative therapies, increasing patient awareness, and expanding access to healthcare. Strategic partnerships, focused R&D efforts, and market expansion strategies will be crucial for sustained growth. The focus on personalized medicine and combination therapies will further enhance treatment outcomes and solidify the long-term potential of this dynamic market.
Multiple Myeloma Treatment Industry Segmentation
-
1. Disease Condition
- 1.1. Leukemia
- 1.2. Lymphoma
- 1.3. Myeloma
-
2. Therapy
- 2.1. Chemotherapy
- 2.2. Immunotherapy
- 2.3. Targeted Therapy
- 2.4. Other Therapies
-
3. End User
- 3.1. Hospital Pharmacies
- 3.2. Medical Stores
- 3.3. E-commerce Platforms
Multiple Myeloma Treatment Industry Segmentation By Geography
-
1. North America
- 1.1. United States
- 1.2. Canada
- 1.3. Mexico
-
2. Europe
- 2.1. Germany
- 2.2. United Kingdom
- 2.3. France
- 2.4. Italy
- 2.5. Spain
- 2.6. Rest of Europe
-
3. Asia Pacific
- 3.1. China
- 3.2. Japan
- 3.3. India
- 3.4. Australia
- 3.5. South Korea
- 3.6. Rest of Asia Pacific
-
4. Middle East and Africa
- 4.1. GCC
- 4.2. South Africa
- 4.3. Rest of Middle East and Africa
-
5. South America
- 5.1. Brazil
- 5.2. Argentina
- 5.3. Rest of South America
Multiple Myeloma Treatment Industry REPORT HIGHLIGHTS
| Aspects | Details |
|---|---|
| Study Period | 2019-2033 |
| Base Year | 2024 |
| Estimated Year | 2025 |
| Forecast Period | 2025-2033 |
| Historical Period | 2019-2024 |
| Growth Rate | CAGR of 7.77% from 2019-2033 |
| Segmentation |
|
Table of Contents
- 1. Introduction
- 1.1. Research Scope
- 1.2. Market Segmentation
- 1.3. Research Methodology
- 1.4. Definitions and Assumptions
- 2. Executive Summary
- 2.1. Introduction
- 3. Market Dynamics
- 3.1. Introduction
- 3.2. Market Drivers
- 3.2.1. Growing Incidence of Blood Cancer; Increasing Awareness about the Possibility of Early Diagnosis; Increasing Emphasis on Development of New Treatments
- 3.3. Market Restrains
- 3.3.1. High Cost of Medication
- 3.4. Market Trends
- 3.4.1 Chemotherapy Leads the Segment
- 3.4.2 and it is Expected to Witness a Healthy Growth Over the Forecast Period
- 4. Market Factor Analysis
- 4.1. Porters Five Forces
- 4.2. Supply/Value Chain
- 4.3. PESTEL analysis
- 4.4. Market Entropy
- 4.5. Patent/Trademark Analysis
- 5. Global Multiple Myeloma Treatment Industry Analysis, Insights and Forecast, 2019-2031
- 5.1. Market Analysis, Insights and Forecast - by Disease Condition
- 5.1.1. Leukemia
- 5.1.2. Lymphoma
- 5.1.3. Myeloma
- 5.2. Market Analysis, Insights and Forecast - by Therapy
- 5.2.1. Chemotherapy
- 5.2.2. Immunotherapy
- 5.2.3. Targeted Therapy
- 5.2.4. Other Therapies
- 5.3. Market Analysis, Insights and Forecast - by End User
- 5.3.1. Hospital Pharmacies
- 5.3.2. Medical Stores
- 5.3.3. E-commerce Platforms
- 5.4. Market Analysis, Insights and Forecast - by Region
- 5.4.1. North America
- 5.4.2. Europe
- 5.4.3. Asia Pacific
- 5.4.4. Middle East and Africa
- 5.4.5. South America
- 5.1. Market Analysis, Insights and Forecast - by Disease Condition
- 6. North America Multiple Myeloma Treatment Industry Analysis, Insights and Forecast, 2019-2031
- 6.1. Market Analysis, Insights and Forecast - by Disease Condition
- 6.1.1. Leukemia
- 6.1.2. Lymphoma
- 6.1.3. Myeloma
- 6.2. Market Analysis, Insights and Forecast - by Therapy
- 6.2.1. Chemotherapy
- 6.2.2. Immunotherapy
- 6.2.3. Targeted Therapy
- 6.2.4. Other Therapies
- 6.3. Market Analysis, Insights and Forecast - by End User
- 6.3.1. Hospital Pharmacies
- 6.3.2. Medical Stores
- 6.3.3. E-commerce Platforms
- 6.1. Market Analysis, Insights and Forecast - by Disease Condition
- 7. Europe Multiple Myeloma Treatment Industry Analysis, Insights and Forecast, 2019-2031
- 7.1. Market Analysis, Insights and Forecast - by Disease Condition
- 7.1.1. Leukemia
- 7.1.2. Lymphoma
- 7.1.3. Myeloma
- 7.2. Market Analysis, Insights and Forecast - by Therapy
- 7.2.1. Chemotherapy
- 7.2.2. Immunotherapy
- 7.2.3. Targeted Therapy
- 7.2.4. Other Therapies
- 7.3. Market Analysis, Insights and Forecast - by End User
- 7.3.1. Hospital Pharmacies
- 7.3.2. Medical Stores
- 7.3.3. E-commerce Platforms
- 7.1. Market Analysis, Insights and Forecast - by Disease Condition
- 8. Asia Pacific Multiple Myeloma Treatment Industry Analysis, Insights and Forecast, 2019-2031
- 8.1. Market Analysis, Insights and Forecast - by Disease Condition
- 8.1.1. Leukemia
- 8.1.2. Lymphoma
- 8.1.3. Myeloma
- 8.2. Market Analysis, Insights and Forecast - by Therapy
- 8.2.1. Chemotherapy
- 8.2.2. Immunotherapy
- 8.2.3. Targeted Therapy
- 8.2.4. Other Therapies
- 8.3. Market Analysis, Insights and Forecast - by End User
- 8.3.1. Hospital Pharmacies
- 8.3.2. Medical Stores
- 8.3.3. E-commerce Platforms
- 8.1. Market Analysis, Insights and Forecast - by Disease Condition
- 9. Middle East and Africa Multiple Myeloma Treatment Industry Analysis, Insights and Forecast, 2019-2031
- 9.1. Market Analysis, Insights and Forecast - by Disease Condition
- 9.1.1. Leukemia
- 9.1.2. Lymphoma
- 9.1.3. Myeloma
- 9.2. Market Analysis, Insights and Forecast - by Therapy
- 9.2.1. Chemotherapy
- 9.2.2. Immunotherapy
- 9.2.3. Targeted Therapy
- 9.2.4. Other Therapies
- 9.3. Market Analysis, Insights and Forecast - by End User
- 9.3.1. Hospital Pharmacies
- 9.3.2. Medical Stores
- 9.3.3. E-commerce Platforms
- 9.1. Market Analysis, Insights and Forecast - by Disease Condition
- 10. South America Multiple Myeloma Treatment Industry Analysis, Insights and Forecast, 2019-2031
- 10.1. Market Analysis, Insights and Forecast - by Disease Condition
- 10.1.1. Leukemia
- 10.1.2. Lymphoma
- 10.1.3. Myeloma
- 10.2. Market Analysis, Insights and Forecast - by Therapy
- 10.2.1. Chemotherapy
- 10.2.2. Immunotherapy
- 10.2.3. Targeted Therapy
- 10.2.4. Other Therapies
- 10.3. Market Analysis, Insights and Forecast - by End User
- 10.3.1. Hospital Pharmacies
- 10.3.2. Medical Stores
- 10.3.3. E-commerce Platforms
- 10.1. Market Analysis, Insights and Forecast - by Disease Condition
- 11. North America Multiple Myeloma Treatment Industry Analysis, Insights and Forecast, 2019-2031
- 11.1. Market Analysis, Insights and Forecast - By Country/Sub-region
- 11.1.1 United States
- 11.1.2 Canada
- 11.1.3 Mexico
- 12. Europe Multiple Myeloma Treatment Industry Analysis, Insights and Forecast, 2019-2031
- 12.1. Market Analysis, Insights and Forecast - By Country/Sub-region
- 12.1.1 Germany
- 12.1.2 United Kingdom
- 12.1.3 France
- 12.1.4 Italy
- 12.1.5 Spain
- 12.1.6 Rest of Europe
- 13. Asia Pacific Multiple Myeloma Treatment Industry Analysis, Insights and Forecast, 2019-2031
- 13.1. Market Analysis, Insights and Forecast - By Country/Sub-region
- 13.1.1 China
- 13.1.2 Japan
- 13.1.3 India
- 13.1.4 Australia
- 13.1.5 South Korea
- 13.1.6 Rest of Asia Pacific
- 14. Middle East and Africa Multiple Myeloma Treatment Industry Analysis, Insights and Forecast, 2019-2031
- 14.1. Market Analysis, Insights and Forecast - By Country/Sub-region
- 14.1.1 GCC
- 14.1.2 South Africa
- 14.1.3 Rest of Middle East and Africa
- 15. South America Multiple Myeloma Treatment Industry Analysis, Insights and Forecast, 2019-2031
- 15.1. Market Analysis, Insights and Forecast - By Country/Sub-region
- 15.1.1 Brazil
- 15.1.2 Argentina
- 15.1.3 Rest of South America
- 16. Competitive Analysis
- 16.1. Global Market Share Analysis 2024
- 16.2. Company Profiles
- 16.2.1 Sanofi SA
- 16.2.1.1. Overview
- 16.2.1.2. Products
- 16.2.1.3. SWOT Analysis
- 16.2.1.4. Recent Developments
- 16.2.1.5. Financials (Based on Availability)
- 16.2.2 Novartis AG
- 16.2.2.1. Overview
- 16.2.2.2. Products
- 16.2.2.3. SWOT Analysis
- 16.2.2.4. Recent Developments
- 16.2.2.5. Financials (Based on Availability)
- 16.2.3 Amgen Inc
- 16.2.3.1. Overview
- 16.2.3.2. Products
- 16.2.3.3. SWOT Analysis
- 16.2.3.4. Recent Developments
- 16.2.3.5. Financials (Based on Availability)
- 16.2.4 Kite Pharma (Gilead Sciences)
- 16.2.4.1. Overview
- 16.2.4.2. Products
- 16.2.4.3. SWOT Analysis
- 16.2.4.4. Recent Developments
- 16.2.4.5. Financials (Based on Availability)
- 16.2.5 AstraZeneca PLC
- 16.2.5.1. Overview
- 16.2.5.2. Products
- 16.2.5.3. SWOT Analysis
- 16.2.5.4. Recent Developments
- 16.2.5.5. Financials (Based on Availability)
- 16.2.6 F Hoffmann-LA Roche Ltd
- 16.2.6.1. Overview
- 16.2.6.2. Products
- 16.2.6.3. SWOT Analysis
- 16.2.6.4. Recent Developments
- 16.2.6.5. Financials (Based on Availability)
- 16.2.7 Atara Biotherapeutics
- 16.2.7.1. Overview
- 16.2.7.2. Products
- 16.2.7.3. SWOT Analysis
- 16.2.7.4. Recent Developments
- 16.2.7.5. Financials (Based on Availability)
- 16.2.8 AbbVie Inc
- 16.2.8.1. Overview
- 16.2.8.2. Products
- 16.2.8.3. SWOT Analysis
- 16.2.8.4. Recent Developments
- 16.2.8.5. Financials (Based on Availability)
- 16.2.9 Incyte Corporation
- 16.2.9.1. Overview
- 16.2.9.2. Products
- 16.2.9.3. SWOT Analysis
- 16.2.9.4. Recent Developments
- 16.2.9.5. Financials (Based on Availability)
- 16.2.10 Johnson & Johnson
- 16.2.10.1. Overview
- 16.2.10.2. Products
- 16.2.10.3. SWOT Analysis
- 16.2.10.4. Recent Developments
- 16.2.10.5. Financials (Based on Availability)
- 16.2.11 Bristol-Myers Squibb Company
- 16.2.11.1. Overview
- 16.2.11.2. Products
- 16.2.11.3. SWOT Analysis
- 16.2.11.4. Recent Developments
- 16.2.11.5. Financials (Based on Availability)
- 16.2.12 Celldex Therapeutics Inc
- 16.2.12.1. Overview
- 16.2.12.2. Products
- 16.2.12.3. SWOT Analysis
- 16.2.12.4. Recent Developments
- 16.2.12.5. Financials (Based on Availability)
- 16.2.13 GlaxoSmithKline PLC
- 16.2.13.1. Overview
- 16.2.13.2. Products
- 16.2.13.3. SWOT Analysis
- 16.2.13.4. Recent Developments
- 16.2.13.5. Financials (Based on Availability)
- 16.2.14 Takeda Pharmaceutical Co Ltd
- 16.2.14.1. Overview
- 16.2.14.2. Products
- 16.2.14.3. SWOT Analysis
- 16.2.14.4. Recent Developments
- 16.2.14.5. Financials (Based on Availability)
- 16.2.15 Pfizer Inc
- 16.2.15.1. Overview
- 16.2.15.2. Products
- 16.2.15.3. SWOT Analysis
- 16.2.15.4. Recent Developments
- 16.2.15.5. Financials (Based on Availability)
- 16.2.1 Sanofi SA
List of Figures
- Figure 1: Global Multiple Myeloma Treatment Industry Revenue Breakdown (Million, %) by Region 2024 & 2032
- Figure 2: Global Multiple Myeloma Treatment Industry Volume Breakdown (K Unit, %) by Region 2024 & 2032
- Figure 3: North America Multiple Myeloma Treatment Industry Revenue (Million), by Country 2024 & 2032
- Figure 4: North America Multiple Myeloma Treatment Industry Volume (K Unit), by Country 2024 & 2032
- Figure 5: North America Multiple Myeloma Treatment Industry Revenue Share (%), by Country 2024 & 2032
- Figure 6: North America Multiple Myeloma Treatment Industry Volume Share (%), by Country 2024 & 2032
- Figure 7: Europe Multiple Myeloma Treatment Industry Revenue (Million), by Country 2024 & 2032
- Figure 8: Europe Multiple Myeloma Treatment Industry Volume (K Unit), by Country 2024 & 2032
- Figure 9: Europe Multiple Myeloma Treatment Industry Revenue Share (%), by Country 2024 & 2032
- Figure 10: Europe Multiple Myeloma Treatment Industry Volume Share (%), by Country 2024 & 2032
- Figure 11: Asia Pacific Multiple Myeloma Treatment Industry Revenue (Million), by Country 2024 & 2032
- Figure 12: Asia Pacific Multiple Myeloma Treatment Industry Volume (K Unit), by Country 2024 & 2032
- Figure 13: Asia Pacific Multiple Myeloma Treatment Industry Revenue Share (%), by Country 2024 & 2032
- Figure 14: Asia Pacific Multiple Myeloma Treatment Industry Volume Share (%), by Country 2024 & 2032
- Figure 15: Middle East and Africa Multiple Myeloma Treatment Industry Revenue (Million), by Country 2024 & 2032
- Figure 16: Middle East and Africa Multiple Myeloma Treatment Industry Volume (K Unit), by Country 2024 & 2032
- Figure 17: Middle East and Africa Multiple Myeloma Treatment Industry Revenue Share (%), by Country 2024 & 2032
- Figure 18: Middle East and Africa Multiple Myeloma Treatment Industry Volume Share (%), by Country 2024 & 2032
- Figure 19: South America Multiple Myeloma Treatment Industry Revenue (Million), by Country 2024 & 2032
- Figure 20: South America Multiple Myeloma Treatment Industry Volume (K Unit), by Country 2024 & 2032
- Figure 21: South America Multiple Myeloma Treatment Industry Revenue Share (%), by Country 2024 & 2032
- Figure 22: South America Multiple Myeloma Treatment Industry Volume Share (%), by Country 2024 & 2032
- Figure 23: North America Multiple Myeloma Treatment Industry Revenue (Million), by Disease Condition 2024 & 2032
- Figure 24: North America Multiple Myeloma Treatment Industry Volume (K Unit), by Disease Condition 2024 & 2032
- Figure 25: North America Multiple Myeloma Treatment Industry Revenue Share (%), by Disease Condition 2024 & 2032
- Figure 26: North America Multiple Myeloma Treatment Industry Volume Share (%), by Disease Condition 2024 & 2032
- Figure 27: North America Multiple Myeloma Treatment Industry Revenue (Million), by Therapy 2024 & 2032
- Figure 28: North America Multiple Myeloma Treatment Industry Volume (K Unit), by Therapy 2024 & 2032
- Figure 29: North America Multiple Myeloma Treatment Industry Revenue Share (%), by Therapy 2024 & 2032
- Figure 30: North America Multiple Myeloma Treatment Industry Volume Share (%), by Therapy 2024 & 2032
- Figure 31: North America Multiple Myeloma Treatment Industry Revenue (Million), by End User 2024 & 2032
- Figure 32: North America Multiple Myeloma Treatment Industry Volume (K Unit), by End User 2024 & 2032
- Figure 33: North America Multiple Myeloma Treatment Industry Revenue Share (%), by End User 2024 & 2032
- Figure 34: North America Multiple Myeloma Treatment Industry Volume Share (%), by End User 2024 & 2032
- Figure 35: North America Multiple Myeloma Treatment Industry Revenue (Million), by Country 2024 & 2032
- Figure 36: North America Multiple Myeloma Treatment Industry Volume (K Unit), by Country 2024 & 2032
- Figure 37: North America Multiple Myeloma Treatment Industry Revenue Share (%), by Country 2024 & 2032
- Figure 38: North America Multiple Myeloma Treatment Industry Volume Share (%), by Country 2024 & 2032
- Figure 39: Europe Multiple Myeloma Treatment Industry Revenue (Million), by Disease Condition 2024 & 2032
- Figure 40: Europe Multiple Myeloma Treatment Industry Volume (K Unit), by Disease Condition 2024 & 2032
- Figure 41: Europe Multiple Myeloma Treatment Industry Revenue Share (%), by Disease Condition 2024 & 2032
- Figure 42: Europe Multiple Myeloma Treatment Industry Volume Share (%), by Disease Condition 2024 & 2032
- Figure 43: Europe Multiple Myeloma Treatment Industry Revenue (Million), by Therapy 2024 & 2032
- Figure 44: Europe Multiple Myeloma Treatment Industry Volume (K Unit), by Therapy 2024 & 2032
- Figure 45: Europe Multiple Myeloma Treatment Industry Revenue Share (%), by Therapy 2024 & 2032
- Figure 46: Europe Multiple Myeloma Treatment Industry Volume Share (%), by Therapy 2024 & 2032
- Figure 47: Europe Multiple Myeloma Treatment Industry Revenue (Million), by End User 2024 & 2032
- Figure 48: Europe Multiple Myeloma Treatment Industry Volume (K Unit), by End User 2024 & 2032
- Figure 49: Europe Multiple Myeloma Treatment Industry Revenue Share (%), by End User 2024 & 2032
- Figure 50: Europe Multiple Myeloma Treatment Industry Volume Share (%), by End User 2024 & 2032
- Figure 51: Europe Multiple Myeloma Treatment Industry Revenue (Million), by Country 2024 & 2032
- Figure 52: Europe Multiple Myeloma Treatment Industry Volume (K Unit), by Country 2024 & 2032
- Figure 53: Europe Multiple Myeloma Treatment Industry Revenue Share (%), by Country 2024 & 2032
- Figure 54: Europe Multiple Myeloma Treatment Industry Volume Share (%), by Country 2024 & 2032
- Figure 55: Asia Pacific Multiple Myeloma Treatment Industry Revenue (Million), by Disease Condition 2024 & 2032
- Figure 56: Asia Pacific Multiple Myeloma Treatment Industry Volume (K Unit), by Disease Condition 2024 & 2032
- Figure 57: Asia Pacific Multiple Myeloma Treatment Industry Revenue Share (%), by Disease Condition 2024 & 2032
- Figure 58: Asia Pacific Multiple Myeloma Treatment Industry Volume Share (%), by Disease Condition 2024 & 2032
- Figure 59: Asia Pacific Multiple Myeloma Treatment Industry Revenue (Million), by Therapy 2024 & 2032
- Figure 60: Asia Pacific Multiple Myeloma Treatment Industry Volume (K Unit), by Therapy 2024 & 2032
- Figure 61: Asia Pacific Multiple Myeloma Treatment Industry Revenue Share (%), by Therapy 2024 & 2032
- Figure 62: Asia Pacific Multiple Myeloma Treatment Industry Volume Share (%), by Therapy 2024 & 2032
- Figure 63: Asia Pacific Multiple Myeloma Treatment Industry Revenue (Million), by End User 2024 & 2032
- Figure 64: Asia Pacific Multiple Myeloma Treatment Industry Volume (K Unit), by End User 2024 & 2032
- Figure 65: Asia Pacific Multiple Myeloma Treatment Industry Revenue Share (%), by End User 2024 & 2032
- Figure 66: Asia Pacific Multiple Myeloma Treatment Industry Volume Share (%), by End User 2024 & 2032
- Figure 67: Asia Pacific Multiple Myeloma Treatment Industry Revenue (Million), by Country 2024 & 2032
- Figure 68: Asia Pacific Multiple Myeloma Treatment Industry Volume (K Unit), by Country 2024 & 2032
- Figure 69: Asia Pacific Multiple Myeloma Treatment Industry Revenue Share (%), by Country 2024 & 2032
- Figure 70: Asia Pacific Multiple Myeloma Treatment Industry Volume Share (%), by Country 2024 & 2032
- Figure 71: Middle East and Africa Multiple Myeloma Treatment Industry Revenue (Million), by Disease Condition 2024 & 2032
- Figure 72: Middle East and Africa Multiple Myeloma Treatment Industry Volume (K Unit), by Disease Condition 2024 & 2032
- Figure 73: Middle East and Africa Multiple Myeloma Treatment Industry Revenue Share (%), by Disease Condition 2024 & 2032
- Figure 74: Middle East and Africa Multiple Myeloma Treatment Industry Volume Share (%), by Disease Condition 2024 & 2032
- Figure 75: Middle East and Africa Multiple Myeloma Treatment Industry Revenue (Million), by Therapy 2024 & 2032
- Figure 76: Middle East and Africa Multiple Myeloma Treatment Industry Volume (K Unit), by Therapy 2024 & 2032
- Figure 77: Middle East and Africa Multiple Myeloma Treatment Industry Revenue Share (%), by Therapy 2024 & 2032
- Figure 78: Middle East and Africa Multiple Myeloma Treatment Industry Volume Share (%), by Therapy 2024 & 2032
- Figure 79: Middle East and Africa Multiple Myeloma Treatment Industry Revenue (Million), by End User 2024 & 2032
- Figure 80: Middle East and Africa Multiple Myeloma Treatment Industry Volume (K Unit), by End User 2024 & 2032
- Figure 81: Middle East and Africa Multiple Myeloma Treatment Industry Revenue Share (%), by End User 2024 & 2032
- Figure 82: Middle East and Africa Multiple Myeloma Treatment Industry Volume Share (%), by End User 2024 & 2032
- Figure 83: Middle East and Africa Multiple Myeloma Treatment Industry Revenue (Million), by Country 2024 & 2032
- Figure 84: Middle East and Africa Multiple Myeloma Treatment Industry Volume (K Unit), by Country 2024 & 2032
- Figure 85: Middle East and Africa Multiple Myeloma Treatment Industry Revenue Share (%), by Country 2024 & 2032
- Figure 86: Middle East and Africa Multiple Myeloma Treatment Industry Volume Share (%), by Country 2024 & 2032
- Figure 87: South America Multiple Myeloma Treatment Industry Revenue (Million), by Disease Condition 2024 & 2032
- Figure 88: South America Multiple Myeloma Treatment Industry Volume (K Unit), by Disease Condition 2024 & 2032
- Figure 89: South America Multiple Myeloma Treatment Industry Revenue Share (%), by Disease Condition 2024 & 2032
- Figure 90: South America Multiple Myeloma Treatment Industry Volume Share (%), by Disease Condition 2024 & 2032
- Figure 91: South America Multiple Myeloma Treatment Industry Revenue (Million), by Therapy 2024 & 2032
- Figure 92: South America Multiple Myeloma Treatment Industry Volume (K Unit), by Therapy 2024 & 2032
- Figure 93: South America Multiple Myeloma Treatment Industry Revenue Share (%), by Therapy 2024 & 2032
- Figure 94: South America Multiple Myeloma Treatment Industry Volume Share (%), by Therapy 2024 & 2032
- Figure 95: South America Multiple Myeloma Treatment Industry Revenue (Million), by End User 2024 & 2032
- Figure 96: South America Multiple Myeloma Treatment Industry Volume (K Unit), by End User 2024 & 2032
- Figure 97: South America Multiple Myeloma Treatment Industry Revenue Share (%), by End User 2024 & 2032
- Figure 98: South America Multiple Myeloma Treatment Industry Volume Share (%), by End User 2024 & 2032
- Figure 99: South America Multiple Myeloma Treatment Industry Revenue (Million), by Country 2024 & 2032
- Figure 100: South America Multiple Myeloma Treatment Industry Volume (K Unit), by Country 2024 & 2032
- Figure 101: South America Multiple Myeloma Treatment Industry Revenue Share (%), by Country 2024 & 2032
- Figure 102: South America Multiple Myeloma Treatment Industry Volume Share (%), by Country 2024 & 2032
List of Tables
- Table 1: Global Multiple Myeloma Treatment Industry Revenue Million Forecast, by Region 2019 & 2032
- Table 2: Global Multiple Myeloma Treatment Industry Volume K Unit Forecast, by Region 2019 & 2032
- Table 3: Global Multiple Myeloma Treatment Industry Revenue Million Forecast, by Disease Condition 2019 & 2032
- Table 4: Global Multiple Myeloma Treatment Industry Volume K Unit Forecast, by Disease Condition 2019 & 2032
- Table 5: Global Multiple Myeloma Treatment Industry Revenue Million Forecast, by Therapy 2019 & 2032
- Table 6: Global Multiple Myeloma Treatment Industry Volume K Unit Forecast, by Therapy 2019 & 2032
- Table 7: Global Multiple Myeloma Treatment Industry Revenue Million Forecast, by End User 2019 & 2032
- Table 8: Global Multiple Myeloma Treatment Industry Volume K Unit Forecast, by End User 2019 & 2032
- Table 9: Global Multiple Myeloma Treatment Industry Revenue Million Forecast, by Region 2019 & 2032
- Table 10: Global Multiple Myeloma Treatment Industry Volume K Unit Forecast, by Region 2019 & 2032
- Table 11: Global Multiple Myeloma Treatment Industry Revenue Million Forecast, by Country 2019 & 2032
- Table 12: Global Multiple Myeloma Treatment Industry Volume K Unit Forecast, by Country 2019 & 2032
- Table 13: United States Multiple Myeloma Treatment Industry Revenue (Million) Forecast, by Application 2019 & 2032
- Table 14: United States Multiple Myeloma Treatment Industry Volume (K Unit) Forecast, by Application 2019 & 2032
- Table 15: Canada Multiple Myeloma Treatment Industry Revenue (Million) Forecast, by Application 2019 & 2032
- Table 16: Canada Multiple Myeloma Treatment Industry Volume (K Unit) Forecast, by Application 2019 & 2032
- Table 17: Mexico Multiple Myeloma Treatment Industry Revenue (Million) Forecast, by Application 2019 & 2032
- Table 18: Mexico Multiple Myeloma Treatment Industry Volume (K Unit) Forecast, by Application 2019 & 2032
- Table 19: Global Multiple Myeloma Treatment Industry Revenue Million Forecast, by Country 2019 & 2032
- Table 20: Global Multiple Myeloma Treatment Industry Volume K Unit Forecast, by Country 2019 & 2032
- Table 21: Germany Multiple Myeloma Treatment Industry Revenue (Million) Forecast, by Application 2019 & 2032
- Table 22: Germany Multiple Myeloma Treatment Industry Volume (K Unit) Forecast, by Application 2019 & 2032
- Table 23: United Kingdom Multiple Myeloma Treatment Industry Revenue (Million) Forecast, by Application 2019 & 2032
- Table 24: United Kingdom Multiple Myeloma Treatment Industry Volume (K Unit) Forecast, by Application 2019 & 2032
- Table 25: France Multiple Myeloma Treatment Industry Revenue (Million) Forecast, by Application 2019 & 2032
- Table 26: France Multiple Myeloma Treatment Industry Volume (K Unit) Forecast, by Application 2019 & 2032
- Table 27: Italy Multiple Myeloma Treatment Industry Revenue (Million) Forecast, by Application 2019 & 2032
- Table 28: Italy Multiple Myeloma Treatment Industry Volume (K Unit) Forecast, by Application 2019 & 2032
- Table 29: Spain Multiple Myeloma Treatment Industry Revenue (Million) Forecast, by Application 2019 & 2032
- Table 30: Spain Multiple Myeloma Treatment Industry Volume (K Unit) Forecast, by Application 2019 & 2032
- Table 31: Rest of Europe Multiple Myeloma Treatment Industry Revenue (Million) Forecast, by Application 2019 & 2032
- Table 32: Rest of Europe Multiple Myeloma Treatment Industry Volume (K Unit) Forecast, by Application 2019 & 2032
- Table 33: Global Multiple Myeloma Treatment Industry Revenue Million Forecast, by Country 2019 & 2032
- Table 34: Global Multiple Myeloma Treatment Industry Volume K Unit Forecast, by Country 2019 & 2032
- Table 35: China Multiple Myeloma Treatment Industry Revenue (Million) Forecast, by Application 2019 & 2032
- Table 36: China Multiple Myeloma Treatment Industry Volume (K Unit) Forecast, by Application 2019 & 2032
- Table 37: Japan Multiple Myeloma Treatment Industry Revenue (Million) Forecast, by Application 2019 & 2032
- Table 38: Japan Multiple Myeloma Treatment Industry Volume (K Unit) Forecast, by Application 2019 & 2032
- Table 39: India Multiple Myeloma Treatment Industry Revenue (Million) Forecast, by Application 2019 & 2032
- Table 40: India Multiple Myeloma Treatment Industry Volume (K Unit) Forecast, by Application 2019 & 2032
- Table 41: Australia Multiple Myeloma Treatment Industry Revenue (Million) Forecast, by Application 2019 & 2032
- Table 42: Australia Multiple Myeloma Treatment Industry Volume (K Unit) Forecast, by Application 2019 & 2032
- Table 43: South Korea Multiple Myeloma Treatment Industry Revenue (Million) Forecast, by Application 2019 & 2032
- Table 44: South Korea Multiple Myeloma Treatment Industry Volume (K Unit) Forecast, by Application 2019 & 2032
- Table 45: Rest of Asia Pacific Multiple Myeloma Treatment Industry Revenue (Million) Forecast, by Application 2019 & 2032
- Table 46: Rest of Asia Pacific Multiple Myeloma Treatment Industry Volume (K Unit) Forecast, by Application 2019 & 2032
- Table 47: Global Multiple Myeloma Treatment Industry Revenue Million Forecast, by Country 2019 & 2032
- Table 48: Global Multiple Myeloma Treatment Industry Volume K Unit Forecast, by Country 2019 & 2032
- Table 49: GCC Multiple Myeloma Treatment Industry Revenue (Million) Forecast, by Application 2019 & 2032
- Table 50: GCC Multiple Myeloma Treatment Industry Volume (K Unit) Forecast, by Application 2019 & 2032
- Table 51: South Africa Multiple Myeloma Treatment Industry Revenue (Million) Forecast, by Application 2019 & 2032
- Table 52: South Africa Multiple Myeloma Treatment Industry Volume (K Unit) Forecast, by Application 2019 & 2032
- Table 53: Rest of Middle East and Africa Multiple Myeloma Treatment Industry Revenue (Million) Forecast, by Application 2019 & 2032
- Table 54: Rest of Middle East and Africa Multiple Myeloma Treatment Industry Volume (K Unit) Forecast, by Application 2019 & 2032
- Table 55: Global Multiple Myeloma Treatment Industry Revenue Million Forecast, by Country 2019 & 2032
- Table 56: Global Multiple Myeloma Treatment Industry Volume K Unit Forecast, by Country 2019 & 2032
- Table 57: Brazil Multiple Myeloma Treatment Industry Revenue (Million) Forecast, by Application 2019 & 2032
- Table 58: Brazil Multiple Myeloma Treatment Industry Volume (K Unit) Forecast, by Application 2019 & 2032
- Table 59: Argentina Multiple Myeloma Treatment Industry Revenue (Million) Forecast, by Application 2019 & 2032
- Table 60: Argentina Multiple Myeloma Treatment Industry Volume (K Unit) Forecast, by Application 2019 & 2032
- Table 61: Rest of South America Multiple Myeloma Treatment Industry Revenue (Million) Forecast, by Application 2019 & 2032
- Table 62: Rest of South America Multiple Myeloma Treatment Industry Volume (K Unit) Forecast, by Application 2019 & 2032
- Table 63: Global Multiple Myeloma Treatment Industry Revenue Million Forecast, by Disease Condition 2019 & 2032
- Table 64: Global Multiple Myeloma Treatment Industry Volume K Unit Forecast, by Disease Condition 2019 & 2032
- Table 65: Global Multiple Myeloma Treatment Industry Revenue Million Forecast, by Therapy 2019 & 2032
- Table 66: Global Multiple Myeloma Treatment Industry Volume K Unit Forecast, by Therapy 2019 & 2032
- Table 67: Global Multiple Myeloma Treatment Industry Revenue Million Forecast, by End User 2019 & 2032
- Table 68: Global Multiple Myeloma Treatment Industry Volume K Unit Forecast, by End User 2019 & 2032
- Table 69: Global Multiple Myeloma Treatment Industry Revenue Million Forecast, by Country 2019 & 2032
- Table 70: Global Multiple Myeloma Treatment Industry Volume K Unit Forecast, by Country 2019 & 2032
- Table 71: United States Multiple Myeloma Treatment Industry Revenue (Million) Forecast, by Application 2019 & 2032
- Table 72: United States Multiple Myeloma Treatment Industry Volume (K Unit) Forecast, by Application 2019 & 2032
- Table 73: Canada Multiple Myeloma Treatment Industry Revenue (Million) Forecast, by Application 2019 & 2032
- Table 74: Canada Multiple Myeloma Treatment Industry Volume (K Unit) Forecast, by Application 2019 & 2032
- Table 75: Mexico Multiple Myeloma Treatment Industry Revenue (Million) Forecast, by Application 2019 & 2032
- Table 76: Mexico Multiple Myeloma Treatment Industry Volume (K Unit) Forecast, by Application 2019 & 2032
- Table 77: Global Multiple Myeloma Treatment Industry Revenue Million Forecast, by Disease Condition 2019 & 2032
- Table 78: Global Multiple Myeloma Treatment Industry Volume K Unit Forecast, by Disease Condition 2019 & 2032
- Table 79: Global Multiple Myeloma Treatment Industry Revenue Million Forecast, by Therapy 2019 & 2032
- Table 80: Global Multiple Myeloma Treatment Industry Volume K Unit Forecast, by Therapy 2019 & 2032
- Table 81: Global Multiple Myeloma Treatment Industry Revenue Million Forecast, by End User 2019 & 2032
- Table 82: Global Multiple Myeloma Treatment Industry Volume K Unit Forecast, by End User 2019 & 2032
- Table 83: Global Multiple Myeloma Treatment Industry Revenue Million Forecast, by Country 2019 & 2032
- Table 84: Global Multiple Myeloma Treatment Industry Volume K Unit Forecast, by Country 2019 & 2032
- Table 85: Germany Multiple Myeloma Treatment Industry Revenue (Million) Forecast, by Application 2019 & 2032
- Table 86: Germany Multiple Myeloma Treatment Industry Volume (K Unit) Forecast, by Application 2019 & 2032
- Table 87: United Kingdom Multiple Myeloma Treatment Industry Revenue (Million) Forecast, by Application 2019 & 2032
- Table 88: United Kingdom Multiple Myeloma Treatment Industry Volume (K Unit) Forecast, by Application 2019 & 2032
- Table 89: France Multiple Myeloma Treatment Industry Revenue (Million) Forecast, by Application 2019 & 2032
- Table 90: France Multiple Myeloma Treatment Industry Volume (K Unit) Forecast, by Application 2019 & 2032
- Table 91: Italy Multiple Myeloma Treatment Industry Revenue (Million) Forecast, by Application 2019 & 2032
- Table 92: Italy Multiple Myeloma Treatment Industry Volume (K Unit) Forecast, by Application 2019 & 2032
- Table 93: Spain Multiple Myeloma Treatment Industry Revenue (Million) Forecast, by Application 2019 & 2032
- Table 94: Spain Multiple Myeloma Treatment Industry Volume (K Unit) Forecast, by Application 2019 & 2032
- Table 95: Rest of Europe Multiple Myeloma Treatment Industry Revenue (Million) Forecast, by Application 2019 & 2032
- Table 96: Rest of Europe Multiple Myeloma Treatment Industry Volume (K Unit) Forecast, by Application 2019 & 2032
- Table 97: Global Multiple Myeloma Treatment Industry Revenue Million Forecast, by Disease Condition 2019 & 2032
- Table 98: Global Multiple Myeloma Treatment Industry Volume K Unit Forecast, by Disease Condition 2019 & 2032
- Table 99: Global Multiple Myeloma Treatment Industry Revenue Million Forecast, by Therapy 2019 & 2032
- Table 100: Global Multiple Myeloma Treatment Industry Volume K Unit Forecast, by Therapy 2019 & 2032
- Table 101: Global Multiple Myeloma Treatment Industry Revenue Million Forecast, by End User 2019 & 2032
- Table 102: Global Multiple Myeloma Treatment Industry Volume K Unit Forecast, by End User 2019 & 2032
- Table 103: Global Multiple Myeloma Treatment Industry Revenue Million Forecast, by Country 2019 & 2032
- Table 104: Global Multiple Myeloma Treatment Industry Volume K Unit Forecast, by Country 2019 & 2032
- Table 105: China Multiple Myeloma Treatment Industry Revenue (Million) Forecast, by Application 2019 & 2032
- Table 106: China Multiple Myeloma Treatment Industry Volume (K Unit) Forecast, by Application 2019 & 2032
- Table 107: Japan Multiple Myeloma Treatment Industry Revenue (Million) Forecast, by Application 2019 & 2032
- Table 108: Japan Multiple Myeloma Treatment Industry Volume (K Unit) Forecast, by Application 2019 & 2032
- Table 109: India Multiple Myeloma Treatment Industry Revenue (Million) Forecast, by Application 2019 & 2032
- Table 110: India Multiple Myeloma Treatment Industry Volume (K Unit) Forecast, by Application 2019 & 2032
- Table 111: Australia Multiple Myeloma Treatment Industry Revenue (Million) Forecast, by Application 2019 & 2032
- Table 112: Australia Multiple Myeloma Treatment Industry Volume (K Unit) Forecast, by Application 2019 & 2032
- Table 113: South Korea Multiple Myeloma Treatment Industry Revenue (Million) Forecast, by Application 2019 & 2032
- Table 114: South Korea Multiple Myeloma Treatment Industry Volume (K Unit) Forecast, by Application 2019 & 2032
- Table 115: Rest of Asia Pacific Multiple Myeloma Treatment Industry Revenue (Million) Forecast, by Application 2019 & 2032
- Table 116: Rest of Asia Pacific Multiple Myeloma Treatment Industry Volume (K Unit) Forecast, by Application 2019 & 2032
- Table 117: Global Multiple Myeloma Treatment Industry Revenue Million Forecast, by Disease Condition 2019 & 2032
- Table 118: Global Multiple Myeloma Treatment Industry Volume K Unit Forecast, by Disease Condition 2019 & 2032
- Table 119: Global Multiple Myeloma Treatment Industry Revenue Million Forecast, by Therapy 2019 & 2032
- Table 120: Global Multiple Myeloma Treatment Industry Volume K Unit Forecast, by Therapy 2019 & 2032
- Table 121: Global Multiple Myeloma Treatment Industry Revenue Million Forecast, by End User 2019 & 2032
- Table 122: Global Multiple Myeloma Treatment Industry Volume K Unit Forecast, by End User 2019 & 2032
- Table 123: Global Multiple Myeloma Treatment Industry Revenue Million Forecast, by Country 2019 & 2032
- Table 124: Global Multiple Myeloma Treatment Industry Volume K Unit Forecast, by Country 2019 & 2032
- Table 125: GCC Multiple Myeloma Treatment Industry Revenue (Million) Forecast, by Application 2019 & 2032
- Table 126: GCC Multiple Myeloma Treatment Industry Volume (K Unit) Forecast, by Application 2019 & 2032
- Table 127: South Africa Multiple Myeloma Treatment Industry Revenue (Million) Forecast, by Application 2019 & 2032
- Table 128: South Africa Multiple Myeloma Treatment Industry Volume (K Unit) Forecast, by Application 2019 & 2032
- Table 129: Rest of Middle East and Africa Multiple Myeloma Treatment Industry Revenue (Million) Forecast, by Application 2019 & 2032
- Table 130: Rest of Middle East and Africa Multiple Myeloma Treatment Industry Volume (K Unit) Forecast, by Application 2019 & 2032
- Table 131: Global Multiple Myeloma Treatment Industry Revenue Million Forecast, by Disease Condition 2019 & 2032
- Table 132: Global Multiple Myeloma Treatment Industry Volume K Unit Forecast, by Disease Condition 2019 & 2032
- Table 133: Global Multiple Myeloma Treatment Industry Revenue Million Forecast, by Therapy 2019 & 2032
- Table 134: Global Multiple Myeloma Treatment Industry Volume K Unit Forecast, by Therapy 2019 & 2032
- Table 135: Global Multiple Myeloma Treatment Industry Revenue Million Forecast, by End User 2019 & 2032
- Table 136: Global Multiple Myeloma Treatment Industry Volume K Unit Forecast, by End User 2019 & 2032
- Table 137: Global Multiple Myeloma Treatment Industry Revenue Million Forecast, by Country 2019 & 2032
- Table 138: Global Multiple Myeloma Treatment Industry Volume K Unit Forecast, by Country 2019 & 2032
- Table 139: Brazil Multiple Myeloma Treatment Industry Revenue (Million) Forecast, by Application 2019 & 2032
- Table 140: Brazil Multiple Myeloma Treatment Industry Volume (K Unit) Forecast, by Application 2019 & 2032
- Table 141: Argentina Multiple Myeloma Treatment Industry Revenue (Million) Forecast, by Application 2019 & 2032
- Table 142: Argentina Multiple Myeloma Treatment Industry Volume (K Unit) Forecast, by Application 2019 & 2032
- Table 143: Rest of South America Multiple Myeloma Treatment Industry Revenue (Million) Forecast, by Application 2019 & 2032
- Table 144: Rest of South America Multiple Myeloma Treatment Industry Volume (K Unit) Forecast, by Application 2019 & 2032
Frequently Asked Questions
1. What is the projected Compound Annual Growth Rate (CAGR) of the Multiple Myeloma Treatment Industry?
The projected CAGR is approximately 7.77%.
2. Which companies are prominent players in the Multiple Myeloma Treatment Industry?
Key companies in the market include Sanofi SA, Novartis AG, Amgen Inc, Kite Pharma (Gilead Sciences), AstraZeneca PLC, F Hoffmann-LA Roche Ltd, Atara Biotherapeutics, AbbVie Inc, Incyte Corporation, Johnson & Johnson, Bristol-Myers Squibb Company, Celldex Therapeutics Inc, GlaxoSmithKline PLC, Takeda Pharmaceutical Co Ltd, Pfizer Inc.
3. What are the main segments of the Multiple Myeloma Treatment Industry?
The market segments include Disease Condition, Therapy, End User.
4. Can you provide details about the market size?
The market size is estimated to be USD 67.23 Million as of 2022.
5. What are some drivers contributing to market growth?
Growing Incidence of Blood Cancer; Increasing Awareness about the Possibility of Early Diagnosis; Increasing Emphasis on Development of New Treatments.
6. What are the notable trends driving market growth?
Chemotherapy Leads the Segment. and it is Expected to Witness a Healthy Growth Over the Forecast Period.
7. Are there any restraints impacting market growth?
High Cost of Medication.
8. Can you provide examples of recent developments in the market?
In March 2021, Sanofi SA received US FDA approval for its Sarclisa (isatuximab) in combination with carfilzomib and dexamethasone for patients with relapsed or refractory multiple myeloma.
9. What pricing options are available for accessing the report?
Pricing options include single-user, multi-user, and enterprise licenses priced at USD 4750, USD 5250, and USD 8750 respectively.
10. Is the market size provided in terms of value or volume?
The market size is provided in terms of value, measured in Million and volume, measured in K Unit.
11. Are there any specific market keywords associated with the report?
Yes, the market keyword associated with the report is "Multiple Myeloma Treatment Industry," which aids in identifying and referencing the specific market segment covered.
12. How do I determine which pricing option suits my needs best?
The pricing options vary based on user requirements and access needs. Individual users may opt for single-user licenses, while businesses requiring broader access may choose multi-user or enterprise licenses for cost-effective access to the report.
13. Are there any additional resources or data provided in the Multiple Myeloma Treatment Industry report?
While the report offers comprehensive insights, it's advisable to review the specific contents or supplementary materials provided to ascertain if additional resources or data are available.
14. How can I stay updated on further developments or reports in the Multiple Myeloma Treatment Industry?
To stay informed about further developments, trends, and reports in the Multiple Myeloma Treatment Industry, consider subscribing to industry newsletters, following relevant companies and organizations, or regularly checking reputable industry news sources and publications.
Methodology
Step 1 - Identification of Relevant Samples Size from Population Database


Step 2 - Approaches for Defining Global Market Size (Value, Volume* & Price*)

Note*: In applicable scenarios
Step 3 - Data Sources
Primary Research
- Web Analytics
- Survey Reports
- Research Institute
- Latest Research Reports
- Opinion Leaders
Secondary Research
- Annual Reports
- White Paper
- Latest Press Release
- Industry Association
- Paid Database
- Investor Presentations

Step 4 - Data Triangulation
Involves using different sources of information in order to increase the validity of a study
These sources are likely to be stakeholders in a program - participants, other researchers, program staff, other community members, and so on.
Then we put all data in single framework & apply various statistical tools to find out the dynamic on the market.
During the analysis stage, feedback from the stakeholder groups would be compared to determine areas of agreement as well as areas of divergence
