

Key Insights
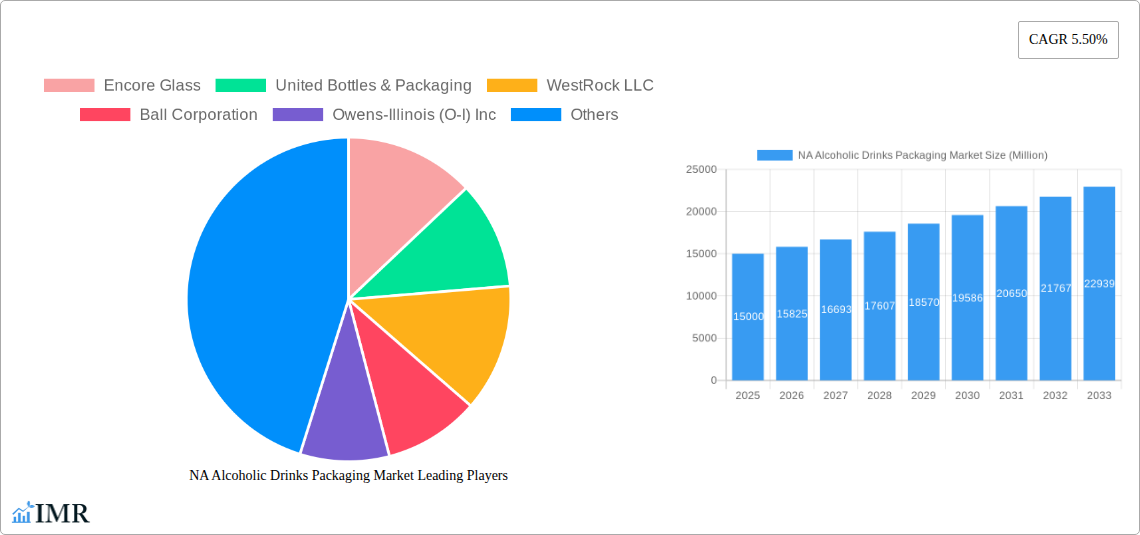
The North American alcoholic drinks packaging market is a dynamic sector experiencing steady growth, projected to maintain a Compound Annual Growth Rate (CAGR) of 5.50% from 2025 to 2033. This expansion is fueled by several key factors. The increasing popularity of craft beers and premium spirits drives demand for aesthetically pleasing and high-quality packaging, particularly glass bottles and metal cans. Simultaneously, the rising consumer preference for convenience and on-the-go consumption boosts the demand for ready-to-drink (RTD) beverages packaged in lightweight, portable formats like pouches and plastic bottles. Furthermore, sustainability concerns are prompting a shift towards eco-friendly packaging materials, such as recycled plastic and paper-based cartons, creating opportunities for innovative packaging solutions. The market is segmented by primary material (plastic, paper, metal, glass), alcoholic product type (wine, spirits, beer, RTD), and product type (bottles, cans, cartons, pouches). Within North America, the United States holds the largest market share, driven by its significant alcoholic beverage consumption and established packaging industry. Canada, while smaller, also contributes substantially to the overall regional growth due to its robust economy and increasing demand for premium alcoholic beverages.
Competitive dynamics within the North American alcoholic drinks packaging market are intense, with established players like Ball Corporation, Owens-Illinois (O-I) Inc., and Crown Holdings Incorporated competing alongside smaller, specialized companies. These companies are constantly innovating to meet evolving consumer preferences, focusing on enhanced functionalities like tamper-evident seals and improved recyclability. The market is further shaped by factors such as fluctuating raw material prices, stringent regulatory compliance requirements regarding labeling and material safety, and the need for efficient supply chain management. Looking ahead, the market's trajectory is expected to remain positive, influenced by continued consumer demand, technological advancements in packaging materials and design, and a growing emphasis on sustainability within the alcoholic beverage industry. Strategic partnerships and mergers and acquisitions are likely to continue shaping the competitive landscape.
North American Alcoholic Drinks Packaging Market Report: 2019-2033
This comprehensive report provides a detailed analysis of the North American alcoholic drinks packaging market, encompassing market dynamics, growth trends, regional dominance, product landscape, key players, and future outlook. The study period covers 2019-2033, with 2025 as the base and estimated year. The forecast period is 2025-2033, and the historical period is 2019-2024. The market is segmented by primary material (plastic, paper, metal, glass), alcoholic product (wine, spirits, beer, ready-to-drink (RTD), other), product type (plastic bottles, glass bottles, metal cans, cartons, pouches, other), and country (United States, Canada). The market size is presented in million units.
NA Alcoholic Drinks Packaging Market Dynamics & Structure
The NA alcoholic drinks packaging market is characterized by moderate concentration, with several major players holding significant market share. Technological innovation, driven by sustainability concerns and consumer preferences, is a key driver. Stringent regulatory frameworks regarding material composition and labeling influence packaging choices. Competition from alternative packaging solutions and evolving end-user demographics (e.g., younger, more environmentally conscious consumers) shape market trends. M&A activity remains relatively active, with larger companies seeking to expand their product portfolios and geographical reach.
- Market Concentration: The top 5 players hold approximately xx% of the market share in 2025.
- Technological Innovation: Focus on lightweighting, sustainable materials (recycled content, bio-based plastics), and improved barrier properties.
- Regulatory Framework: Compliance with labeling regulations, food safety standards, and recyclability mandates impacts packaging choices.
- Competitive Substitutes: Growth of flexible packaging and alternative closure systems creates competitive pressure.
- End-User Demographics: Shifting consumer preferences toward premiumization, sustainability, and convenience influence packaging design and material selection.
- M&A Trends: xx major M&A deals were recorded in the period 2019-2024, primarily driven by consolidation and expansion strategies.
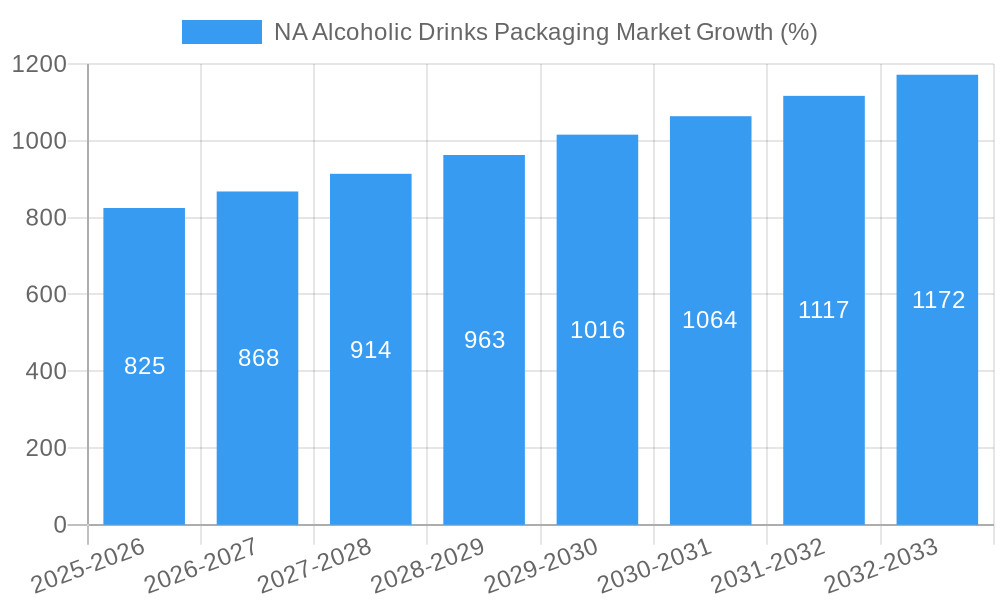
NA Alcoholic Drinks Packaging Market Growth Trends & Insights
The NA alcoholic drinks packaging market is experiencing steady growth, driven by increasing alcoholic beverage consumption and evolving packaging trends. The market size is projected to reach xx million units by 2033, exhibiting a CAGR of xx% during the forecast period. The adoption of sustainable and innovative packaging solutions is accelerating, with a growing preference for lightweighting, recyclable materials, and tamper-evident closures. Consumer preference for convenient packaging formats, such as pouches and cans, is also contributing to market growth. Technological disruptions, including advancements in printing and labeling technologies, are enhancing packaging aesthetics and functionality. Consumer behavior shifts, including the rising demand for premium and craft alcoholic beverages, are influencing packaging choices.
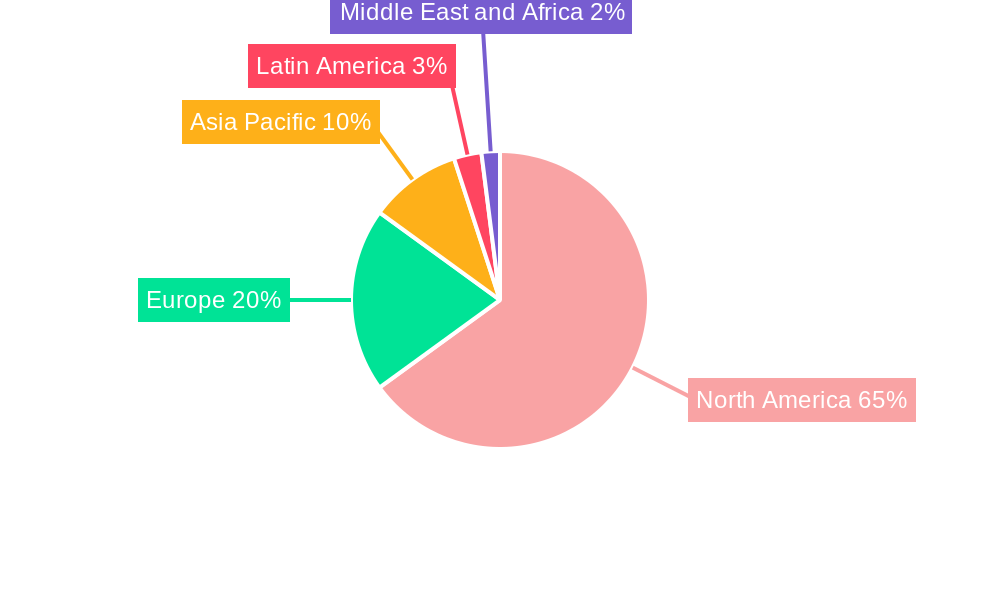
Dominant Regions, Countries, or Segments in NA Alcoholic Drinks Packaging Market
The United States dominates the NA alcoholic drinks packaging market, accounting for xx% of the total market value in 2025, owing to its large alcoholic beverage consumption and established packaging industry. The glass bottle segment holds the largest share within the primary material category, driven by its premium perception and suitability for various alcoholic beverages. Within alcoholic products, beer packaging holds a significant share, followed by wine and spirits.
- United States: Strong alcoholic beverage production and consumption, well-developed packaging infrastructure.
- Canada: Growing demand for premium and craft alcoholic beverages, increasing adoption of sustainable packaging solutions.
- Glass Bottles: Premium image, excellent barrier properties, and recyclability drive its dominance.
- Beer: Largest segment by alcoholic product due to high consumption volumes.
NA Alcoholic Drinks Packaging Market Product Landscape
The NA alcoholic drinks packaging market offers a diverse range of products, including plastic bottles, glass bottles, metal cans, cartons, and pouches. Recent innovations focus on sustainability, convenience, and enhanced product protection. Lightweighting technologies reduce material usage and transportation costs, while improved barrier properties ensure product freshness and quality. Advanced printing and labeling techniques enhance branding and shelf appeal. Unique selling propositions include eco-friendly materials, customizable designs, and innovative closure systems.
Key Drivers, Barriers & Challenges in NA Alcoholic Drinks Packaging Market
Key Drivers: Growing alcoholic beverage consumption, increasing demand for sustainable packaging, technological advancements, and regulatory pressure for improved recyclability. The rising popularity of craft beverages and premiumization trends also fuel demand for innovative and aesthetically pleasing packaging.
Key Barriers and Challenges: Fluctuations in raw material prices, stringent environmental regulations, and intense competition from alternative packaging solutions pose significant challenges. Supply chain disruptions caused by geopolitical events and the COVID-19 pandemic have impacted production and distribution.
Emerging Opportunities in NA Alcoholic Drinks Packaging Market
Emerging opportunities lie in the increasing demand for sustainable and eco-friendly packaging solutions, including the use of recycled materials and bio-based plastics. Growth in the ready-to-drink (RTD) segment presents opportunities for innovative packaging formats, such as pouches and cans. Furthermore, customization options and personalized packaging are gaining traction, offering further growth potential.
Growth Accelerators in the NA Alcoholic Drinks Packaging Market Industry
Long-term growth will be fueled by technological advancements in packaging materials and manufacturing processes. Strategic partnerships between packaging companies and alcoholic beverage producers will enhance innovation and efficiency. Market expansion into emerging alcoholic beverage segments, such as hard seltzers and ready-to-drink cocktails, will also drive growth.
Key Players Shaping the NA Alcoholic Drinks Packaging Market Market
- Encore Glass
- United Bottles & Packaging
- WestRock LLC
- Ball Corporation
- Owens-Illinois (O-I) Inc
- Ardagh Group SA
- Crown Holdings Incorporated
- Berry Global Inc
- IntraPac International LL
- Brick Packaging LLC
- Amcor Ltd
Notable Milestones in NA Alcoholic Drinks Packaging Market Sector
- March 2021: Owens-Illinois (O-I) Inc. invested USD 75 million to expand its Zipaquirá, Colombia facility, increasing its Americas segment capacity by nearly 2% and producing an additional 500 million bottles annually. This demonstrates a commitment to meeting the rising demand for sustainable glass packaging.
- June 2021: AB InBev launched the lightest longneck beer bottle, reducing weight by 30 grams and CO2 emissions by 17% per bottle. This highlights the industry's focus on sustainability and resource efficiency.
In-Depth NA Alcoholic Drinks Packaging Market Market Outlook
The NA alcoholic drinks packaging market is poised for sustained growth, driven by increasing alcoholic beverage consumption and the ongoing shift towards sustainable and innovative packaging solutions. Strategic opportunities exist for companies that can successfully integrate sustainable materials, advanced technologies, and innovative designs to meet the evolving demands of consumers and regulatory bodies. The focus on lightweighting, recyclability, and enhanced product protection will continue to shape the market landscape.
NA Alcoholic Drinks Packaging Market Segmentation
-
1. Primary Material
- 1.1. Plastic
- 1.2. Paper
- 1.3. Metal
- 1.4. Glass
-
2. Alcoholic Products
- 2.1. Wine
- 2.2. Spirits
- 2.3. Beer
- 2.4. Ready to Drink (RTD)
- 2.5. Other Types of Alcoholic Beverages
-
3. Product Type
- 3.1. Plastic Bottles
- 3.2. Glass Bottles
- 3.3. Metal Cans
- 3.4. Cartons
- 3.5. Pouches
- 3.6. Other Product Types
NA Alcoholic Drinks Packaging Market Segmentation By Geography
-
1. North America
- 1.1. United States
- 1.2. Canada
- 1.3. Mexico
-
2. South America
- 2.1. Brazil
- 2.2. Argentina
- 2.3. Rest of South America
-
3. Europe
- 3.1. United Kingdom
- 3.2. Germany
- 3.3. France
- 3.4. Italy
- 3.5. Spain
- 3.6. Russia
- 3.7. Benelux
- 3.8. Nordics
- 3.9. Rest of Europe
-
4. Middle East & Africa
- 4.1. Turkey
- 4.2. Israel
- 4.3. GCC
- 4.4. North Africa
- 4.5. South Africa
- 4.6. Rest of Middle East & Africa
-
5. Asia Pacific
- 5.1. China
- 5.2. India
- 5.3. Japan
- 5.4. South Korea
- 5.5. ASEAN
- 5.6. Oceania
- 5.7. Rest of Asia Pacific
NA Alcoholic Drinks Packaging Market REPORT HIGHLIGHTS
| Aspects | Details |
|---|---|
| Study Period | 2019-2033 |
| Base Year | 2024 |
| Estimated Year | 2025 |
| Forecast Period | 2025-2033 |
| Historical Period | 2019-2024 |
| Growth Rate | CAGR of 5.50% from 2019-2033 |
| Segmentation |
|
Table of Contents
- 1. Introduction
- 1.1. Research Scope
- 1.2. Market Segmentation
- 1.3. Research Methodology
- 1.4. Definitions and Assumptions
- 2. Executive Summary
- 2.1. Introduction
- 3. Market Dynamics
- 3.1. Introduction
- 3.2. Market Drivers
- 3.2.1. High Purchasing Power of Consumers; Increasing Consumption of Alcoholic Drinks
- 3.3. Market Restrains
- 3.3.1. Stringent Government Regulations Regarding Environmental Safety; Lack Of Improvement In Technology To Hinder The Growth
- 3.4. Market Trends
- 3.4.1. Wine Consumption is expected to Grow Significantly
- 4. Market Factor Analysis
- 4.1. Porters Five Forces
- 4.2. Supply/Value Chain
- 4.3. PESTEL analysis
- 4.4. Market Entropy
- 4.5. Patent/Trademark Analysis
- 5. Global NA Alcoholic Drinks Packaging Market Analysis, Insights and Forecast, 2019-2031
- 5.1. Market Analysis, Insights and Forecast - by Primary Material
- 5.1.1. Plastic
- 5.1.2. Paper
- 5.1.3. Metal
- 5.1.4. Glass
- 5.2. Market Analysis, Insights and Forecast - by Alcoholic Products
- 5.2.1. Wine
- 5.2.2. Spirits
- 5.2.3. Beer
- 5.2.4. Ready to Drink (RTD)
- 5.2.5. Other Types of Alcoholic Beverages
- 5.3. Market Analysis, Insights and Forecast - by Product Type
- 5.3.1. Plastic Bottles
- 5.3.2. Glass Bottles
- 5.3.3. Metal Cans
- 5.3.4. Cartons
- 5.3.5. Pouches
- 5.3.6. Other Product Types
- 5.4. Market Analysis, Insights and Forecast - by Region
- 5.4.1. North America
- 5.4.2. South America
- 5.4.3. Europe
- 5.4.4. Middle East & Africa
- 5.4.5. Asia Pacific
- 5.1. Market Analysis, Insights and Forecast - by Primary Material
- 6. North America NA Alcoholic Drinks Packaging Market Analysis, Insights and Forecast, 2019-2031
- 6.1. Market Analysis, Insights and Forecast - by Primary Material
- 6.1.1. Plastic
- 6.1.2. Paper
- 6.1.3. Metal
- 6.1.4. Glass
- 6.2. Market Analysis, Insights and Forecast - by Alcoholic Products
- 6.2.1. Wine
- 6.2.2. Spirits
- 6.2.3. Beer
- 6.2.4. Ready to Drink (RTD)
- 6.2.5. Other Types of Alcoholic Beverages
- 6.3. Market Analysis, Insights and Forecast - by Product Type
- 6.3.1. Plastic Bottles
- 6.3.2. Glass Bottles
- 6.3.3. Metal Cans
- 6.3.4. Cartons
- 6.3.5. Pouches
- 6.3.6. Other Product Types
- 6.1. Market Analysis, Insights and Forecast - by Primary Material
- 7. South America NA Alcoholic Drinks Packaging Market Analysis, Insights and Forecast, 2019-2031
- 7.1. Market Analysis, Insights and Forecast - by Primary Material
- 7.1.1. Plastic
- 7.1.2. Paper
- 7.1.3. Metal
- 7.1.4. Glass
- 7.2. Market Analysis, Insights and Forecast - by Alcoholic Products
- 7.2.1. Wine
- 7.2.2. Spirits
- 7.2.3. Beer
- 7.2.4. Ready to Drink (RTD)
- 7.2.5. Other Types of Alcoholic Beverages
- 7.3. Market Analysis, Insights and Forecast - by Product Type
- 7.3.1. Plastic Bottles
- 7.3.2. Glass Bottles
- 7.3.3. Metal Cans
- 7.3.4. Cartons
- 7.3.5. Pouches
- 7.3.6. Other Product Types
- 7.1. Market Analysis, Insights and Forecast - by Primary Material
- 8. Europe NA Alcoholic Drinks Packaging Market Analysis, Insights and Forecast, 2019-2031
- 8.1. Market Analysis, Insights and Forecast - by Primary Material
- 8.1.1. Plastic
- 8.1.2. Paper
- 8.1.3. Metal
- 8.1.4. Glass
- 8.2. Market Analysis, Insights and Forecast - by Alcoholic Products
- 8.2.1. Wine
- 8.2.2. Spirits
- 8.2.3. Beer
- 8.2.4. Ready to Drink (RTD)
- 8.2.5. Other Types of Alcoholic Beverages
- 8.3. Market Analysis, Insights and Forecast - by Product Type
- 8.3.1. Plastic Bottles
- 8.3.2. Glass Bottles
- 8.3.3. Metal Cans
- 8.3.4. Cartons
- 8.3.5. Pouches
- 8.3.6. Other Product Types
- 8.1. Market Analysis, Insights and Forecast - by Primary Material
- 9. Middle East & Africa NA Alcoholic Drinks Packaging Market Analysis, Insights and Forecast, 2019-2031
- 9.1. Market Analysis, Insights and Forecast - by Primary Material
- 9.1.1. Plastic
- 9.1.2. Paper
- 9.1.3. Metal
- 9.1.4. Glass
- 9.2. Market Analysis, Insights and Forecast - by Alcoholic Products
- 9.2.1. Wine
- 9.2.2. Spirits
- 9.2.3. Beer
- 9.2.4. Ready to Drink (RTD)
- 9.2.5. Other Types of Alcoholic Beverages
- 9.3. Market Analysis, Insights and Forecast - by Product Type
- 9.3.1. Plastic Bottles
- 9.3.2. Glass Bottles
- 9.3.3. Metal Cans
- 9.3.4. Cartons
- 9.3.5. Pouches
- 9.3.6. Other Product Types
- 9.1. Market Analysis, Insights and Forecast - by Primary Material
- 10. Asia Pacific NA Alcoholic Drinks Packaging Market Analysis, Insights and Forecast, 2019-2031
- 10.1. Market Analysis, Insights and Forecast - by Primary Material
- 10.1.1. Plastic
- 10.1.2. Paper
- 10.1.3. Metal
- 10.1.4. Glass
- 10.2. Market Analysis, Insights and Forecast - by Alcoholic Products
- 10.2.1. Wine
- 10.2.2. Spirits
- 10.2.3. Beer
- 10.2.4. Ready to Drink (RTD)
- 10.2.5. Other Types of Alcoholic Beverages
- 10.3. Market Analysis, Insights and Forecast - by Product Type
- 10.3.1. Plastic Bottles
- 10.3.2. Glass Bottles
- 10.3.3. Metal Cans
- 10.3.4. Cartons
- 10.3.5. Pouches
- 10.3.6. Other Product Types
- 10.1. Market Analysis, Insights and Forecast - by Primary Material
- 11. North America NA Alcoholic Drinks Packaging Market Analysis, Insights and Forecast, 2019-2031
- 11.1. Market Analysis, Insights and Forecast - By Country/Sub-region
- 11.1.1 United States
- 11.1.2 Canada
- 12. Europe NA Alcoholic Drinks Packaging Market Analysis, Insights and Forecast, 2019-2031
- 12.1. Market Analysis, Insights and Forecast - By Country/Sub-region
- 12.1.1 United Kingdom
- 12.1.2 Germany
- 12.1.3 France
- 12.1.4 Spain
- 12.1.5 Rest of Europe
- 13. Asia Pacific NA Alcoholic Drinks Packaging Market Analysis, Insights and Forecast, 2019-2031
- 13.1. Market Analysis, Insights and Forecast - By Country/Sub-region
- 13.1.1 China
- 13.1.2 India
- 13.1.3 Japan
- 13.1.4 South Korea
- 13.1.5 Rest of Asia Pacific
- 14. Latin America NA Alcoholic Drinks Packaging Market Analysis, Insights and Forecast, 2019-2031
- 14.1. Market Analysis, Insights and Forecast - By Country/Sub-region
- 14.1.1 Brazil
- 14.1.2 Mexico
- 14.1.3 Rest of Latin America
- 15. Middle East and Africa NA Alcoholic Drinks Packaging Market Analysis, Insights and Forecast, 2019-2031
- 15.1. Market Analysis, Insights and Forecast - By Country/Sub-region
- 15.1.1. Gulf Cooperation Council
- 16. Egypt NA Alcoholic Drinks Packaging Market Analysis, Insights and Forecast, 2019-2031
- 16.1. Market Analysis, Insights and Forecast - By Country/Sub-region
- 16.1.1 Nigeria
- 16.1.2 Kenya
- 16.1.3 South Africa
- 16.1.4 Turkey
- 16.1.5 Rest of Middle East
- 17. Competitive Analysis
- 17.1. Global Market Share Analysis 2024
- 17.2. Company Profiles
- 17.2.1 Encore Glass
- 17.2.1.1. Overview
- 17.2.1.2. Products
- 17.2.1.3. SWOT Analysis
- 17.2.1.4. Recent Developments
- 17.2.1.5. Financials (Based on Availability)
- 17.2.2 United Bottles & Packaging
- 17.2.2.1. Overview
- 17.2.2.2. Products
- 17.2.2.3. SWOT Analysis
- 17.2.2.4. Recent Developments
- 17.2.2.5. Financials (Based on Availability)
- 17.2.3 WestRock LLC
- 17.2.3.1. Overview
- 17.2.3.2. Products
- 17.2.3.3. SWOT Analysis
- 17.2.3.4. Recent Developments
- 17.2.3.5. Financials (Based on Availability)
- 17.2.4 Ball Corporation
- 17.2.4.1. Overview
- 17.2.4.2. Products
- 17.2.4.3. SWOT Analysis
- 17.2.4.4. Recent Developments
- 17.2.4.5. Financials (Based on Availability)
- 17.2.5 Owens-Illinois (O-I) Inc
- 17.2.5.1. Overview
- 17.2.5.2. Products
- 17.2.5.3. SWOT Analysis
- 17.2.5.4. Recent Developments
- 17.2.5.5. Financials (Based on Availability)
- 17.2.6 Ardagh Group SA
- 17.2.6.1. Overview
- 17.2.6.2. Products
- 17.2.6.3. SWOT Analysis
- 17.2.6.4. Recent Developments
- 17.2.6.5. Financials (Based on Availability)
- 17.2.7 Crown Holdings Incorporated
- 17.2.7.1. Overview
- 17.2.7.2. Products
- 17.2.7.3. SWOT Analysis
- 17.2.7.4. Recent Developments
- 17.2.7.5. Financials (Based on Availability)
- 17.2.8 Berry Global Inc
- 17.2.8.1. Overview
- 17.2.8.2. Products
- 17.2.8.3. SWOT Analysis
- 17.2.8.4. Recent Developments
- 17.2.8.5. Financials (Based on Availability)
- 17.2.9 IntraPac International LL
- 17.2.9.1. Overview
- 17.2.9.2. Products
- 17.2.9.3. SWOT Analysis
- 17.2.9.4. Recent Developments
- 17.2.9.5. Financials (Based on Availability)
- 17.2.10 Brick Packaging LLC
- 17.2.10.1. Overview
- 17.2.10.2. Products
- 17.2.10.3. SWOT Analysis
- 17.2.10.4. Recent Developments
- 17.2.10.5. Financials (Based on Availability)
- 17.2.11 Amcor Ltd
- 17.2.11.1. Overview
- 17.2.11.2. Products
- 17.2.11.3. SWOT Analysis
- 17.2.11.4. Recent Developments
- 17.2.11.5. Financials (Based on Availability)
- 17.2.1 Encore Glass
List of Figures
- Figure 1: Global NA Alcoholic Drinks Packaging Market Revenue Breakdown (Million, %) by Region 2024 & 2032
- Figure 2: North America NA Alcoholic Drinks Packaging Market Revenue (Million), by Country 2024 & 2032
- Figure 3: North America NA Alcoholic Drinks Packaging Market Revenue Share (%), by Country 2024 & 2032
- Figure 4: Europe NA Alcoholic Drinks Packaging Market Revenue (Million), by Country 2024 & 2032
- Figure 5: Europe NA Alcoholic Drinks Packaging Market Revenue Share (%), by Country 2024 & 2032
- Figure 6: Asia Pacific NA Alcoholic Drinks Packaging Market Revenue (Million), by Country 2024 & 2032
- Figure 7: Asia Pacific NA Alcoholic Drinks Packaging Market Revenue Share (%), by Country 2024 & 2032
- Figure 8: Latin America NA Alcoholic Drinks Packaging Market Revenue (Million), by Country 2024 & 2032
- Figure 9: Latin America NA Alcoholic Drinks Packaging Market Revenue Share (%), by Country 2024 & 2032
- Figure 10: Middle East and Africa NA Alcoholic Drinks Packaging Market Revenue (Million), by Country 2024 & 2032
- Figure 11: Middle East and Africa NA Alcoholic Drinks Packaging Market Revenue Share (%), by Country 2024 & 2032
- Figure 12: Egypt NA Alcoholic Drinks Packaging Market Revenue (Million), by Country 2024 & 2032
- Figure 13: Egypt NA Alcoholic Drinks Packaging Market Revenue Share (%), by Country 2024 & 2032
- Figure 14: North America NA Alcoholic Drinks Packaging Market Revenue (Million), by Primary Material 2024 & 2032
- Figure 15: North America NA Alcoholic Drinks Packaging Market Revenue Share (%), by Primary Material 2024 & 2032
- Figure 16: North America NA Alcoholic Drinks Packaging Market Revenue (Million), by Alcoholic Products 2024 & 2032
- Figure 17: North America NA Alcoholic Drinks Packaging Market Revenue Share (%), by Alcoholic Products 2024 & 2032
- Figure 18: North America NA Alcoholic Drinks Packaging Market Revenue (Million), by Product Type 2024 & 2032
- Figure 19: North America NA Alcoholic Drinks Packaging Market Revenue Share (%), by Product Type 2024 & 2032
- Figure 20: North America NA Alcoholic Drinks Packaging Market Revenue (Million), by Country 2024 & 2032
- Figure 21: North America NA Alcoholic Drinks Packaging Market Revenue Share (%), by Country 2024 & 2032
- Figure 22: South America NA Alcoholic Drinks Packaging Market Revenue (Million), by Primary Material 2024 & 2032
- Figure 23: South America NA Alcoholic Drinks Packaging Market Revenue Share (%), by Primary Material 2024 & 2032
- Figure 24: South America NA Alcoholic Drinks Packaging Market Revenue (Million), by Alcoholic Products 2024 & 2032
- Figure 25: South America NA Alcoholic Drinks Packaging Market Revenue Share (%), by Alcoholic Products 2024 & 2032
- Figure 26: South America NA Alcoholic Drinks Packaging Market Revenue (Million), by Product Type 2024 & 2032
- Figure 27: South America NA Alcoholic Drinks Packaging Market Revenue Share (%), by Product Type 2024 & 2032
- Figure 28: South America NA Alcoholic Drinks Packaging Market Revenue (Million), by Country 2024 & 2032
- Figure 29: South America NA Alcoholic Drinks Packaging Market Revenue Share (%), by Country 2024 & 2032
- Figure 30: Europe NA Alcoholic Drinks Packaging Market Revenue (Million), by Primary Material 2024 & 2032
- Figure 31: Europe NA Alcoholic Drinks Packaging Market Revenue Share (%), by Primary Material 2024 & 2032
- Figure 32: Europe NA Alcoholic Drinks Packaging Market Revenue (Million), by Alcoholic Products 2024 & 2032
- Figure 33: Europe NA Alcoholic Drinks Packaging Market Revenue Share (%), by Alcoholic Products 2024 & 2032
- Figure 34: Europe NA Alcoholic Drinks Packaging Market Revenue (Million), by Product Type 2024 & 2032
- Figure 35: Europe NA Alcoholic Drinks Packaging Market Revenue Share (%), by Product Type 2024 & 2032
- Figure 36: Europe NA Alcoholic Drinks Packaging Market Revenue (Million), by Country 2024 & 2032
- Figure 37: Europe NA Alcoholic Drinks Packaging Market Revenue Share (%), by Country 2024 & 2032
- Figure 38: Middle East & Africa NA Alcoholic Drinks Packaging Market Revenue (Million), by Primary Material 2024 & 2032
- Figure 39: Middle East & Africa NA Alcoholic Drinks Packaging Market Revenue Share (%), by Primary Material 2024 & 2032
- Figure 40: Middle East & Africa NA Alcoholic Drinks Packaging Market Revenue (Million), by Alcoholic Products 2024 & 2032
- Figure 41: Middle East & Africa NA Alcoholic Drinks Packaging Market Revenue Share (%), by Alcoholic Products 2024 & 2032
- Figure 42: Middle East & Africa NA Alcoholic Drinks Packaging Market Revenue (Million), by Product Type 2024 & 2032
- Figure 43: Middle East & Africa NA Alcoholic Drinks Packaging Market Revenue Share (%), by Product Type 2024 & 2032
- Figure 44: Middle East & Africa NA Alcoholic Drinks Packaging Market Revenue (Million), by Country 2024 & 2032
- Figure 45: Middle East & Africa NA Alcoholic Drinks Packaging Market Revenue Share (%), by Country 2024 & 2032
- Figure 46: Asia Pacific NA Alcoholic Drinks Packaging Market Revenue (Million), by Primary Material 2024 & 2032
- Figure 47: Asia Pacific NA Alcoholic Drinks Packaging Market Revenue Share (%), by Primary Material 2024 & 2032
- Figure 48: Asia Pacific NA Alcoholic Drinks Packaging Market Revenue (Million), by Alcoholic Products 2024 & 2032
- Figure 49: Asia Pacific NA Alcoholic Drinks Packaging Market Revenue Share (%), by Alcoholic Products 2024 & 2032
- Figure 50: Asia Pacific NA Alcoholic Drinks Packaging Market Revenue (Million), by Product Type 2024 & 2032
- Figure 51: Asia Pacific NA Alcoholic Drinks Packaging Market Revenue Share (%), by Product Type 2024 & 2032
- Figure 52: Asia Pacific NA Alcoholic Drinks Packaging Market Revenue (Million), by Country 2024 & 2032
- Figure 53: Asia Pacific NA Alcoholic Drinks Packaging Market Revenue Share (%), by Country 2024 & 2032
List of Tables
- Table 1: Global NA Alcoholic Drinks Packaging Market Revenue Million Forecast, by Region 2019 & 2032
- Table 2: Global NA Alcoholic Drinks Packaging Market Revenue Million Forecast, by Primary Material 2019 & 2032
- Table 3: Global NA Alcoholic Drinks Packaging Market Revenue Million Forecast, by Alcoholic Products 2019 & 2032
- Table 4: Global NA Alcoholic Drinks Packaging Market Revenue Million Forecast, by Product Type 2019 & 2032
- Table 5: Global NA Alcoholic Drinks Packaging Market Revenue Million Forecast, by Region 2019 & 2032
- Table 6: Global NA Alcoholic Drinks Packaging Market Revenue Million Forecast, by Country 2019 & 2032
- Table 7: United States NA Alcoholic Drinks Packaging Market Revenue (Million) Forecast, by Application 2019 & 2032
- Table 8: Canada NA Alcoholic Drinks Packaging Market Revenue (Million) Forecast, by Application 2019 & 2032
- Table 9: Global NA Alcoholic Drinks Packaging Market Revenue Million Forecast, by Country 2019 & 2032
- Table 10: United Kingdom NA Alcoholic Drinks Packaging Market Revenue (Million) Forecast, by Application 2019 & 2032
- Table 11: Germany NA Alcoholic Drinks Packaging Market Revenue (Million) Forecast, by Application 2019 & 2032
- Table 12: France NA Alcoholic Drinks Packaging Market Revenue (Million) Forecast, by Application 2019 & 2032
- Table 13: Spain NA Alcoholic Drinks Packaging Market Revenue (Million) Forecast, by Application 2019 & 2032
- Table 14: Rest of Europe NA Alcoholic Drinks Packaging Market Revenue (Million) Forecast, by Application 2019 & 2032
- Table 15: Global NA Alcoholic Drinks Packaging Market Revenue Million Forecast, by Country 2019 & 2032
- Table 16: China NA Alcoholic Drinks Packaging Market Revenue (Million) Forecast, by Application 2019 & 2032
- Table 17: India NA Alcoholic Drinks Packaging Market Revenue (Million) Forecast, by Application 2019 & 2032
- Table 18: Japan NA Alcoholic Drinks Packaging Market Revenue (Million) Forecast, by Application 2019 & 2032
- Table 19: South Korea NA Alcoholic Drinks Packaging Market Revenue (Million) Forecast, by Application 2019 & 2032
- Table 20: Rest of Asia Pacific NA Alcoholic Drinks Packaging Market Revenue (Million) Forecast, by Application 2019 & 2032
- Table 21: Global NA Alcoholic Drinks Packaging Market Revenue Million Forecast, by Country 2019 & 2032
- Table 22: Brazil NA Alcoholic Drinks Packaging Market Revenue (Million) Forecast, by Application 2019 & 2032
- Table 23: Mexico NA Alcoholic Drinks Packaging Market Revenue (Million) Forecast, by Application 2019 & 2032
- Table 24: Rest of Latin America NA Alcoholic Drinks Packaging Market Revenue (Million) Forecast, by Application 2019 & 2032
- Table 25: Global NA Alcoholic Drinks Packaging Market Revenue Million Forecast, by Country 2019 & 2032
- Table 26: Gulf Cooperation Council NA Alcoholic Drinks Packaging Market Revenue (Million) Forecast, by Application 2019 & 2032
- Table 27: Global NA Alcoholic Drinks Packaging Market Revenue Million Forecast, by Country 2019 & 2032
- Table 28: Nigeria NA Alcoholic Drinks Packaging Market Revenue (Million) Forecast, by Application 2019 & 2032
- Table 29: Kenya NA Alcoholic Drinks Packaging Market Revenue (Million) Forecast, by Application 2019 & 2032
- Table 30: South Africa NA Alcoholic Drinks Packaging Market Revenue (Million) Forecast, by Application 2019 & 2032
- Table 31: Turkey NA Alcoholic Drinks Packaging Market Revenue (Million) Forecast, by Application 2019 & 2032
- Table 32: Rest of Middle East NA Alcoholic Drinks Packaging Market Revenue (Million) Forecast, by Application 2019 & 2032
- Table 33: Global NA Alcoholic Drinks Packaging Market Revenue Million Forecast, by Primary Material 2019 & 2032
- Table 34: Global NA Alcoholic Drinks Packaging Market Revenue Million Forecast, by Alcoholic Products 2019 & 2032
- Table 35: Global NA Alcoholic Drinks Packaging Market Revenue Million Forecast, by Product Type 2019 & 2032
- Table 36: Global NA Alcoholic Drinks Packaging Market Revenue Million Forecast, by Country 2019 & 2032
- Table 37: United States NA Alcoholic Drinks Packaging Market Revenue (Million) Forecast, by Application 2019 & 2032
- Table 38: Canada NA Alcoholic Drinks Packaging Market Revenue (Million) Forecast, by Application 2019 & 2032
- Table 39: Mexico NA Alcoholic Drinks Packaging Market Revenue (Million) Forecast, by Application 2019 & 2032
- Table 40: Global NA Alcoholic Drinks Packaging Market Revenue Million Forecast, by Primary Material 2019 & 2032
- Table 41: Global NA Alcoholic Drinks Packaging Market Revenue Million Forecast, by Alcoholic Products 2019 & 2032
- Table 42: Global NA Alcoholic Drinks Packaging Market Revenue Million Forecast, by Product Type 2019 & 2032
- Table 43: Global NA Alcoholic Drinks Packaging Market Revenue Million Forecast, by Country 2019 & 2032
- Table 44: Brazil NA Alcoholic Drinks Packaging Market Revenue (Million) Forecast, by Application 2019 & 2032
- Table 45: Argentina NA Alcoholic Drinks Packaging Market Revenue (Million) Forecast, by Application 2019 & 2032
- Table 46: Rest of South America NA Alcoholic Drinks Packaging Market Revenue (Million) Forecast, by Application 2019 & 2032
- Table 47: Global NA Alcoholic Drinks Packaging Market Revenue Million Forecast, by Primary Material 2019 & 2032
- Table 48: Global NA Alcoholic Drinks Packaging Market Revenue Million Forecast, by Alcoholic Products 2019 & 2032
- Table 49: Global NA Alcoholic Drinks Packaging Market Revenue Million Forecast, by Product Type 2019 & 2032
- Table 50: Global NA Alcoholic Drinks Packaging Market Revenue Million Forecast, by Country 2019 & 2032
- Table 51: United Kingdom NA Alcoholic Drinks Packaging Market Revenue (Million) Forecast, by Application 2019 & 2032
- Table 52: Germany NA Alcoholic Drinks Packaging Market Revenue (Million) Forecast, by Application 2019 & 2032
- Table 53: France NA Alcoholic Drinks Packaging Market Revenue (Million) Forecast, by Application 2019 & 2032
- Table 54: Italy NA Alcoholic Drinks Packaging Market Revenue (Million) Forecast, by Application 2019 & 2032
- Table 55: Spain NA Alcoholic Drinks Packaging Market Revenue (Million) Forecast, by Application 2019 & 2032
- Table 56: Russia NA Alcoholic Drinks Packaging Market Revenue (Million) Forecast, by Application 2019 & 2032
- Table 57: Benelux NA Alcoholic Drinks Packaging Market Revenue (Million) Forecast, by Application 2019 & 2032
- Table 58: Nordics NA Alcoholic Drinks Packaging Market Revenue (Million) Forecast, by Application 2019 & 2032
- Table 59: Rest of Europe NA Alcoholic Drinks Packaging Market Revenue (Million) Forecast, by Application 2019 & 2032
- Table 60: Global NA Alcoholic Drinks Packaging Market Revenue Million Forecast, by Primary Material 2019 & 2032
- Table 61: Global NA Alcoholic Drinks Packaging Market Revenue Million Forecast, by Alcoholic Products 2019 & 2032
- Table 62: Global NA Alcoholic Drinks Packaging Market Revenue Million Forecast, by Product Type 2019 & 2032
- Table 63: Global NA Alcoholic Drinks Packaging Market Revenue Million Forecast, by Country 2019 & 2032
- Table 64: Turkey NA Alcoholic Drinks Packaging Market Revenue (Million) Forecast, by Application 2019 & 2032
- Table 65: Israel NA Alcoholic Drinks Packaging Market Revenue (Million) Forecast, by Application 2019 & 2032
- Table 66: GCC NA Alcoholic Drinks Packaging Market Revenue (Million) Forecast, by Application 2019 & 2032
- Table 67: North Africa NA Alcoholic Drinks Packaging Market Revenue (Million) Forecast, by Application 2019 & 2032
- Table 68: South Africa NA Alcoholic Drinks Packaging Market Revenue (Million) Forecast, by Application 2019 & 2032
- Table 69: Rest of Middle East & Africa NA Alcoholic Drinks Packaging Market Revenue (Million) Forecast, by Application 2019 & 2032
- Table 70: Global NA Alcoholic Drinks Packaging Market Revenue Million Forecast, by Primary Material 2019 & 2032
- Table 71: Global NA Alcoholic Drinks Packaging Market Revenue Million Forecast, by Alcoholic Products 2019 & 2032
- Table 72: Global NA Alcoholic Drinks Packaging Market Revenue Million Forecast, by Product Type 2019 & 2032
- Table 73: Global NA Alcoholic Drinks Packaging Market Revenue Million Forecast, by Country 2019 & 2032
- Table 74: China NA Alcoholic Drinks Packaging Market Revenue (Million) Forecast, by Application 2019 & 2032
- Table 75: India NA Alcoholic Drinks Packaging Market Revenue (Million) Forecast, by Application 2019 & 2032
- Table 76: Japan NA Alcoholic Drinks Packaging Market Revenue (Million) Forecast, by Application 2019 & 2032
- Table 77: South Korea NA Alcoholic Drinks Packaging Market Revenue (Million) Forecast, by Application 2019 & 2032
- Table 78: ASEAN NA Alcoholic Drinks Packaging Market Revenue (Million) Forecast, by Application 2019 & 2032
- Table 79: Oceania NA Alcoholic Drinks Packaging Market Revenue (Million) Forecast, by Application 2019 & 2032
- Table 80: Rest of Asia Pacific NA Alcoholic Drinks Packaging Market Revenue (Million) Forecast, by Application 2019 & 2032
Frequently Asked Questions
1. What is the projected Compound Annual Growth Rate (CAGR) of the NA Alcoholic Drinks Packaging Market?
The projected CAGR is approximately 5.50%.
2. Which companies are prominent players in the NA Alcoholic Drinks Packaging Market?
Key companies in the market include Encore Glass, United Bottles & Packaging, WestRock LLC, Ball Corporation, Owens-Illinois (O-I) Inc, Ardagh Group SA, Crown Holdings Incorporated, Berry Global Inc, IntraPac International LL, Brick Packaging LLC, Amcor Ltd.
3. What are the main segments of the NA Alcoholic Drinks Packaging Market?
The market segments include Primary Material, Alcoholic Products, Product Type.
4. Can you provide details about the market size?
The market size is estimated to be USD XX Million as of 2022.
5. What are some drivers contributing to market growth?
High Purchasing Power of Consumers; Increasing Consumption of Alcoholic Drinks.
6. What are the notable trends driving market growth?
Wine Consumption is expected to Grow Significantly.
7. Are there any restraints impacting market growth?
Stringent Government Regulations Regarding Environmental Safety; Lack Of Improvement In Technology To Hinder The Growth.
8. Can you provide examples of recent developments in the market?
March 2021 - Owens-Illinois (O-I), Inc., made a significant investment to support strong customer demand for highly sustainable glass packaging. O-I will invest approximately USD 75 million in an expansion at its Zipaquirá, Colombia facility. Upon completion by the end of 2022, the project is expected to add nearly 2% capacity to the company's Americas segment and produce about 500 million bottles annually.
9. What pricing options are available for accessing the report?
Pricing options include single-user, multi-user, and enterprise licenses priced at USD 4750, USD 4950, and USD 6800 respectively.
10. Is the market size provided in terms of value or volume?
The market size is provided in terms of value, measured in Million.
11. Are there any specific market keywords associated with the report?
Yes, the market keyword associated with the report is "NA Alcoholic Drinks Packaging Market," which aids in identifying and referencing the specific market segment covered.
12. How do I determine which pricing option suits my needs best?
The pricing options vary based on user requirements and access needs. Individual users may opt for single-user licenses, while businesses requiring broader access may choose multi-user or enterprise licenses for cost-effective access to the report.
13. Are there any additional resources or data provided in the NA Alcoholic Drinks Packaging Market report?
While the report offers comprehensive insights, it's advisable to review the specific contents or supplementary materials provided to ascertain if additional resources or data are available.
14. How can I stay updated on further developments or reports in the NA Alcoholic Drinks Packaging Market?
To stay informed about further developments, trends, and reports in the NA Alcoholic Drinks Packaging Market, consider subscribing to industry newsletters, following relevant companies and organizations, or regularly checking reputable industry news sources and publications.
Methodology
Step 1 - Identification of Relevant Samples Size from Population Database


Step 2 - Approaches for Defining Global Market Size (Value, Volume* & Price*)

Note*: In applicable scenarios
Step 3 - Data Sources
Primary Research
- Web Analytics
- Survey Reports
- Research Institute
- Latest Research Reports
- Opinion Leaders
Secondary Research
- Annual Reports
- White Paper
- Latest Press Release
- Industry Association
- Paid Database
- Investor Presentations

Step 4 - Data Triangulation
Involves using different sources of information in order to increase the validity of a study
These sources are likely to be stakeholders in a program - participants, other researchers, program staff, other community members, and so on.
Then we put all data in single framework & apply various statistical tools to find out the dynamic on the market.
During the analysis stage, feedback from the stakeholder groups would be compared to determine areas of agreement as well as areas of divergence
