

Key Insights
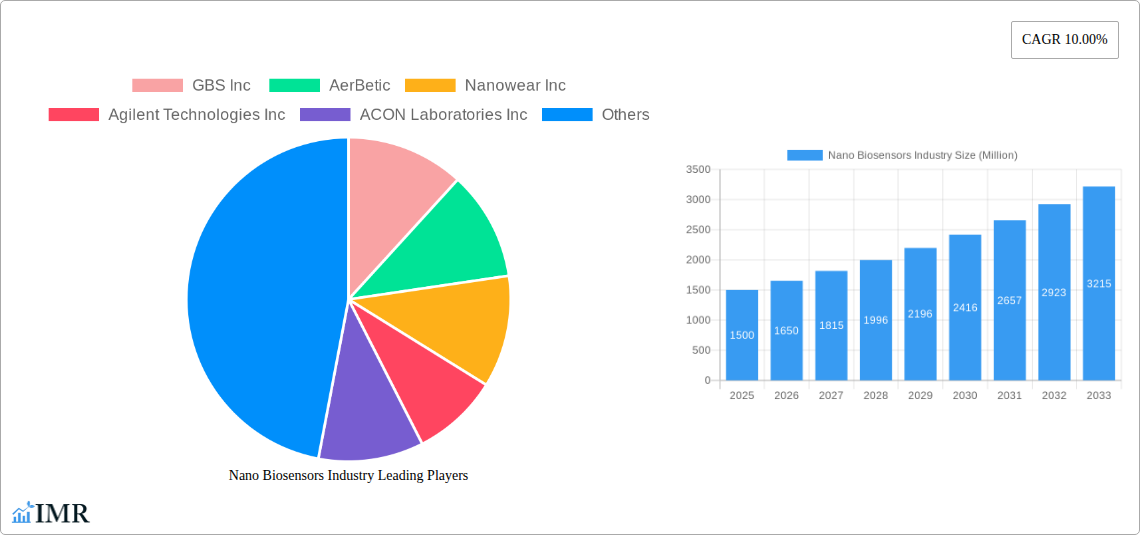
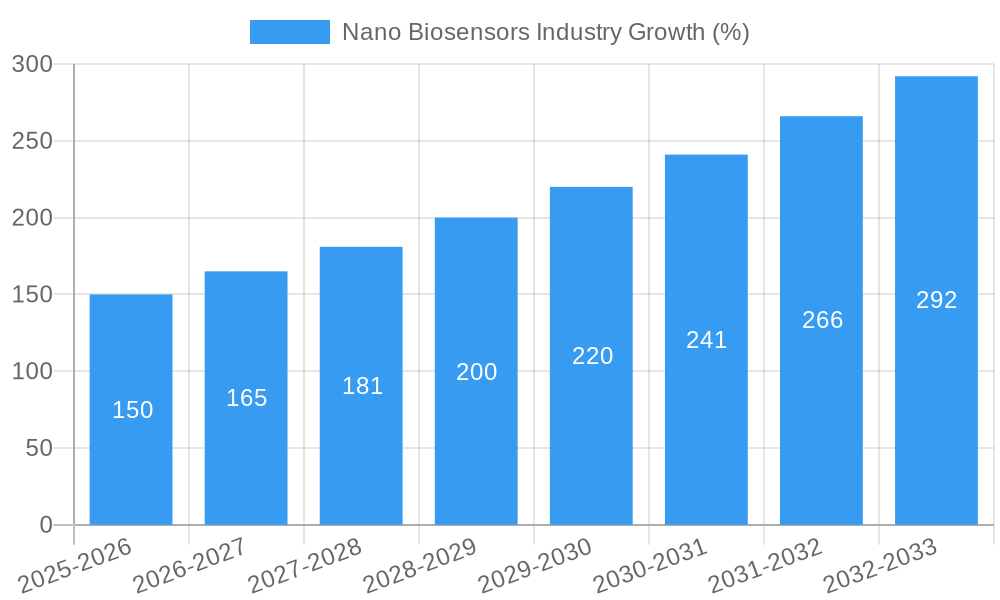
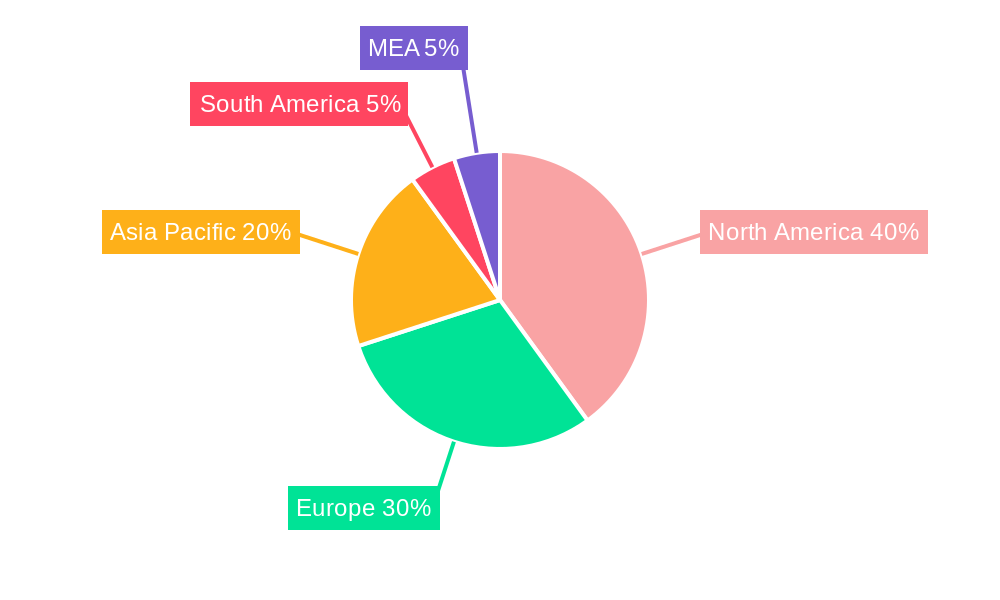
The nano biosensors market is experiencing robust growth, projected to reach a significant size by 2033. A compound annual growth rate (CAGR) of 10% from 2025 to 2033 signifies substantial market expansion driven by several key factors. Advancements in nanotechnology are enabling the development of highly sensitive and specific biosensors for diverse applications. The increasing prevalence of chronic diseases is fueling demand for point-of-care diagnostics and personalized medicine, significantly boosting the healthcare sector's contribution to market growth. Furthermore, the food and beverage industry's increasing focus on food safety and quality control is driving adoption of nano biosensors for rapid pathogen detection and contaminant analysis. Stringent regulatory requirements and the high initial investment costs associated with developing and deploying nano biosensors present challenges to market expansion. However, ongoing technological advancements and decreasing manufacturing costs are likely to mitigate these constraints over the forecast period. The market is segmented by sensor type (optical, electrochemical, acoustic, and others) and end-user vertical (healthcare, food and beverage, and others). Key players such as GBS Inc, AerBetic, Nanowear Inc, Agilent Technologies Inc, and others are actively involved in developing innovative nano biosensor technologies and expanding their market presence through strategic partnerships and acquisitions. The North American market currently holds a significant share, driven by robust technological advancements and high healthcare spending, but the Asia-Pacific region is expected to witness the fastest growth due to increasing investments in healthcare infrastructure and rising awareness of advanced diagnostic tools.
The competitive landscape is characterized by both established players and emerging companies. Established players leverage their extensive research capabilities and distribution networks to maintain market leadership. Emerging companies, on the other hand, are focusing on developing niche technologies and entering strategic partnerships to gain market share. The market's future trajectory depends heavily on continued technological innovations leading to improved sensor sensitivity, reduced costs, and expanded applications. Regulatory approval processes and consumer acceptance will also play critical roles in shaping market growth in the coming years. The market will continue to evolve, with advancements likely to focus on improved integration with existing healthcare systems, enhanced data analytics capabilities, and development of portable and user-friendly devices.
Nano Biosensors Industry Market Report: 2019-2033
This comprehensive report provides an in-depth analysis of the Nano Biosensors industry, encompassing market dynamics, growth trends, regional dominance, product landscape, and key players. The study period covers 2019-2033, with a base year of 2025 and a forecast period of 2025-2033. The report leverages extensive market research and data analysis to offer valuable insights for industry professionals, investors, and stakeholders. This report focuses on the parent market of biosensors and the child market of nano biosensors, providing a granular view of this rapidly evolving sector.
Nano Biosensors Industry Market Dynamics & Structure
The nano biosensors market is characterized by a moderately fragmented landscape, with several key players competing alongside emerging startups. Technological innovation, particularly in materials science and nanotechnology, is a primary driver of growth. Stringent regulatory frameworks, especially in healthcare, influence product development and market access. Competitive substitutes, such as traditional biosensors, exert pressure on market share. The end-user demographics are diverse, spanning healthcare, food & beverage, and environmental monitoring. Mergers and acquisitions (M&A) activity is expected to increase, driven by the need for expansion and technological integration.
- Market Concentration: Moderately Fragmented (xx% market share held by top 5 players in 2025)
- Technological Innovation: Significant advancements in nanomaterials, miniaturization, and sensing technologies.
- Regulatory Framework: Stringent regulations (e.g., FDA approvals) in healthcare, impacting time-to-market.
- Competitive Substitutes: Traditional biosensors pose a competitive threat, offering lower costs in some applications.
- End-User Demographics: Primarily healthcare (xx%), followed by food & beverage (xx%) and other end-use verticals (xx%).
- M&A Trends: An increasing number of strategic acquisitions are predicted in the forecast period (xx deals projected between 2025 and 2033).
Nano Biosensors Industry Growth Trends & Insights
The global nano biosensors market is experiencing substantial growth, driven by increasing demand for point-of-care diagnostics, early disease detection, and food safety monitoring. Technological advancements, such as the development of highly sensitive and specific nanosensors, are accelerating market adoption. The market is witnessing a shift towards personalized medicine and remote patient monitoring, fueling the demand for miniaturized and portable nano biosensors. The integration of nanotechnology with artificial intelligence (AI) and machine learning (ML) further enhances the diagnostic capabilities and analytical precision of these devices. The market is projected to witness a Compound Annual Growth Rate (CAGR) of xx% from 2025 to 2033, reaching a market size of xx million by 2033. Market penetration is expected to increase significantly, particularly in developing economies.
Dominant Regions, Countries, or Segments in Nano Biosensors Industry
North America currently holds the largest market share in the nano biosensors industry, driven by robust healthcare infrastructure, substantial R&D investments, and early adoption of advanced technologies. However, Asia-Pacific is projected to witness the fastest growth, fueled by expanding healthcare spending and increasing prevalence of chronic diseases. Within the segment analysis, the healthcare sector dominates, followed by the food and beverage industry. The Optical Sensor segment holds a significant market share, while Electrochemical sensors showcase substantial growth potential.
- Key Drivers in North America: Strong regulatory support, high healthcare expenditure, and advanced research infrastructure.
- Key Drivers in Asia-Pacific: Rapidly growing healthcare sector, increasing prevalence of chronic diseases, and cost-effective manufacturing capabilities.
- Dominant Segment (Type): Optical Sensors (xx% market share in 2025) due to high sensitivity and versatility.
- Dominant Segment (End-user): Healthcare (xx% market share in 2025) due to extensive applications in diagnostics and therapeutics.
Nano Biosensors Industry Product Landscape
Nano biosensors are characterized by their miniaturized size, enhanced sensitivity, and high specificity. They leverage various nanomaterials, such as nanoparticles, nanotubes, and nanowires, to detect and quantify biological molecules with exceptional accuracy. Applications span disease diagnostics, environmental monitoring, food safety, and drug discovery. The unique selling propositions include rapid detection, portability, cost-effectiveness, and the ability to integrate with other technologies (e.g., microfluidics). Continuous advancements are focusing on improving sensitivity, selectivity, and real-time monitoring capabilities.
Key Drivers, Barriers & Challenges in Nano Biosensors Industry
Key Drivers:
- Increasing prevalence of chronic diseases and the need for early diagnosis.
- Technological advancements in nanomaterials and sensing techniques.
- Growing demand for point-of-care diagnostics and personalized medicine.
- Government funding and initiatives supporting nanotechnology research.
Challenges & Restraints:
- High initial investment costs associated with the development and manufacturing of nano biosensors.
- Stringent regulatory approvals and compliance requirements, particularly in healthcare.
- Potential toxicity and biocompatibility issues associated with certain nanomaterials.
- Competition from established biosensor technologies.
Emerging Opportunities in Nano Biosensors Industry
The nano biosensors market presents several compelling opportunities. These include the development of novel diagnostic tools for infectious diseases, early cancer detection, and personalized cancer therapies. Expansion into emerging markets, such as Africa and South America, presents substantial growth potential. Further integration of nano biosensors with wearable technology and remote monitoring systems promises to revolutionize healthcare delivery.
Growth Accelerators in the Nano Biosensors Industry
Long-term growth in the nano biosensors industry will be driven by continuous technological advancements, strategic collaborations between academia, industry, and research institutions, and expansion into new application areas. The development of highly sensitive, specific, and cost-effective nano biosensors, coupled with supportive government policies, will further accelerate market growth.
Key Players Shaping the Nano Biosensors Industry Market
- GBS Inc
- AerBetic
- Nanowear Inc
- Agilent Technologies Inc
- ACON Laboratories Inc
- Instant NanoBiosensors Co Ltd
- Vista Therapeutics Inc
- Abbott Point of Care Inc
- Bruker Corporation
- LamdaGen Corporation
Notable Milestones in Nano Biosensors Industry Sector
- 2021: FDA approval of a novel nano biosensor for rapid detection of influenza virus.
- 2022: Strategic partnership between GBS Inc and Nanowear Inc for development of next-generation wearable sensors.
- 2023: Launch of a new electrochemical nano biosensor for early detection of colorectal cancer by ACON Laboratories Inc.
- 2024: Acquisition of a startup specializing in acoustic nano biosensors by Agilent Technologies Inc.
In-Depth Nano Biosensors Industry Market Outlook
The nano biosensors industry is poised for significant growth in the coming years, driven by technological advancements, expanding applications, and increasing investments. The focus on developing highly sensitive, specific, and cost-effective devices will play a crucial role in market expansion. Strategic partnerships, collaborations, and M&A activities are expected to further accelerate market growth and create opportunities for innovation and market leadership. The future holds immense potential for nano biosensors to transform healthcare, environmental monitoring, food safety, and other sectors.
Nano Biosensors Industry Segmentation
-
1. Type (Qualitative Analysis)
- 1.1. Optical Sensor
- 1.2. Electrochemical Sensor
- 1.3. Acoustic Sensor
- 1.4. Other Types
-
2. End-user Vertical
- 2.1. Healthcare
- 2.2. Food & Beverage
- 2.3. Other End-use Verticals
Nano Biosensors Industry Segmentation By Geography
- 1. North America
- 2. Europe
- 3. Asia Pacific
- 4. Rest of the World
Nano Biosensors Industry REPORT HIGHLIGHTS
| Aspects | Details |
|---|---|
| Study Period | 2019-2033 |
| Base Year | 2024 |
| Estimated Year | 2025 |
| Forecast Period | 2025-2033 |
| Historical Period | 2019-2024 |
| Growth Rate | CAGR of 10.00% from 2019-2033 |
| Segmentation |
|
Table of Contents
- 1. Introduction
- 1.1. Research Scope
- 1.2. Market Segmentation
- 1.3. Research Methodology
- 1.4. Definitions and Assumptions
- 2. Executive Summary
- 2.1. Introduction
- 3. Market Dynamics
- 3.1. Introduction
- 3.2. Market Drivers
- 3.2.1. ; Rise of Miniaturization Trend
- 3.3. Market Restrains
- 3.3.1. Operational Challenges Involving Cross-border Payments
- 3.4. Market Trends
- 3.4.1. Healthcare Industry Holds the Significant Share in the Market
- 4. Market Factor Analysis
- 4.1. Porters Five Forces
- 4.2. Supply/Value Chain
- 4.3. PESTEL analysis
- 4.4. Market Entropy
- 4.5. Patent/Trademark Analysis
- 5. Global Nano Biosensors Industry Analysis, Insights and Forecast, 2019-2031
- 5.1. Market Analysis, Insights and Forecast - by Type (Qualitative Analysis)
- 5.1.1. Optical Sensor
- 5.1.2. Electrochemical Sensor
- 5.1.3. Acoustic Sensor
- 5.1.4. Other Types
- 5.2. Market Analysis, Insights and Forecast - by End-user Vertical
- 5.2.1. Healthcare
- 5.2.2. Food & Beverage
- 5.2.3. Other End-use Verticals
- 5.3. Market Analysis, Insights and Forecast - by Region
- 5.3.1. North America
- 5.3.2. Europe
- 5.3.3. Asia Pacific
- 5.3.4. Rest of the World
- 5.1. Market Analysis, Insights and Forecast - by Type (Qualitative Analysis)
- 6. North America Nano Biosensors Industry Analysis, Insights and Forecast, 2019-2031
- 6.1. Market Analysis, Insights and Forecast - by Type (Qualitative Analysis)
- 6.1.1. Optical Sensor
- 6.1.2. Electrochemical Sensor
- 6.1.3. Acoustic Sensor
- 6.1.4. Other Types
- 6.2. Market Analysis, Insights and Forecast - by End-user Vertical
- 6.2.1. Healthcare
- 6.2.2. Food & Beverage
- 6.2.3. Other End-use Verticals
- 6.1. Market Analysis, Insights and Forecast - by Type (Qualitative Analysis)
- 7. Europe Nano Biosensors Industry Analysis, Insights and Forecast, 2019-2031
- 7.1. Market Analysis, Insights and Forecast - by Type (Qualitative Analysis)
- 7.1.1. Optical Sensor
- 7.1.2. Electrochemical Sensor
- 7.1.3. Acoustic Sensor
- 7.1.4. Other Types
- 7.2. Market Analysis, Insights and Forecast - by End-user Vertical
- 7.2.1. Healthcare
- 7.2.2. Food & Beverage
- 7.2.3. Other End-use Verticals
- 7.1. Market Analysis, Insights and Forecast - by Type (Qualitative Analysis)
- 8. Asia Pacific Nano Biosensors Industry Analysis, Insights and Forecast, 2019-2031
- 8.1. Market Analysis, Insights and Forecast - by Type (Qualitative Analysis)
- 8.1.1. Optical Sensor
- 8.1.2. Electrochemical Sensor
- 8.1.3. Acoustic Sensor
- 8.1.4. Other Types
- 8.2. Market Analysis, Insights and Forecast - by End-user Vertical
- 8.2.1. Healthcare
- 8.2.2. Food & Beverage
- 8.2.3. Other End-use Verticals
- 8.1. Market Analysis, Insights and Forecast - by Type (Qualitative Analysis)
- 9. Rest of the World Nano Biosensors Industry Analysis, Insights and Forecast, 2019-2031
- 9.1. Market Analysis, Insights and Forecast - by Type (Qualitative Analysis)
- 9.1.1. Optical Sensor
- 9.1.2. Electrochemical Sensor
- 9.1.3. Acoustic Sensor
- 9.1.4. Other Types
- 9.2. Market Analysis, Insights and Forecast - by End-user Vertical
- 9.2.1. Healthcare
- 9.2.2. Food & Beverage
- 9.2.3. Other End-use Verticals
- 9.1. Market Analysis, Insights and Forecast - by Type (Qualitative Analysis)
- 10. North America Nano Biosensors Industry Analysis, Insights and Forecast, 2019-2031
- 10.1. Market Analysis, Insights and Forecast - By Country/Sub-region
- 10.1.1. undefined
- 11. Europe Nano Biosensors Industry Analysis, Insights and Forecast, 2019-2031
- 11.1. Market Analysis, Insights and Forecast - By Country/Sub-region
- 11.1.1. undefined
- 12. Asia Pacific Nano Biosensors Industry Analysis, Insights and Forecast, 2019-2031
- 12.1. Market Analysis, Insights and Forecast - By Country/Sub-region
- 12.1.1. undefined
- 13. South America Nano Biosensors Industry Analysis, Insights and Forecast, 2019-2031
- 13.1. Market Analysis, Insights and Forecast - By Country/Sub-region
- 13.1.1. undefined
- 14. North America Nano Biosensors Industry Analysis, Insights and Forecast, 2019-2031
- 14.1. Market Analysis, Insights and Forecast - By Country/Sub-region
- 14.1.1. undefined
- 15. MEA Nano Biosensors Industry Analysis, Insights and Forecast, 2019-2031
- 15.1. Market Analysis, Insights and Forecast - By Country/Sub-region
- 15.1.1. undefined
- 16. Competitive Analysis
- 16.1. Global Market Share Analysis 2024
- 16.2. Company Profiles
- 16.2.1 GBS Inc
- 16.2.1.1. Overview
- 16.2.1.2. Products
- 16.2.1.3. SWOT Analysis
- 16.2.1.4. Recent Developments
- 16.2.1.5. Financials (Based on Availability)
- 16.2.2 AerBetic
- 16.2.2.1. Overview
- 16.2.2.2. Products
- 16.2.2.3. SWOT Analysis
- 16.2.2.4. Recent Developments
- 16.2.2.5. Financials (Based on Availability)
- 16.2.3 Nanowear Inc
- 16.2.3.1. Overview
- 16.2.3.2. Products
- 16.2.3.3. SWOT Analysis
- 16.2.3.4. Recent Developments
- 16.2.3.5. Financials (Based on Availability)
- 16.2.4 Agilent Technologies Inc
- 16.2.4.1. Overview
- 16.2.4.2. Products
- 16.2.4.3. SWOT Analysis
- 16.2.4.4. Recent Developments
- 16.2.4.5. Financials (Based on Availability)
- 16.2.5 ACON Laboratories Inc
- 16.2.5.1. Overview
- 16.2.5.2. Products
- 16.2.5.3. SWOT Analysis
- 16.2.5.4. Recent Developments
- 16.2.5.5. Financials (Based on Availability)
- 16.2.6 Instant NanoBiosensors Co Ltd
- 16.2.6.1. Overview
- 16.2.6.2. Products
- 16.2.6.3. SWOT Analysis
- 16.2.6.4. Recent Developments
- 16.2.6.5. Financials (Based on Availability)
- 16.2.7 Vista Therapeutics Inc
- 16.2.7.1. Overview
- 16.2.7.2. Products
- 16.2.7.3. SWOT Analysis
- 16.2.7.4. Recent Developments
- 16.2.7.5. Financials (Based on Availability)
- 16.2.8 Abbott Point of Care Inc
- 16.2.8.1. Overview
- 16.2.8.2. Products
- 16.2.8.3. SWOT Analysis
- 16.2.8.4. Recent Developments
- 16.2.8.5. Financials (Based on Availability)
- 16.2.9 Bruker Corporation
- 16.2.9.1. Overview
- 16.2.9.2. Products
- 16.2.9.3. SWOT Analysis
- 16.2.9.4. Recent Developments
- 16.2.9.5. Financials (Based on Availability)
- 16.2.10 LamdaGen Corporation
- 16.2.10.1. Overview
- 16.2.10.2. Products
- 16.2.10.3. SWOT Analysis
- 16.2.10.4. Recent Developments
- 16.2.10.5. Financials (Based on Availability)
- 16.2.1 GBS Inc
List of Figures
- Figure 1: Global Nano Biosensors Industry Revenue Breakdown (Million, %) by Region 2024 & 2032
- Figure 2: Global Nano Biosensors Industry Volume Breakdown (K Unit, %) by Region 2024 & 2032
- Figure 3: North America Nano Biosensors Industry Revenue (Million), by Country 2024 & 2032
- Figure 4: North America Nano Biosensors Industry Volume (K Unit), by Country 2024 & 2032
- Figure 5: North America Nano Biosensors Industry Revenue Share (%), by Country 2024 & 2032
- Figure 6: North America Nano Biosensors Industry Volume Share (%), by Country 2024 & 2032
- Figure 7: Europe Nano Biosensors Industry Revenue (Million), by Country 2024 & 2032
- Figure 8: Europe Nano Biosensors Industry Volume (K Unit), by Country 2024 & 2032
- Figure 9: Europe Nano Biosensors Industry Revenue Share (%), by Country 2024 & 2032
- Figure 10: Europe Nano Biosensors Industry Volume Share (%), by Country 2024 & 2032
- Figure 11: Asia Pacific Nano Biosensors Industry Revenue (Million), by Country 2024 & 2032
- Figure 12: Asia Pacific Nano Biosensors Industry Volume (K Unit), by Country 2024 & 2032
- Figure 13: Asia Pacific Nano Biosensors Industry Revenue Share (%), by Country 2024 & 2032
- Figure 14: Asia Pacific Nano Biosensors Industry Volume Share (%), by Country 2024 & 2032
- Figure 15: South America Nano Biosensors Industry Revenue (Million), by Country 2024 & 2032
- Figure 16: South America Nano Biosensors Industry Volume (K Unit), by Country 2024 & 2032
- Figure 17: South America Nano Biosensors Industry Revenue Share (%), by Country 2024 & 2032
- Figure 18: South America Nano Biosensors Industry Volume Share (%), by Country 2024 & 2032
- Figure 19: North America Nano Biosensors Industry Revenue (Million), by Country 2024 & 2032
- Figure 20: North America Nano Biosensors Industry Volume (K Unit), by Country 2024 & 2032
- Figure 21: North America Nano Biosensors Industry Revenue Share (%), by Country 2024 & 2032
- Figure 22: North America Nano Biosensors Industry Volume Share (%), by Country 2024 & 2032
- Figure 23: MEA Nano Biosensors Industry Revenue (Million), by Country 2024 & 2032
- Figure 24: MEA Nano Biosensors Industry Volume (K Unit), by Country 2024 & 2032
- Figure 25: MEA Nano Biosensors Industry Revenue Share (%), by Country 2024 & 2032
- Figure 26: MEA Nano Biosensors Industry Volume Share (%), by Country 2024 & 2032
- Figure 27: North America Nano Biosensors Industry Revenue (Million), by Type (Qualitative Analysis) 2024 & 2032
- Figure 28: North America Nano Biosensors Industry Volume (K Unit), by Type (Qualitative Analysis) 2024 & 2032
- Figure 29: North America Nano Biosensors Industry Revenue Share (%), by Type (Qualitative Analysis) 2024 & 2032
- Figure 30: North America Nano Biosensors Industry Volume Share (%), by Type (Qualitative Analysis) 2024 & 2032
- Figure 31: North America Nano Biosensors Industry Revenue (Million), by End-user Vertical 2024 & 2032
- Figure 32: North America Nano Biosensors Industry Volume (K Unit), by End-user Vertical 2024 & 2032
- Figure 33: North America Nano Biosensors Industry Revenue Share (%), by End-user Vertical 2024 & 2032
- Figure 34: North America Nano Biosensors Industry Volume Share (%), by End-user Vertical 2024 & 2032
- Figure 35: North America Nano Biosensors Industry Revenue (Million), by Country 2024 & 2032
- Figure 36: North America Nano Biosensors Industry Volume (K Unit), by Country 2024 & 2032
- Figure 37: North America Nano Biosensors Industry Revenue Share (%), by Country 2024 & 2032
- Figure 38: North America Nano Biosensors Industry Volume Share (%), by Country 2024 & 2032
- Figure 39: Europe Nano Biosensors Industry Revenue (Million), by Type (Qualitative Analysis) 2024 & 2032
- Figure 40: Europe Nano Biosensors Industry Volume (K Unit), by Type (Qualitative Analysis) 2024 & 2032
- Figure 41: Europe Nano Biosensors Industry Revenue Share (%), by Type (Qualitative Analysis) 2024 & 2032
- Figure 42: Europe Nano Biosensors Industry Volume Share (%), by Type (Qualitative Analysis) 2024 & 2032
- Figure 43: Europe Nano Biosensors Industry Revenue (Million), by End-user Vertical 2024 & 2032
- Figure 44: Europe Nano Biosensors Industry Volume (K Unit), by End-user Vertical 2024 & 2032
- Figure 45: Europe Nano Biosensors Industry Revenue Share (%), by End-user Vertical 2024 & 2032
- Figure 46: Europe Nano Biosensors Industry Volume Share (%), by End-user Vertical 2024 & 2032
- Figure 47: Europe Nano Biosensors Industry Revenue (Million), by Country 2024 & 2032
- Figure 48: Europe Nano Biosensors Industry Volume (K Unit), by Country 2024 & 2032
- Figure 49: Europe Nano Biosensors Industry Revenue Share (%), by Country 2024 & 2032
- Figure 50: Europe Nano Biosensors Industry Volume Share (%), by Country 2024 & 2032
- Figure 51: Asia Pacific Nano Biosensors Industry Revenue (Million), by Type (Qualitative Analysis) 2024 & 2032
- Figure 52: Asia Pacific Nano Biosensors Industry Volume (K Unit), by Type (Qualitative Analysis) 2024 & 2032
- Figure 53: Asia Pacific Nano Biosensors Industry Revenue Share (%), by Type (Qualitative Analysis) 2024 & 2032
- Figure 54: Asia Pacific Nano Biosensors Industry Volume Share (%), by Type (Qualitative Analysis) 2024 & 2032
- Figure 55: Asia Pacific Nano Biosensors Industry Revenue (Million), by End-user Vertical 2024 & 2032
- Figure 56: Asia Pacific Nano Biosensors Industry Volume (K Unit), by End-user Vertical 2024 & 2032
- Figure 57: Asia Pacific Nano Biosensors Industry Revenue Share (%), by End-user Vertical 2024 & 2032
- Figure 58: Asia Pacific Nano Biosensors Industry Volume Share (%), by End-user Vertical 2024 & 2032
- Figure 59: Asia Pacific Nano Biosensors Industry Revenue (Million), by Country 2024 & 2032
- Figure 60: Asia Pacific Nano Biosensors Industry Volume (K Unit), by Country 2024 & 2032
- Figure 61: Asia Pacific Nano Biosensors Industry Revenue Share (%), by Country 2024 & 2032
- Figure 62: Asia Pacific Nano Biosensors Industry Volume Share (%), by Country 2024 & 2032
- Figure 63: Rest of the World Nano Biosensors Industry Revenue (Million), by Type (Qualitative Analysis) 2024 & 2032
- Figure 64: Rest of the World Nano Biosensors Industry Volume (K Unit), by Type (Qualitative Analysis) 2024 & 2032
- Figure 65: Rest of the World Nano Biosensors Industry Revenue Share (%), by Type (Qualitative Analysis) 2024 & 2032
- Figure 66: Rest of the World Nano Biosensors Industry Volume Share (%), by Type (Qualitative Analysis) 2024 & 2032
- Figure 67: Rest of the World Nano Biosensors Industry Revenue (Million), by End-user Vertical 2024 & 2032
- Figure 68: Rest of the World Nano Biosensors Industry Volume (K Unit), by End-user Vertical 2024 & 2032
- Figure 69: Rest of the World Nano Biosensors Industry Revenue Share (%), by End-user Vertical 2024 & 2032
- Figure 70: Rest of the World Nano Biosensors Industry Volume Share (%), by End-user Vertical 2024 & 2032
- Figure 71: Rest of the World Nano Biosensors Industry Revenue (Million), by Country 2024 & 2032
- Figure 72: Rest of the World Nano Biosensors Industry Volume (K Unit), by Country 2024 & 2032
- Figure 73: Rest of the World Nano Biosensors Industry Revenue Share (%), by Country 2024 & 2032
- Figure 74: Rest of the World Nano Biosensors Industry Volume Share (%), by Country 2024 & 2032
List of Tables
- Table 1: Global Nano Biosensors Industry Revenue Million Forecast, by Region 2019 & 2032
- Table 2: Global Nano Biosensors Industry Volume K Unit Forecast, by Region 2019 & 2032
- Table 3: Global Nano Biosensors Industry Revenue Million Forecast, by Type (Qualitative Analysis) 2019 & 2032
- Table 4: Global Nano Biosensors Industry Volume K Unit Forecast, by Type (Qualitative Analysis) 2019 & 2032
- Table 5: Global Nano Biosensors Industry Revenue Million Forecast, by End-user Vertical 2019 & 2032
- Table 6: Global Nano Biosensors Industry Volume K Unit Forecast, by End-user Vertical 2019 & 2032
- Table 7: Global Nano Biosensors Industry Revenue Million Forecast, by Region 2019 & 2032
- Table 8: Global Nano Biosensors Industry Volume K Unit Forecast, by Region 2019 & 2032
- Table 9: Global Nano Biosensors Industry Revenue Million Forecast, by Country 2019 & 2032
- Table 10: Global Nano Biosensors Industry Volume K Unit Forecast, by Country 2019 & 2032
- Table 11: Global Nano Biosensors Industry Revenue Million Forecast, by Country 2019 & 2032
- Table 12: Global Nano Biosensors Industry Volume K Unit Forecast, by Country 2019 & 2032
- Table 13: Global Nano Biosensors Industry Revenue Million Forecast, by Country 2019 & 2032
- Table 14: Global Nano Biosensors Industry Volume K Unit Forecast, by Country 2019 & 2032
- Table 15: Global Nano Biosensors Industry Revenue Million Forecast, by Country 2019 & 2032
- Table 16: Global Nano Biosensors Industry Volume K Unit Forecast, by Country 2019 & 2032
- Table 17: Global Nano Biosensors Industry Revenue Million Forecast, by Country 2019 & 2032
- Table 18: Global Nano Biosensors Industry Volume K Unit Forecast, by Country 2019 & 2032
- Table 19: Global Nano Biosensors Industry Revenue Million Forecast, by Country 2019 & 2032
- Table 20: Global Nano Biosensors Industry Volume K Unit Forecast, by Country 2019 & 2032
- Table 21: Global Nano Biosensors Industry Revenue Million Forecast, by Type (Qualitative Analysis) 2019 & 2032
- Table 22: Global Nano Biosensors Industry Volume K Unit Forecast, by Type (Qualitative Analysis) 2019 & 2032
- Table 23: Global Nano Biosensors Industry Revenue Million Forecast, by End-user Vertical 2019 & 2032
- Table 24: Global Nano Biosensors Industry Volume K Unit Forecast, by End-user Vertical 2019 & 2032
- Table 25: Global Nano Biosensors Industry Revenue Million Forecast, by Country 2019 & 2032
- Table 26: Global Nano Biosensors Industry Volume K Unit Forecast, by Country 2019 & 2032
- Table 27: Global Nano Biosensors Industry Revenue Million Forecast, by Type (Qualitative Analysis) 2019 & 2032
- Table 28: Global Nano Biosensors Industry Volume K Unit Forecast, by Type (Qualitative Analysis) 2019 & 2032
- Table 29: Global Nano Biosensors Industry Revenue Million Forecast, by End-user Vertical 2019 & 2032
- Table 30: Global Nano Biosensors Industry Volume K Unit Forecast, by End-user Vertical 2019 & 2032
- Table 31: Global Nano Biosensors Industry Revenue Million Forecast, by Country 2019 & 2032
- Table 32: Global Nano Biosensors Industry Volume K Unit Forecast, by Country 2019 & 2032
- Table 33: Global Nano Biosensors Industry Revenue Million Forecast, by Type (Qualitative Analysis) 2019 & 2032
- Table 34: Global Nano Biosensors Industry Volume K Unit Forecast, by Type (Qualitative Analysis) 2019 & 2032
- Table 35: Global Nano Biosensors Industry Revenue Million Forecast, by End-user Vertical 2019 & 2032
- Table 36: Global Nano Biosensors Industry Volume K Unit Forecast, by End-user Vertical 2019 & 2032
- Table 37: Global Nano Biosensors Industry Revenue Million Forecast, by Country 2019 & 2032
- Table 38: Global Nano Biosensors Industry Volume K Unit Forecast, by Country 2019 & 2032
- Table 39: Global Nano Biosensors Industry Revenue Million Forecast, by Type (Qualitative Analysis) 2019 & 2032
- Table 40: Global Nano Biosensors Industry Volume K Unit Forecast, by Type (Qualitative Analysis) 2019 & 2032
- Table 41: Global Nano Biosensors Industry Revenue Million Forecast, by End-user Vertical 2019 & 2032
- Table 42: Global Nano Biosensors Industry Volume K Unit Forecast, by End-user Vertical 2019 & 2032
- Table 43: Global Nano Biosensors Industry Revenue Million Forecast, by Country 2019 & 2032
- Table 44: Global Nano Biosensors Industry Volume K Unit Forecast, by Country 2019 & 2032
Frequently Asked Questions
1. What is the projected Compound Annual Growth Rate (CAGR) of the Nano Biosensors Industry?
The projected CAGR is approximately 10.00%.
2. Which companies are prominent players in the Nano Biosensors Industry?
Key companies in the market include GBS Inc , AerBetic, Nanowear Inc, Agilent Technologies Inc, ACON Laboratories Inc, Instant NanoBiosensors Co Ltd, Vista Therapeutics Inc, Abbott Point of Care Inc, Bruker Corporation, LamdaGen Corporation.
3. What are the main segments of the Nano Biosensors Industry?
The market segments include Type (Qualitative Analysis), End-user Vertical .
4. Can you provide details about the market size?
The market size is estimated to be USD XX Million as of 2022.
5. What are some drivers contributing to market growth?
; Rise of Miniaturization Trend.
6. What are the notable trends driving market growth?
Healthcare Industry Holds the Significant Share in the Market.
7. Are there any restraints impacting market growth?
Operational Challenges Involving Cross-border Payments.
8. Can you provide examples of recent developments in the market?
N/A
9. What pricing options are available for accessing the report?
Pricing options include single-user, multi-user, and enterprise licenses priced at USD 4750, USD 5250, and USD 8750 respectively.
10. Is the market size provided in terms of value or volume?
The market size is provided in terms of value, measured in Million and volume, measured in K Unit.
11. Are there any specific market keywords associated with the report?
Yes, the market keyword associated with the report is "Nano Biosensors Industry," which aids in identifying and referencing the specific market segment covered.
12. How do I determine which pricing option suits my needs best?
The pricing options vary based on user requirements and access needs. Individual users may opt for single-user licenses, while businesses requiring broader access may choose multi-user or enterprise licenses for cost-effective access to the report.
13. Are there any additional resources or data provided in the Nano Biosensors Industry report?
While the report offers comprehensive insights, it's advisable to review the specific contents or supplementary materials provided to ascertain if additional resources or data are available.
14. How can I stay updated on further developments or reports in the Nano Biosensors Industry?
To stay informed about further developments, trends, and reports in the Nano Biosensors Industry, consider subscribing to industry newsletters, following relevant companies and organizations, or regularly checking reputable industry news sources and publications.
Methodology
Step 1 - Identification of Relevant Samples Size from Population Database


Step 2 - Approaches for Defining Global Market Size (Value, Volume* & Price*)

Note*: In applicable scenarios
Step 3 - Data Sources
Primary Research
- Web Analytics
- Survey Reports
- Research Institute
- Latest Research Reports
- Opinion Leaders
Secondary Research
- Annual Reports
- White Paper
- Latest Press Release
- Industry Association
- Paid Database
- Investor Presentations

Step 4 - Data Triangulation
Involves using different sources of information in order to increase the validity of a study
These sources are likely to be stakeholders in a program - participants, other researchers, program staff, other community members, and so on.
Then we put all data in single framework & apply various statistical tools to find out the dynamic on the market.
During the analysis stage, feedback from the stakeholder groups would be compared to determine areas of agreement as well as areas of divergence
