

Key Insights
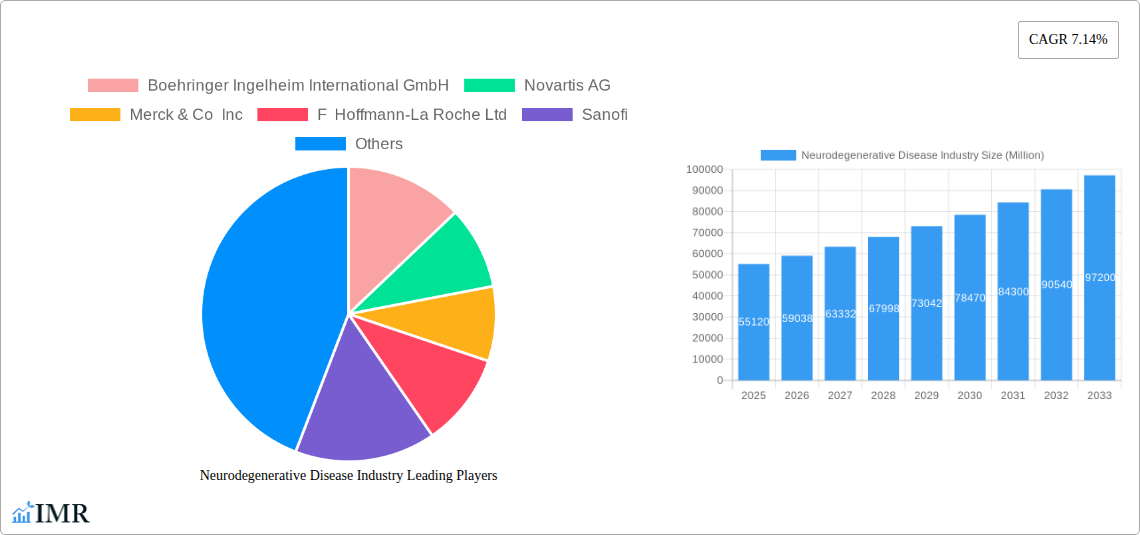
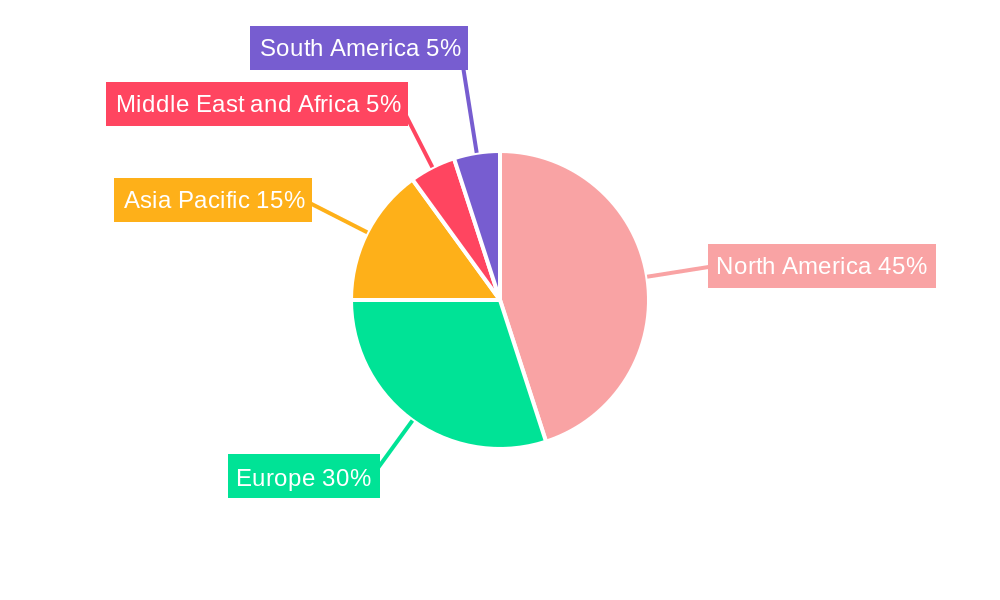
The neurodegenerative disease market, valued at $55.12 billion in 2025, exhibits robust growth potential, projected to expand at a Compound Annual Growth Rate (CAGR) of 7.14% from 2025 to 2033. This significant growth is fueled by several key factors. The aging global population is a primary driver, increasing the incidence of diseases like Alzheimer's, Parkinson's, and Multiple Sclerosis. Furthermore, advancements in research and development are leading to the emergence of novel therapies and improved diagnostic tools. Increased awareness and improved healthcare infrastructure in developing economies also contribute to market expansion. However, the high cost of treatment and the complexities involved in drug development represent significant restraints. The market is segmented by indication type (Parkinson's Disease, Alzheimer's Disease, Multiple Sclerosis, Huntington's Disease, and others) and drug type (N-methyl-D-aspartate Receptor Antagonists, Cholinesterase Inhibitors, Dopamine Agonists, Immunomodulatory Drugs, and others), reflecting the diverse therapeutic approaches employed. Competition among major pharmaceutical companies such as Boehringer Ingelheim, Novartis, Merck, Roche, Sanofi, and others is intense, driving innovation and fostering market growth. Geographical distribution showcases North America as a dominant market share holder followed by Europe and Asia-Pacific, reflecting varying healthcare infrastructure and disease prevalence.
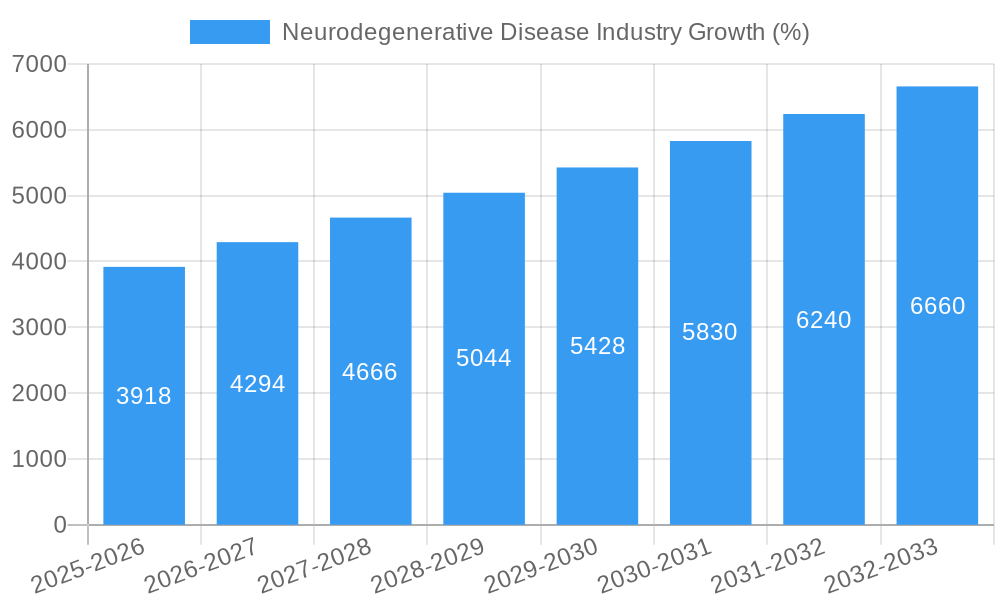
The forecast period from 2025-2033 anticipates continued market expansion, driven by an aging global population and ongoing research advancements resulting in improved therapies and earlier disease detection. Strategic collaborations between pharmaceutical companies and research institutions are expected to accelerate the development of disease-modifying therapies. However, challenges remain, including the need for more effective treatments, particularly for Alzheimer's disease, and the high cost of long-term care. The market’s future will be shaped by the success of new drug launches, the expansion of access to healthcare in emerging markets, and the development of effective strategies for disease prevention and management. This necessitates continued investment in research and the development of more comprehensive healthcare policies to address the growing burden of neurodegenerative diseases.
Neurodegenerative Disease Industry Market Report: 2019-2033
This comprehensive report provides an in-depth analysis of the neurodegenerative disease market, encompassing market dynamics, growth trends, regional segmentation, product landscape, key challenges and opportunities, and a detailed look at key players. The study period covers 2019-2033, with a base year of 2025 and a forecast period of 2025-2033. The report offers valuable insights for industry professionals, investors, and researchers seeking to understand and navigate this rapidly evolving market. The total market size is projected to reach xx Million by 2033.
Neurodegenerative Disease Industry Market Dynamics & Structure
The neurodegenerative disease market is characterized by a moderately concentrated structure, with several large pharmaceutical companies holding significant market share. Technological innovation, particularly in areas like gene therapy and biomarker discovery, is a key driver. Stringent regulatory frameworks governing drug approvals pose significant challenges, influencing timelines and overall market entry strategies. Competitive pressure arises from the emergence of novel drug types and the development of biosimilars. The market is significantly influenced by demographic shifts, with an aging global population leading to a rise in prevalent neurodegenerative diseases like Alzheimer's and Parkinson's. M&A activity is relatively high, reflecting companies' strategies to expand their portfolios and strengthen their position in this lucrative space.
- Market Concentration: Moderately concentrated, with top 10 players holding xx% market share in 2024.
- Technological Innovation: Significant advancements in gene editing, biomarker development, and personalized medicine are driving innovation.
- Regulatory Landscape: Stringent regulatory approvals create barriers to entry but ensure patient safety.
- Competitive Substitutes: Biosimilars and novel therapeutic approaches pose competitive pressure.
- End-User Demographics: Aging global population fuels market growth.
- M&A Activity: High volume of mergers and acquisitions, with xx deals recorded in the last 5 years (estimated).
Neurodegenerative Disease Industry Growth Trends & Insights
The neurodegenerative disease market exhibits substantial growth, driven by several factors. The market size experienced a CAGR of xx% during the historical period (2019-2024) and is projected to grow at a CAGR of xx% during the forecast period (2025-2033). Increasing prevalence of neurodegenerative diseases, particularly Alzheimer's and Parkinson's, along with rising healthcare expenditure, are significant contributors to this growth. Technological advancements have led to the development of more effective diagnostic tools and treatment options, furthering market expansion. Shifting consumer preferences towards personalized medicine and improved patient outcomes also influence the market dynamics. Improved healthcare infrastructure and increased awareness are also boosting adoption rates. However, high treatment costs and limited access in certain regions pose challenges.
Dominant Regions, Countries, or Segments in Neurodegenerative Disease Industry
North America currently dominates the neurodegenerative disease market, holding the largest market share, attributed to high healthcare expenditure, advanced healthcare infrastructure, and a relatively high prevalence of these diseases. Within this region, the United States leads with xx% of the market share (estimated in 2025). Europe holds the second-largest share.
Indication Type: Alzheimer's disease represents the largest segment, accounting for xx% of the total market in 2025 (estimated), followed by Parkinson's disease at xx%.
Drug Type: Cholinesterase inhibitors dominate the drug market, holding xx% of the market share in 2025 (estimated), followed by Dopamine agonists.
- North America Dominance: High healthcare expenditure, advanced healthcare infrastructure, and high disease prevalence contribute to its leading position.
- Europe's Significant Presence: Mature healthcare systems and a large aging population contribute to market growth.
- Alzheimer's Disease Largest Segment: High prevalence drives market demand.
- Cholinesterase Inhibitors Dominate Drug Type: Widely used and established efficacy contribute to market share.
Neurodegenerative Disease Industry Product Landscape
The neurodegenerative disease market comprises a wide range of pharmaceutical products, including disease-modifying therapies, symptomatic treatments, and supportive care medications. Recent innovations focus on improving efficacy, reducing side effects, and enhancing patient compliance. Technological advancements are leading to personalized medicine approaches, with products tailored to specific genetic profiles. Companies are also focusing on developing new diagnostic tools to enable earlier disease detection. Unique selling propositions often center around improved tolerability, efficacy profiles, and targeted drug delivery systems.
Key Drivers, Barriers & Challenges in Neurodegenerative Disease Industry
Key Drivers:
- Aging global population leading to increased prevalence of neurodegenerative diseases.
- Rising healthcare expenditure and increased accessibility to healthcare services.
- Technological advancements in diagnostics and treatment options.
Key Barriers & Challenges:
- High research and development costs associated with drug discovery.
- Stringent regulatory pathways for drug approvals.
- Limited treatment options for certain neurodegenerative diseases.
- The complexity of neurodegenerative diseases and challenges in developing effective treatments.
Emerging Opportunities in Neurodegenerative Disease Industry
- Growth in personalized medicine: Tailoring treatment strategies based on individual genetic profiles.
- Development of novel diagnostic tools for earlier disease detection.
- Expansion into emerging markets with high unmet medical needs.
- Focus on disease prevention strategies and lifestyle interventions.
Growth Accelerators in the Neurodegenerative Disease Industry
Continued technological advancements in disease understanding and treatment, coupled with strategic collaborations between pharmaceutical companies and research institutions, are poised to propel long-term growth. Expanding market penetration in under-served regions and focusing on improved patient outcomes through personalized care will also be crucial growth accelerators.
Key Players Shaping the Neurodegenerative Disease Industry Market
- Boehringer Ingelheim International GmbH
- Novartis AG
- Merck & Co Inc
- F Hoffmann-La Roche Ltd
- Sanofi
- Teva Pharmaceutical Industries Ltd
- Amneal Pharmaceuticals Inc
- AbbVie Inc
- Johnson & Johnson Services Inc
- UCB S.A
- Biogen Inc
- Pfizer Inc
Notable Milestones in Neurodegenerative Disease Industry Sector
- December 2023: Evotec and BMS entered into a license agreement for late-stage discovery programs targeting disease-modifying treatments for neurodegenerative diseases.
- March 2024: Creyon Bio announced a strategic collaboration with Cajal Neuroscience to develop oligonucleotide-based medical solutions for neurodegenerative diseases.
In-Depth Neurodegenerative Disease Industry Market Outlook
The neurodegenerative disease market presents a significant opportunity for growth, driven by the increasing prevalence of these debilitating conditions and advancements in scientific understanding. Strategic partnerships, innovative therapies, and increased investment in R&D will be key determinants of future market success. The long-term outlook is positive, with potential for substantial market expansion as novel treatment options emerge and global healthcare infrastructure continues to evolve.
Neurodegenerative Disease Industry Segmentation
-
1. Indication Type
- 1.1. Parkinson's Disease
- 1.2. Alzheimer's Disease
- 1.3. Multiple Sclerosis
- 1.4. Huntington Disease
- 1.5. Other Indication Types
-
2. Drug Type
- 2.1. N-methyl-D-aspartate Receptor Antagonists
- 2.2. Cholinesterase Inhibitors
- 2.3. Dopamine Agonists
- 2.4. Immunomodulatory Drugs
- 2.5. Other Drug Types
Neurodegenerative Disease Industry Segmentation By Geography
-
1. North America
- 1.1. United States
- 1.2. Canada
- 1.3. Mexico
-
2. Europe
- 2.1. Germany
- 2.2. United Kingdom
- 2.3. France
- 2.4. Italy
- 2.5. Spain
- 2.6. Rest of Europe
-
3. Asia Pacific
- 3.1. China
- 3.2. Japan
- 3.3. India
- 3.4. Australia
- 3.5. South Korea
- 3.6. Rest of Asia Pacific
-
4. Middle East and Africa
- 4.1. GCC
- 4.2. South Africa
- 4.3. Rest of Middle East and Africa
-
5. South America
- 5.1. Brazil
- 5.2. Argentina
- 5.3. Rest of South America
Neurodegenerative Disease Industry REPORT HIGHLIGHTS
| Aspects | Details |
|---|---|
| Study Period | 2019-2033 |
| Base Year | 2024 |
| Estimated Year | 2025 |
| Forecast Period | 2025-2033 |
| Historical Period | 2019-2024 |
| Growth Rate | CAGR of 7.14% from 2019-2033 |
| Segmentation |
|
Table of Contents
- 1. Introduction
- 1.1. Research Scope
- 1.2. Market Segmentation
- 1.3. Research Methodology
- 1.4. Definitions and Assumptions
- 2. Executive Summary
- 2.1. Introduction
- 3. Market Dynamics
- 3.1. Introduction
- 3.2. Market Drivers
- 3.2.1. Rising Prevalence of Neurological Disorders; Increasing Public Awareness; Strong Product Pipeline for Neurodegenerative Disease Treatment
- 3.3. Market Restrains
- 3.3.1. Patent Expiry of Neurodegenerative Disease Treatment Products; Stringent Regulatory Guidelines
- 3.4. Market Trends
- 3.4.1. Alzheimer's Disease is Expected to Witness Significant Growth Over the Forecast Period
- 4. Market Factor Analysis
- 4.1. Porters Five Forces
- 4.2. Supply/Value Chain
- 4.3. PESTEL analysis
- 4.4. Market Entropy
- 4.5. Patent/Trademark Analysis
- 5. Global Neurodegenerative Disease Industry Analysis, Insights and Forecast, 2019-2031
- 5.1. Market Analysis, Insights and Forecast - by Indication Type
- 5.1.1. Parkinson's Disease
- 5.1.2. Alzheimer's Disease
- 5.1.3. Multiple Sclerosis
- 5.1.4. Huntington Disease
- 5.1.5. Other Indication Types
- 5.2. Market Analysis, Insights and Forecast - by Drug Type
- 5.2.1. N-methyl-D-aspartate Receptor Antagonists
- 5.2.2. Cholinesterase Inhibitors
- 5.2.3. Dopamine Agonists
- 5.2.4. Immunomodulatory Drugs
- 5.2.5. Other Drug Types
- 5.3. Market Analysis, Insights and Forecast - by Region
- 5.3.1. North America
- 5.3.2. Europe
- 5.3.3. Asia Pacific
- 5.3.4. Middle East and Africa
- 5.3.5. South America
- 5.1. Market Analysis, Insights and Forecast - by Indication Type
- 6. North America Neurodegenerative Disease Industry Analysis, Insights and Forecast, 2019-2031
- 6.1. Market Analysis, Insights and Forecast - by Indication Type
- 6.1.1. Parkinson's Disease
- 6.1.2. Alzheimer's Disease
- 6.1.3. Multiple Sclerosis
- 6.1.4. Huntington Disease
- 6.1.5. Other Indication Types
- 6.2. Market Analysis, Insights and Forecast - by Drug Type
- 6.2.1. N-methyl-D-aspartate Receptor Antagonists
- 6.2.2. Cholinesterase Inhibitors
- 6.2.3. Dopamine Agonists
- 6.2.4. Immunomodulatory Drugs
- 6.2.5. Other Drug Types
- 6.1. Market Analysis, Insights and Forecast - by Indication Type
- 7. Europe Neurodegenerative Disease Industry Analysis, Insights and Forecast, 2019-2031
- 7.1. Market Analysis, Insights and Forecast - by Indication Type
- 7.1.1. Parkinson's Disease
- 7.1.2. Alzheimer's Disease
- 7.1.3. Multiple Sclerosis
- 7.1.4. Huntington Disease
- 7.1.5. Other Indication Types
- 7.2. Market Analysis, Insights and Forecast - by Drug Type
- 7.2.1. N-methyl-D-aspartate Receptor Antagonists
- 7.2.2. Cholinesterase Inhibitors
- 7.2.3. Dopamine Agonists
- 7.2.4. Immunomodulatory Drugs
- 7.2.5. Other Drug Types
- 7.1. Market Analysis, Insights and Forecast - by Indication Type
- 8. Asia Pacific Neurodegenerative Disease Industry Analysis, Insights and Forecast, 2019-2031
- 8.1. Market Analysis, Insights and Forecast - by Indication Type
- 8.1.1. Parkinson's Disease
- 8.1.2. Alzheimer's Disease
- 8.1.3. Multiple Sclerosis
- 8.1.4. Huntington Disease
- 8.1.5. Other Indication Types
- 8.2. Market Analysis, Insights and Forecast - by Drug Type
- 8.2.1. N-methyl-D-aspartate Receptor Antagonists
- 8.2.2. Cholinesterase Inhibitors
- 8.2.3. Dopamine Agonists
- 8.2.4. Immunomodulatory Drugs
- 8.2.5. Other Drug Types
- 8.1. Market Analysis, Insights and Forecast - by Indication Type
- 9. Middle East and Africa Neurodegenerative Disease Industry Analysis, Insights and Forecast, 2019-2031
- 9.1. Market Analysis, Insights and Forecast - by Indication Type
- 9.1.1. Parkinson's Disease
- 9.1.2. Alzheimer's Disease
- 9.1.3. Multiple Sclerosis
- 9.1.4. Huntington Disease
- 9.1.5. Other Indication Types
- 9.2. Market Analysis, Insights and Forecast - by Drug Type
- 9.2.1. N-methyl-D-aspartate Receptor Antagonists
- 9.2.2. Cholinesterase Inhibitors
- 9.2.3. Dopamine Agonists
- 9.2.4. Immunomodulatory Drugs
- 9.2.5. Other Drug Types
- 9.1. Market Analysis, Insights and Forecast - by Indication Type
- 10. South America Neurodegenerative Disease Industry Analysis, Insights and Forecast, 2019-2031
- 10.1. Market Analysis, Insights and Forecast - by Indication Type
- 10.1.1. Parkinson's Disease
- 10.1.2. Alzheimer's Disease
- 10.1.3. Multiple Sclerosis
- 10.1.4. Huntington Disease
- 10.1.5. Other Indication Types
- 10.2. Market Analysis, Insights and Forecast - by Drug Type
- 10.2.1. N-methyl-D-aspartate Receptor Antagonists
- 10.2.2. Cholinesterase Inhibitors
- 10.2.3. Dopamine Agonists
- 10.2.4. Immunomodulatory Drugs
- 10.2.5. Other Drug Types
- 10.1. Market Analysis, Insights and Forecast - by Indication Type
- 11. North America Neurodegenerative Disease Industry Analysis, Insights and Forecast, 2019-2031
- 11.1. Market Analysis, Insights and Forecast - By Country/Sub-region
- 11.1.1 United States
- 11.1.2 Canada
- 11.1.3 Mexico
- 12. Europe Neurodegenerative Disease Industry Analysis, Insights and Forecast, 2019-2031
- 12.1. Market Analysis, Insights and Forecast - By Country/Sub-region
- 12.1.1 Germany
- 12.1.2 United Kingdom
- 12.1.3 France
- 12.1.4 Italy
- 12.1.5 Spain
- 12.1.6 Nordics
- 12.1.7 Benelux
- 12.1.8 Rest of Europe
- 13. Asia Pacific Neurodegenerative Disease Industry Analysis, Insights and Forecast, 2019-2031
- 13.1. Market Analysis, Insights and Forecast - By Country/Sub-region
- 13.1.1 China
- 13.1.2 Japan
- 13.1.3 India
- 13.1.4 Australia
- 13.1.5 South Korea
- 13.1.6 Rest of Asia Pacific
- 14. Middle East and Africa Neurodegenerative Disease Industry Analysis, Insights and Forecast, 2019-2031
- 14.1. Market Analysis, Insights and Forecast - By Country/Sub-region
- 14.1.1 GCC
- 14.1.2 South Africa
- 14.1.3 Rest of Middle East and Africa
- 15. South America Neurodegenerative Disease Industry Analysis, Insights and Forecast, 2019-2031
- 15.1. Market Analysis, Insights and Forecast - By Country/Sub-region
- 15.1.1 Brazil
- 15.1.2 Argentina
- 15.1.3 Rest of South America
- 16. Competitive Analysis
- 16.1. Global Market Share Analysis 2024
- 16.2. Company Profiles
- 16.2.1 Boehringer Ingelheim International GmbH
- 16.2.1.1. Overview
- 16.2.1.2. Products
- 16.2.1.3. SWOT Analysis
- 16.2.1.4. Recent Developments
- 16.2.1.5. Financials (Based on Availability)
- 16.2.2 Novartis AG
- 16.2.2.1. Overview
- 16.2.2.2. Products
- 16.2.2.3. SWOT Analysis
- 16.2.2.4. Recent Developments
- 16.2.2.5. Financials (Based on Availability)
- 16.2.3 Merck & Co Inc
- 16.2.3.1. Overview
- 16.2.3.2. Products
- 16.2.3.3. SWOT Analysis
- 16.2.3.4. Recent Developments
- 16.2.3.5. Financials (Based on Availability)
- 16.2.4 F Hoffmann-La Roche Ltd
- 16.2.4.1. Overview
- 16.2.4.2. Products
- 16.2.4.3. SWOT Analysis
- 16.2.4.4. Recent Developments
- 16.2.4.5. Financials (Based on Availability)
- 16.2.5 Sanofi
- 16.2.5.1. Overview
- 16.2.5.2. Products
- 16.2.5.3. SWOT Analysis
- 16.2.5.4. Recent Developments
- 16.2.5.5. Financials (Based on Availability)
- 16.2.6 Teva Pharmaceutical Industries Ltd
- 16.2.6.1. Overview
- 16.2.6.2. Products
- 16.2.6.3. SWOT Analysis
- 16.2.6.4. Recent Developments
- 16.2.6.5. Financials (Based on Availability)
- 16.2.7 Amneal Pharmaceuticals Inc
- 16.2.7.1. Overview
- 16.2.7.2. Products
- 16.2.7.3. SWOT Analysis
- 16.2.7.4. Recent Developments
- 16.2.7.5. Financials (Based on Availability)
- 16.2.8 AbbVie Inc
- 16.2.8.1. Overview
- 16.2.8.2. Products
- 16.2.8.3. SWOT Analysis
- 16.2.8.4. Recent Developments
- 16.2.8.5. Financials (Based on Availability)
- 16.2.9 Johnson & Johnson Services Inc
- 16.2.9.1. Overview
- 16.2.9.2. Products
- 16.2.9.3. SWOT Analysis
- 16.2.9.4. Recent Developments
- 16.2.9.5. Financials (Based on Availability)
- 16.2.10 UCB S A
- 16.2.10.1. Overview
- 16.2.10.2. Products
- 16.2.10.3. SWOT Analysis
- 16.2.10.4. Recent Developments
- 16.2.10.5. Financials (Based on Availability)
- 16.2.11 Biogen Inc
- 16.2.11.1. Overview
- 16.2.11.2. Products
- 16.2.11.3. SWOT Analysis
- 16.2.11.4. Recent Developments
- 16.2.11.5. Financials (Based on Availability)
- 16.2.12 Pfizer Inc
- 16.2.12.1. Overview
- 16.2.12.2. Products
- 16.2.12.3. SWOT Analysis
- 16.2.12.4. Recent Developments
- 16.2.12.5. Financials (Based on Availability)
- 16.2.1 Boehringer Ingelheim International GmbH
List of Figures
- Figure 1: Global Neurodegenerative Disease Industry Revenue Breakdown (Million, %) by Region 2024 & 2032
- Figure 2: Global Neurodegenerative Disease Industry Volume Breakdown (K Unit, %) by Region 2024 & 2032
- Figure 3: North America Neurodegenerative Disease Industry Revenue (Million), by Country 2024 & 2032
- Figure 4: North America Neurodegenerative Disease Industry Volume (K Unit), by Country 2024 & 2032
- Figure 5: North America Neurodegenerative Disease Industry Revenue Share (%), by Country 2024 & 2032
- Figure 6: North America Neurodegenerative Disease Industry Volume Share (%), by Country 2024 & 2032
- Figure 7: Europe Neurodegenerative Disease Industry Revenue (Million), by Country 2024 & 2032
- Figure 8: Europe Neurodegenerative Disease Industry Volume (K Unit), by Country 2024 & 2032
- Figure 9: Europe Neurodegenerative Disease Industry Revenue Share (%), by Country 2024 & 2032
- Figure 10: Europe Neurodegenerative Disease Industry Volume Share (%), by Country 2024 & 2032
- Figure 11: Asia Pacific Neurodegenerative Disease Industry Revenue (Million), by Country 2024 & 2032
- Figure 12: Asia Pacific Neurodegenerative Disease Industry Volume (K Unit), by Country 2024 & 2032
- Figure 13: Asia Pacific Neurodegenerative Disease Industry Revenue Share (%), by Country 2024 & 2032
- Figure 14: Asia Pacific Neurodegenerative Disease Industry Volume Share (%), by Country 2024 & 2032
- Figure 15: Middle East and Africa Neurodegenerative Disease Industry Revenue (Million), by Country 2024 & 2032
- Figure 16: Middle East and Africa Neurodegenerative Disease Industry Volume (K Unit), by Country 2024 & 2032
- Figure 17: Middle East and Africa Neurodegenerative Disease Industry Revenue Share (%), by Country 2024 & 2032
- Figure 18: Middle East and Africa Neurodegenerative Disease Industry Volume Share (%), by Country 2024 & 2032
- Figure 19: South America Neurodegenerative Disease Industry Revenue (Million), by Country 2024 & 2032
- Figure 20: South America Neurodegenerative Disease Industry Volume (K Unit), by Country 2024 & 2032
- Figure 21: South America Neurodegenerative Disease Industry Revenue Share (%), by Country 2024 & 2032
- Figure 22: South America Neurodegenerative Disease Industry Volume Share (%), by Country 2024 & 2032
- Figure 23: North America Neurodegenerative Disease Industry Revenue (Million), by Indication Type 2024 & 2032
- Figure 24: North America Neurodegenerative Disease Industry Volume (K Unit), by Indication Type 2024 & 2032
- Figure 25: North America Neurodegenerative Disease Industry Revenue Share (%), by Indication Type 2024 & 2032
- Figure 26: North America Neurodegenerative Disease Industry Volume Share (%), by Indication Type 2024 & 2032
- Figure 27: North America Neurodegenerative Disease Industry Revenue (Million), by Drug Type 2024 & 2032
- Figure 28: North America Neurodegenerative Disease Industry Volume (K Unit), by Drug Type 2024 & 2032
- Figure 29: North America Neurodegenerative Disease Industry Revenue Share (%), by Drug Type 2024 & 2032
- Figure 30: North America Neurodegenerative Disease Industry Volume Share (%), by Drug Type 2024 & 2032
- Figure 31: North America Neurodegenerative Disease Industry Revenue (Million), by Country 2024 & 2032
- Figure 32: North America Neurodegenerative Disease Industry Volume (K Unit), by Country 2024 & 2032
- Figure 33: North America Neurodegenerative Disease Industry Revenue Share (%), by Country 2024 & 2032
- Figure 34: North America Neurodegenerative Disease Industry Volume Share (%), by Country 2024 & 2032
- Figure 35: Europe Neurodegenerative Disease Industry Revenue (Million), by Indication Type 2024 & 2032
- Figure 36: Europe Neurodegenerative Disease Industry Volume (K Unit), by Indication Type 2024 & 2032
- Figure 37: Europe Neurodegenerative Disease Industry Revenue Share (%), by Indication Type 2024 & 2032
- Figure 38: Europe Neurodegenerative Disease Industry Volume Share (%), by Indication Type 2024 & 2032
- Figure 39: Europe Neurodegenerative Disease Industry Revenue (Million), by Drug Type 2024 & 2032
- Figure 40: Europe Neurodegenerative Disease Industry Volume (K Unit), by Drug Type 2024 & 2032
- Figure 41: Europe Neurodegenerative Disease Industry Revenue Share (%), by Drug Type 2024 & 2032
- Figure 42: Europe Neurodegenerative Disease Industry Volume Share (%), by Drug Type 2024 & 2032
- Figure 43: Europe Neurodegenerative Disease Industry Revenue (Million), by Country 2024 & 2032
- Figure 44: Europe Neurodegenerative Disease Industry Volume (K Unit), by Country 2024 & 2032
- Figure 45: Europe Neurodegenerative Disease Industry Revenue Share (%), by Country 2024 & 2032
- Figure 46: Europe Neurodegenerative Disease Industry Volume Share (%), by Country 2024 & 2032
- Figure 47: Asia Pacific Neurodegenerative Disease Industry Revenue (Million), by Indication Type 2024 & 2032
- Figure 48: Asia Pacific Neurodegenerative Disease Industry Volume (K Unit), by Indication Type 2024 & 2032
- Figure 49: Asia Pacific Neurodegenerative Disease Industry Revenue Share (%), by Indication Type 2024 & 2032
- Figure 50: Asia Pacific Neurodegenerative Disease Industry Volume Share (%), by Indication Type 2024 & 2032
- Figure 51: Asia Pacific Neurodegenerative Disease Industry Revenue (Million), by Drug Type 2024 & 2032
- Figure 52: Asia Pacific Neurodegenerative Disease Industry Volume (K Unit), by Drug Type 2024 & 2032
- Figure 53: Asia Pacific Neurodegenerative Disease Industry Revenue Share (%), by Drug Type 2024 & 2032
- Figure 54: Asia Pacific Neurodegenerative Disease Industry Volume Share (%), by Drug Type 2024 & 2032
- Figure 55: Asia Pacific Neurodegenerative Disease Industry Revenue (Million), by Country 2024 & 2032
- Figure 56: Asia Pacific Neurodegenerative Disease Industry Volume (K Unit), by Country 2024 & 2032
- Figure 57: Asia Pacific Neurodegenerative Disease Industry Revenue Share (%), by Country 2024 & 2032
- Figure 58: Asia Pacific Neurodegenerative Disease Industry Volume Share (%), by Country 2024 & 2032
- Figure 59: Middle East and Africa Neurodegenerative Disease Industry Revenue (Million), by Indication Type 2024 & 2032
- Figure 60: Middle East and Africa Neurodegenerative Disease Industry Volume (K Unit), by Indication Type 2024 & 2032
- Figure 61: Middle East and Africa Neurodegenerative Disease Industry Revenue Share (%), by Indication Type 2024 & 2032
- Figure 62: Middle East and Africa Neurodegenerative Disease Industry Volume Share (%), by Indication Type 2024 & 2032
- Figure 63: Middle East and Africa Neurodegenerative Disease Industry Revenue (Million), by Drug Type 2024 & 2032
- Figure 64: Middle East and Africa Neurodegenerative Disease Industry Volume (K Unit), by Drug Type 2024 & 2032
- Figure 65: Middle East and Africa Neurodegenerative Disease Industry Revenue Share (%), by Drug Type 2024 & 2032
- Figure 66: Middle East and Africa Neurodegenerative Disease Industry Volume Share (%), by Drug Type 2024 & 2032
- Figure 67: Middle East and Africa Neurodegenerative Disease Industry Revenue (Million), by Country 2024 & 2032
- Figure 68: Middle East and Africa Neurodegenerative Disease Industry Volume (K Unit), by Country 2024 & 2032
- Figure 69: Middle East and Africa Neurodegenerative Disease Industry Revenue Share (%), by Country 2024 & 2032
- Figure 70: Middle East and Africa Neurodegenerative Disease Industry Volume Share (%), by Country 2024 & 2032
- Figure 71: South America Neurodegenerative Disease Industry Revenue (Million), by Indication Type 2024 & 2032
- Figure 72: South America Neurodegenerative Disease Industry Volume (K Unit), by Indication Type 2024 & 2032
- Figure 73: South America Neurodegenerative Disease Industry Revenue Share (%), by Indication Type 2024 & 2032
- Figure 74: South America Neurodegenerative Disease Industry Volume Share (%), by Indication Type 2024 & 2032
- Figure 75: South America Neurodegenerative Disease Industry Revenue (Million), by Drug Type 2024 & 2032
- Figure 76: South America Neurodegenerative Disease Industry Volume (K Unit), by Drug Type 2024 & 2032
- Figure 77: South America Neurodegenerative Disease Industry Revenue Share (%), by Drug Type 2024 & 2032
- Figure 78: South America Neurodegenerative Disease Industry Volume Share (%), by Drug Type 2024 & 2032
- Figure 79: South America Neurodegenerative Disease Industry Revenue (Million), by Country 2024 & 2032
- Figure 80: South America Neurodegenerative Disease Industry Volume (K Unit), by Country 2024 & 2032
- Figure 81: South America Neurodegenerative Disease Industry Revenue Share (%), by Country 2024 & 2032
- Figure 82: South America Neurodegenerative Disease Industry Volume Share (%), by Country 2024 & 2032
List of Tables
- Table 1: Global Neurodegenerative Disease Industry Revenue Million Forecast, by Region 2019 & 2032
- Table 2: Global Neurodegenerative Disease Industry Volume K Unit Forecast, by Region 2019 & 2032
- Table 3: Global Neurodegenerative Disease Industry Revenue Million Forecast, by Indication Type 2019 & 2032
- Table 4: Global Neurodegenerative Disease Industry Volume K Unit Forecast, by Indication Type 2019 & 2032
- Table 5: Global Neurodegenerative Disease Industry Revenue Million Forecast, by Drug Type 2019 & 2032
- Table 6: Global Neurodegenerative Disease Industry Volume K Unit Forecast, by Drug Type 2019 & 2032
- Table 7: Global Neurodegenerative Disease Industry Revenue Million Forecast, by Region 2019 & 2032
- Table 8: Global Neurodegenerative Disease Industry Volume K Unit Forecast, by Region 2019 & 2032
- Table 9: Global Neurodegenerative Disease Industry Revenue Million Forecast, by Country 2019 & 2032
- Table 10: Global Neurodegenerative Disease Industry Volume K Unit Forecast, by Country 2019 & 2032
- Table 11: United States Neurodegenerative Disease Industry Revenue (Million) Forecast, by Application 2019 & 2032
- Table 12: United States Neurodegenerative Disease Industry Volume (K Unit) Forecast, by Application 2019 & 2032
- Table 13: Canada Neurodegenerative Disease Industry Revenue (Million) Forecast, by Application 2019 & 2032
- Table 14: Canada Neurodegenerative Disease Industry Volume (K Unit) Forecast, by Application 2019 & 2032
- Table 15: Mexico Neurodegenerative Disease Industry Revenue (Million) Forecast, by Application 2019 & 2032
- Table 16: Mexico Neurodegenerative Disease Industry Volume (K Unit) Forecast, by Application 2019 & 2032
- Table 17: Global Neurodegenerative Disease Industry Revenue Million Forecast, by Country 2019 & 2032
- Table 18: Global Neurodegenerative Disease Industry Volume K Unit Forecast, by Country 2019 & 2032
- Table 19: Germany Neurodegenerative Disease Industry Revenue (Million) Forecast, by Application 2019 & 2032
- Table 20: Germany Neurodegenerative Disease Industry Volume (K Unit) Forecast, by Application 2019 & 2032
- Table 21: United Kingdom Neurodegenerative Disease Industry Revenue (Million) Forecast, by Application 2019 & 2032
- Table 22: United Kingdom Neurodegenerative Disease Industry Volume (K Unit) Forecast, by Application 2019 & 2032
- Table 23: France Neurodegenerative Disease Industry Revenue (Million) Forecast, by Application 2019 & 2032
- Table 24: France Neurodegenerative Disease Industry Volume (K Unit) Forecast, by Application 2019 & 2032
- Table 25: Italy Neurodegenerative Disease Industry Revenue (Million) Forecast, by Application 2019 & 2032
- Table 26: Italy Neurodegenerative Disease Industry Volume (K Unit) Forecast, by Application 2019 & 2032
- Table 27: Spain Neurodegenerative Disease Industry Revenue (Million) Forecast, by Application 2019 & 2032
- Table 28: Spain Neurodegenerative Disease Industry Volume (K Unit) Forecast, by Application 2019 & 2032
- Table 29: Nordics Neurodegenerative Disease Industry Revenue (Million) Forecast, by Application 2019 & 2032
- Table 30: Nordics Neurodegenerative Disease Industry Volume (K Unit) Forecast, by Application 2019 & 2032
- Table 31: Benelux Neurodegenerative Disease Industry Revenue (Million) Forecast, by Application 2019 & 2032
- Table 32: Benelux Neurodegenerative Disease Industry Volume (K Unit) Forecast, by Application 2019 & 2032
- Table 33: Rest of Europe Neurodegenerative Disease Industry Revenue (Million) Forecast, by Application 2019 & 2032
- Table 34: Rest of Europe Neurodegenerative Disease Industry Volume (K Unit) Forecast, by Application 2019 & 2032
- Table 35: Global Neurodegenerative Disease Industry Revenue Million Forecast, by Country 2019 & 2032
- Table 36: Global Neurodegenerative Disease Industry Volume K Unit Forecast, by Country 2019 & 2032
- Table 37: China Neurodegenerative Disease Industry Revenue (Million) Forecast, by Application 2019 & 2032
- Table 38: China Neurodegenerative Disease Industry Volume (K Unit) Forecast, by Application 2019 & 2032
- Table 39: Japan Neurodegenerative Disease Industry Revenue (Million) Forecast, by Application 2019 & 2032
- Table 40: Japan Neurodegenerative Disease Industry Volume (K Unit) Forecast, by Application 2019 & 2032
- Table 41: India Neurodegenerative Disease Industry Revenue (Million) Forecast, by Application 2019 & 2032
- Table 42: India Neurodegenerative Disease Industry Volume (K Unit) Forecast, by Application 2019 & 2032
- Table 43: Australia Neurodegenerative Disease Industry Revenue (Million) Forecast, by Application 2019 & 2032
- Table 44: Australia Neurodegenerative Disease Industry Volume (K Unit) Forecast, by Application 2019 & 2032
- Table 45: South Korea Neurodegenerative Disease Industry Revenue (Million) Forecast, by Application 2019 & 2032
- Table 46: South Korea Neurodegenerative Disease Industry Volume (K Unit) Forecast, by Application 2019 & 2032
- Table 47: Rest of Asia Pacific Neurodegenerative Disease Industry Revenue (Million) Forecast, by Application 2019 & 2032
- Table 48: Rest of Asia Pacific Neurodegenerative Disease Industry Volume (K Unit) Forecast, by Application 2019 & 2032
- Table 49: Global Neurodegenerative Disease Industry Revenue Million Forecast, by Country 2019 & 2032
- Table 50: Global Neurodegenerative Disease Industry Volume K Unit Forecast, by Country 2019 & 2032
- Table 51: GCC Neurodegenerative Disease Industry Revenue (Million) Forecast, by Application 2019 & 2032
- Table 52: GCC Neurodegenerative Disease Industry Volume (K Unit) Forecast, by Application 2019 & 2032
- Table 53: South Africa Neurodegenerative Disease Industry Revenue (Million) Forecast, by Application 2019 & 2032
- Table 54: South Africa Neurodegenerative Disease Industry Volume (K Unit) Forecast, by Application 2019 & 2032
- Table 55: Rest of Middle East and Africa Neurodegenerative Disease Industry Revenue (Million) Forecast, by Application 2019 & 2032
- Table 56: Rest of Middle East and Africa Neurodegenerative Disease Industry Volume (K Unit) Forecast, by Application 2019 & 2032
- Table 57: Global Neurodegenerative Disease Industry Revenue Million Forecast, by Country 2019 & 2032
- Table 58: Global Neurodegenerative Disease Industry Volume K Unit Forecast, by Country 2019 & 2032
- Table 59: Brazil Neurodegenerative Disease Industry Revenue (Million) Forecast, by Application 2019 & 2032
- Table 60: Brazil Neurodegenerative Disease Industry Volume (K Unit) Forecast, by Application 2019 & 2032
- Table 61: Argentina Neurodegenerative Disease Industry Revenue (Million) Forecast, by Application 2019 & 2032
- Table 62: Argentina Neurodegenerative Disease Industry Volume (K Unit) Forecast, by Application 2019 & 2032
- Table 63: Rest of South America Neurodegenerative Disease Industry Revenue (Million) Forecast, by Application 2019 & 2032
- Table 64: Rest of South America Neurodegenerative Disease Industry Volume (K Unit) Forecast, by Application 2019 & 2032
- Table 65: Global Neurodegenerative Disease Industry Revenue Million Forecast, by Indication Type 2019 & 2032
- Table 66: Global Neurodegenerative Disease Industry Volume K Unit Forecast, by Indication Type 2019 & 2032
- Table 67: Global Neurodegenerative Disease Industry Revenue Million Forecast, by Drug Type 2019 & 2032
- Table 68: Global Neurodegenerative Disease Industry Volume K Unit Forecast, by Drug Type 2019 & 2032
- Table 69: Global Neurodegenerative Disease Industry Revenue Million Forecast, by Country 2019 & 2032
- Table 70: Global Neurodegenerative Disease Industry Volume K Unit Forecast, by Country 2019 & 2032
- Table 71: United States Neurodegenerative Disease Industry Revenue (Million) Forecast, by Application 2019 & 2032
- Table 72: United States Neurodegenerative Disease Industry Volume (K Unit) Forecast, by Application 2019 & 2032
- Table 73: Canada Neurodegenerative Disease Industry Revenue (Million) Forecast, by Application 2019 & 2032
- Table 74: Canada Neurodegenerative Disease Industry Volume (K Unit) Forecast, by Application 2019 & 2032
- Table 75: Mexico Neurodegenerative Disease Industry Revenue (Million) Forecast, by Application 2019 & 2032
- Table 76: Mexico Neurodegenerative Disease Industry Volume (K Unit) Forecast, by Application 2019 & 2032
- Table 77: Global Neurodegenerative Disease Industry Revenue Million Forecast, by Indication Type 2019 & 2032
- Table 78: Global Neurodegenerative Disease Industry Volume K Unit Forecast, by Indication Type 2019 & 2032
- Table 79: Global Neurodegenerative Disease Industry Revenue Million Forecast, by Drug Type 2019 & 2032
- Table 80: Global Neurodegenerative Disease Industry Volume K Unit Forecast, by Drug Type 2019 & 2032
- Table 81: Global Neurodegenerative Disease Industry Revenue Million Forecast, by Country 2019 & 2032
- Table 82: Global Neurodegenerative Disease Industry Volume K Unit Forecast, by Country 2019 & 2032
- Table 83: Germany Neurodegenerative Disease Industry Revenue (Million) Forecast, by Application 2019 & 2032
- Table 84: Germany Neurodegenerative Disease Industry Volume (K Unit) Forecast, by Application 2019 & 2032
- Table 85: United Kingdom Neurodegenerative Disease Industry Revenue (Million) Forecast, by Application 2019 & 2032
- Table 86: United Kingdom Neurodegenerative Disease Industry Volume (K Unit) Forecast, by Application 2019 & 2032
- Table 87: France Neurodegenerative Disease Industry Revenue (Million) Forecast, by Application 2019 & 2032
- Table 88: France Neurodegenerative Disease Industry Volume (K Unit) Forecast, by Application 2019 & 2032
- Table 89: Italy Neurodegenerative Disease Industry Revenue (Million) Forecast, by Application 2019 & 2032
- Table 90: Italy Neurodegenerative Disease Industry Volume (K Unit) Forecast, by Application 2019 & 2032
- Table 91: Spain Neurodegenerative Disease Industry Revenue (Million) Forecast, by Application 2019 & 2032
- Table 92: Spain Neurodegenerative Disease Industry Volume (K Unit) Forecast, by Application 2019 & 2032
- Table 93: Rest of Europe Neurodegenerative Disease Industry Revenue (Million) Forecast, by Application 2019 & 2032
- Table 94: Rest of Europe Neurodegenerative Disease Industry Volume (K Unit) Forecast, by Application 2019 & 2032
- Table 95: Global Neurodegenerative Disease Industry Revenue Million Forecast, by Indication Type 2019 & 2032
- Table 96: Global Neurodegenerative Disease Industry Volume K Unit Forecast, by Indication Type 2019 & 2032
- Table 97: Global Neurodegenerative Disease Industry Revenue Million Forecast, by Drug Type 2019 & 2032
- Table 98: Global Neurodegenerative Disease Industry Volume K Unit Forecast, by Drug Type 2019 & 2032
- Table 99: Global Neurodegenerative Disease Industry Revenue Million Forecast, by Country 2019 & 2032
- Table 100: Global Neurodegenerative Disease Industry Volume K Unit Forecast, by Country 2019 & 2032
- Table 101: China Neurodegenerative Disease Industry Revenue (Million) Forecast, by Application 2019 & 2032
- Table 102: China Neurodegenerative Disease Industry Volume (K Unit) Forecast, by Application 2019 & 2032
- Table 103: Japan Neurodegenerative Disease Industry Revenue (Million) Forecast, by Application 2019 & 2032
- Table 104: Japan Neurodegenerative Disease Industry Volume (K Unit) Forecast, by Application 2019 & 2032
- Table 105: India Neurodegenerative Disease Industry Revenue (Million) Forecast, by Application 2019 & 2032
- Table 106: India Neurodegenerative Disease Industry Volume (K Unit) Forecast, by Application 2019 & 2032
- Table 107: Australia Neurodegenerative Disease Industry Revenue (Million) Forecast, by Application 2019 & 2032
- Table 108: Australia Neurodegenerative Disease Industry Volume (K Unit) Forecast, by Application 2019 & 2032
- Table 109: South Korea Neurodegenerative Disease Industry Revenue (Million) Forecast, by Application 2019 & 2032
- Table 110: South Korea Neurodegenerative Disease Industry Volume (K Unit) Forecast, by Application 2019 & 2032
- Table 111: Rest of Asia Pacific Neurodegenerative Disease Industry Revenue (Million) Forecast, by Application 2019 & 2032
- Table 112: Rest of Asia Pacific Neurodegenerative Disease Industry Volume (K Unit) Forecast, by Application 2019 & 2032
- Table 113: Global Neurodegenerative Disease Industry Revenue Million Forecast, by Indication Type 2019 & 2032
- Table 114: Global Neurodegenerative Disease Industry Volume K Unit Forecast, by Indication Type 2019 & 2032
- Table 115: Global Neurodegenerative Disease Industry Revenue Million Forecast, by Drug Type 2019 & 2032
- Table 116: Global Neurodegenerative Disease Industry Volume K Unit Forecast, by Drug Type 2019 & 2032
- Table 117: Global Neurodegenerative Disease Industry Revenue Million Forecast, by Country 2019 & 2032
- Table 118: Global Neurodegenerative Disease Industry Volume K Unit Forecast, by Country 2019 & 2032
- Table 119: GCC Neurodegenerative Disease Industry Revenue (Million) Forecast, by Application 2019 & 2032
- Table 120: GCC Neurodegenerative Disease Industry Volume (K Unit) Forecast, by Application 2019 & 2032
- Table 121: South Africa Neurodegenerative Disease Industry Revenue (Million) Forecast, by Application 2019 & 2032
- Table 122: South Africa Neurodegenerative Disease Industry Volume (K Unit) Forecast, by Application 2019 & 2032
- Table 123: Rest of Middle East and Africa Neurodegenerative Disease Industry Revenue (Million) Forecast, by Application 2019 & 2032
- Table 124: Rest of Middle East and Africa Neurodegenerative Disease Industry Volume (K Unit) Forecast, by Application 2019 & 2032
- Table 125: Global Neurodegenerative Disease Industry Revenue Million Forecast, by Indication Type 2019 & 2032
- Table 126: Global Neurodegenerative Disease Industry Volume K Unit Forecast, by Indication Type 2019 & 2032
- Table 127: Global Neurodegenerative Disease Industry Revenue Million Forecast, by Drug Type 2019 & 2032
- Table 128: Global Neurodegenerative Disease Industry Volume K Unit Forecast, by Drug Type 2019 & 2032
- Table 129: Global Neurodegenerative Disease Industry Revenue Million Forecast, by Country 2019 & 2032
- Table 130: Global Neurodegenerative Disease Industry Volume K Unit Forecast, by Country 2019 & 2032
- Table 131: Brazil Neurodegenerative Disease Industry Revenue (Million) Forecast, by Application 2019 & 2032
- Table 132: Brazil Neurodegenerative Disease Industry Volume (K Unit) Forecast, by Application 2019 & 2032
- Table 133: Argentina Neurodegenerative Disease Industry Revenue (Million) Forecast, by Application 2019 & 2032
- Table 134: Argentina Neurodegenerative Disease Industry Volume (K Unit) Forecast, by Application 2019 & 2032
- Table 135: Rest of South America Neurodegenerative Disease Industry Revenue (Million) Forecast, by Application 2019 & 2032
- Table 136: Rest of South America Neurodegenerative Disease Industry Volume (K Unit) Forecast, by Application 2019 & 2032
Frequently Asked Questions
1. What is the projected Compound Annual Growth Rate (CAGR) of the Neurodegenerative Disease Industry?
The projected CAGR is approximately 7.14%.
2. Which companies are prominent players in the Neurodegenerative Disease Industry?
Key companies in the market include Boehringer Ingelheim International GmbH, Novartis AG, Merck & Co Inc, F Hoffmann-La Roche Ltd, Sanofi, Teva Pharmaceutical Industries Ltd, Amneal Pharmaceuticals Inc, AbbVie Inc, Johnson & Johnson Services Inc, UCB S A, Biogen Inc, Pfizer Inc.
3. What are the main segments of the Neurodegenerative Disease Industry?
The market segments include Indication Type, Drug Type.
4. Can you provide details about the market size?
The market size is estimated to be USD 55.12 Million as of 2022.
5. What are some drivers contributing to market growth?
Rising Prevalence of Neurological Disorders; Increasing Public Awareness; Strong Product Pipeline for Neurodegenerative Disease Treatment.
6. What are the notable trends driving market growth?
Alzheimer's Disease is Expected to Witness Significant Growth Over the Forecast Period.
7. Are there any restraints impacting market growth?
Patent Expiry of Neurodegenerative Disease Treatment Products; Stringent Regulatory Guidelines.
8. Can you provide examples of recent developments in the market?
March 2024: Creyon Bio reported a strategic collaboration with Cajal Neuroscience to develop oligonucleotide-based medical solutions targeting various neurodegenerative diseases.
9. What pricing options are available for accessing the report?
Pricing options include single-user, multi-user, and enterprise licenses priced at USD 4750, USD 5250, and USD 8750 respectively.
10. Is the market size provided in terms of value or volume?
The market size is provided in terms of value, measured in Million and volume, measured in K Unit.
11. Are there any specific market keywords associated with the report?
Yes, the market keyword associated with the report is "Neurodegenerative Disease Industry," which aids in identifying and referencing the specific market segment covered.
12. How do I determine which pricing option suits my needs best?
The pricing options vary based on user requirements and access needs. Individual users may opt for single-user licenses, while businesses requiring broader access may choose multi-user or enterprise licenses for cost-effective access to the report.
13. Are there any additional resources or data provided in the Neurodegenerative Disease Industry report?
While the report offers comprehensive insights, it's advisable to review the specific contents or supplementary materials provided to ascertain if additional resources or data are available.
14. How can I stay updated on further developments or reports in the Neurodegenerative Disease Industry?
To stay informed about further developments, trends, and reports in the Neurodegenerative Disease Industry, consider subscribing to industry newsletters, following relevant companies and organizations, or regularly checking reputable industry news sources and publications.
Methodology
Step 1 - Identification of Relevant Samples Size from Population Database


Step 2 - Approaches for Defining Global Market Size (Value, Volume* & Price*)

Note*: In applicable scenarios
Step 3 - Data Sources
Primary Research
- Web Analytics
- Survey Reports
- Research Institute
- Latest Research Reports
- Opinion Leaders
Secondary Research
- Annual Reports
- White Paper
- Latest Press Release
- Industry Association
- Paid Database
- Investor Presentations

Step 4 - Data Triangulation
Involves using different sources of information in order to increase the validity of a study
These sources are likely to be stakeholders in a program - participants, other researchers, program staff, other community members, and so on.
Then we put all data in single framework & apply various statistical tools to find out the dynamic on the market.
During the analysis stage, feedback from the stakeholder groups would be compared to determine areas of agreement as well as areas of divergence
