

Key Insights
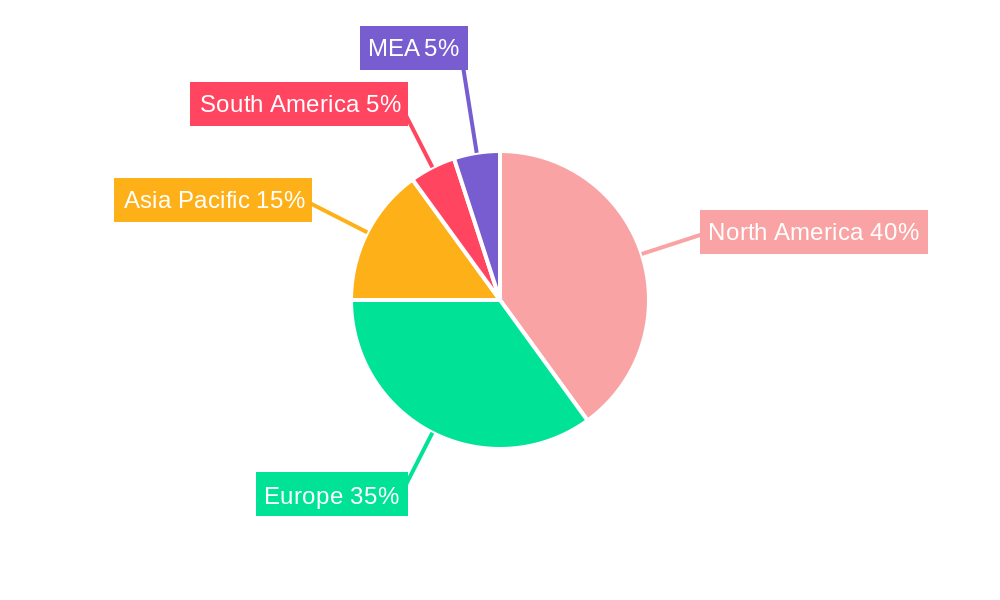
The neurophotonics market, encompassing technologies like microscopy, spectroscopy, and multimodal imaging for neurological research and clinical applications, is experiencing robust growth. Driven by advancements in optical imaging techniques, increasing prevalence of neurological disorders, and the rising demand for minimally invasive diagnostic and therapeutic procedures, the market is projected to expand significantly over the forecast period (2025-2033). The 11% CAGR indicates a substantial increase in market value, likely fueled by the ongoing development of sophisticated neurophotonics tools capable of providing higher resolution, faster imaging speeds, and deeper tissue penetration. Significant investment in research and development, particularly in areas such as functional near-infrared spectroscopy (fNIRS) and advanced microscopy techniques, further contributes to this expansion. The market segmentation reveals a strong focus on research applications, owing to the need for better understanding of brain function and disease mechanisms. However, the diagnostics and therapeutics segments are also demonstrating substantial growth potential, driven by the translation of research findings into clinical applications, leading to improved diagnostic capabilities and novel therapeutic approaches for neurological disorders. Geographic analysis suggests a significant market presence across North America and Europe, largely due to established research infrastructure and higher healthcare expenditure. However, the Asia-Pacific region is anticipated to witness rapid expansion, propelled by increasing healthcare investments and growing awareness of neurological diseases.
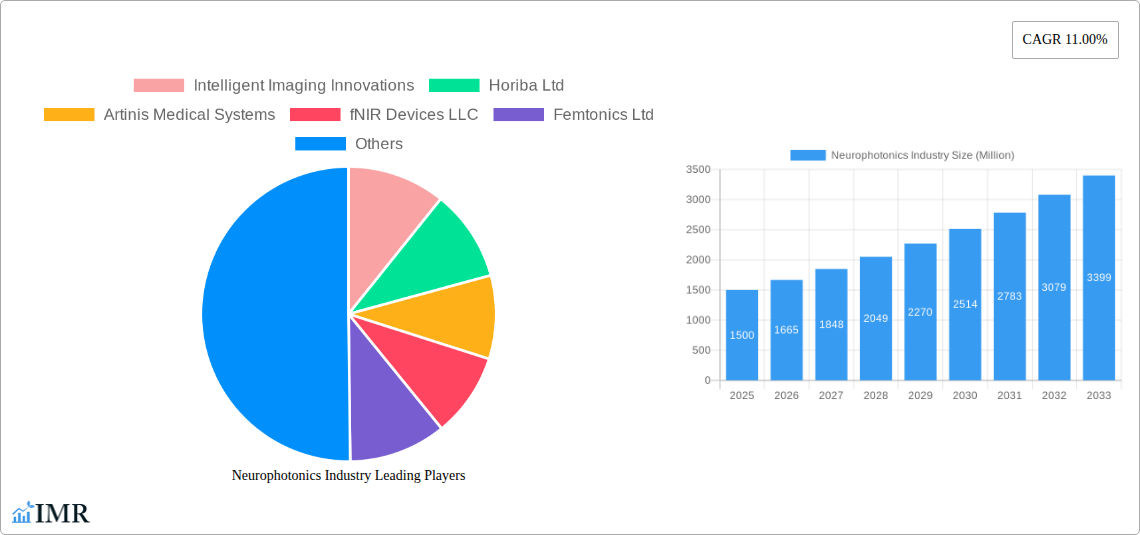
The competitive landscape features established players like Carl Zeiss AG and Leica Microsystems alongside innovative companies such as Intelligent Imaging Innovations and Artinis Medical Systems. These companies are actively engaged in developing advanced neurophotonics technologies and expanding their market reach through strategic partnerships, collaborations, and product launches. The continued development of advanced imaging modalities, coupled with increased regulatory approvals for neurophotonics-based diagnostic and therapeutic devices, will significantly shape the market’s trajectory. Challenges remain, including the high cost of equipment and the need for skilled professionals to operate and interpret the data generated by these sophisticated systems. Nevertheless, ongoing technological advancements and increasing demand are expected to overcome these challenges, contributing to the sustained growth of the neurophotonics market in the coming years. Further research into specific applications such as Alzheimer's disease, Parkinson's disease and brain trauma will further contribute to market growth.
Neurophotonics Industry Market Report: 2019-2033
This comprehensive report provides an in-depth analysis of the Neurophotonics industry, encompassing market dynamics, growth trends, leading players, and future outlook. The study period spans from 2019 to 2033, with a base year of 2025 and a forecast period from 2025 to 2033. The report meticulously examines the parent market (Medical Imaging & Diagnostics) and its child market (Neurophotonics) to deliver a holistic view of this rapidly evolving sector. Market values are presented in million USD.
Neurophotonics Industry Market Dynamics & Structure
The neurophotonics market is characterized by a moderately concentrated landscape, with a handful of major players and several smaller niche companies. Technological innovation, particularly in areas like advanced microscopy and spectroscopy, is a key driver. Stringent regulatory approvals for medical devices pose a challenge, impacting market entry and expansion. Competitive pressures arise from alternative neuroimaging techniques, such as fMRI and EEG. The market is driven by an aging global population with increasing neurological disorders and growing research funding for brain-related studies. Mergers and acquisitions (M&A) activity has been relatively modest in recent years, with xx deals recorded between 2019-2024, resulting in a market concentration of approximately xx%.
- Market Concentration: Moderately Concentrated (xx%)
- Innovation Drivers: Advanced Microscopy, Spectroscopy, Multimodal Imaging
- Regulatory Landscape: Stringent, impacting market entry.
- Competitive Substitutes: fMRI, EEG, PET
- End-User Demographics: Aging population, increasing prevalence of neurological disorders.
- M&A Activity: xx deals (2019-2024), resulting in consolidation of xx%.
Neurophotonics Industry Growth Trends & Insights
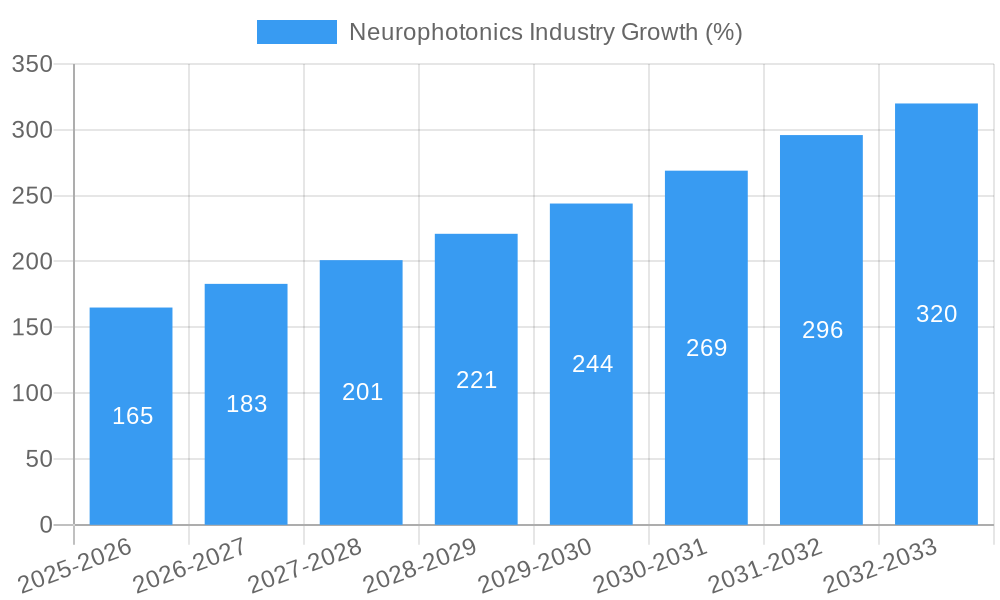
The neurophotonics market is experiencing robust growth, driven by increasing demand for non-invasive brain imaging techniques. The market size expanded from xx million in 2019 to xx million in 2024, exhibiting a Compound Annual Growth Rate (CAGR) of xx%. This growth is fueled by technological advancements, rising research investments, and growing awareness of neurological diseases. Market penetration is currently at xx% in developed economies and expected to increase to xx% by 2033. Technological disruptions such as AI-powered image analysis and miniaturized devices are further accelerating adoption rates. Consumer behavior shifts towards personalized medicine and early diagnosis are also contributing to market expansion. The forecast for 2025-2033 anticipates a CAGR of xx%, reaching a market size of xx million by 2033.
Dominant Regions, Countries, or Segments in Neurophotonics Industry
North America currently dominates the neurophotonics market, holding a market share of xx% in 2024, followed by Europe (xx%) and Asia-Pacific (xx%). This dominance is attributed to higher research funding, advanced healthcare infrastructure, and a large patient pool. Within system types, Microscopy holds the largest segment, accounting for xx% of the market in 2024, followed by Spectroscopy (xx%) and Multimodal (xx%). In applications, Research accounts for the largest share, due to extensive research in neuroscience. However, Diagnostics and Therapeutics segments are projected for significant growth in the forecast period.
- Key Drivers (North America): Robust research funding, advanced healthcare infrastructure, large patient pool.
- Key Drivers (Europe): Growing government initiatives for healthcare technology, rising neurological disease prevalence.
- Key Drivers (Asia-Pacific): Increasing healthcare expenditure, rising awareness of neurological disorders.
- Dominant Segment (System Type): Microscopy (xx%)
- Dominant Segment (Application): Research (xx%)
Neurophotonics Industry Product Landscape
The neurophotonics market offers a diverse range of products, including advanced microscopes, spectrometers, and multimodal imaging systems. These products are characterized by high sensitivity, resolution, and speed. Recent innovations include miniaturized probes for improved patient comfort, AI-powered image analysis for faster and more accurate diagnosis, and integrated systems combining multiple imaging modalities for comprehensive brain analysis. Unique selling propositions often center around improved image quality, ease of use, and specialized applications for specific neurological conditions.
Key Drivers, Barriers & Challenges in Neurophotonics Industry
Key Drivers: Increased prevalence of neurological diseases, growing demand for non-invasive diagnostic tools, technological advancements (e.g., AI-powered image analysis, miniaturization), and substantial R&D investment in neuroscience.
Key Challenges: High cost of equipment, stringent regulatory approvals, skilled personnel shortages, competition from alternative technologies, and potential supply chain disruptions (estimated to impact market growth by xx% in 2026).
Emerging Opportunities in Neurophotonics Industry
Emerging opportunities lie in the development of portable and wearable neurophotonics devices, expanding applications in personalized medicine, and the integration of neurophotonics with other advanced technologies like artificial intelligence and virtual reality. Untapped markets in low and middle-income countries also present significant potential for growth.
Growth Accelerators in the Neurophotonics Industry
Technological breakthroughs, strategic collaborations between research institutions and industry players, and market expansion strategies targeting emerging economies are key catalysts for sustained long-term growth in the neurophotonics market. Continued investment in R&D and the development of innovative applications will further fuel market expansion.
Key Players Shaping the Neurophotonics Industry Market
- Intelligent Imaging Innovations
- Horiba Ltd
- Artinis Medical Systems
- fNIR Devices LLC
- Femtonics Ltd
- Cairn Research
- Hitachi Ltd
- Carl Zeiss AG
- Leica Microsystems
- HemoPhotonics
Notable Milestones in Neurophotonics Industry Sector
- 2020: Launch of a new generation of high-resolution multi-modal neuroimaging system by Carl Zeiss AG.
- 2022: Acquisition of a smaller neurophotonics company by Horiba Ltd, expanding their product portfolio.
- 2023: FDA approval of a new neurophotonics-based diagnostic device. (Specific details not provided, using placeholder.)
- 2024: Several key partnerships formed between research institutions and neurophotonics companies.
In-Depth Neurophotonics Industry Market Outlook
The neurophotonics market is poised for significant growth in the coming years, driven by continuous technological advancements, rising prevalence of neurological disorders, and increased investments in neuroscience research. Strategic partnerships, targeted market expansion, and a focus on developing innovative applications will shape the future of this dynamic sector. The market's potential is substantial, particularly in emerging economies with growing healthcare infrastructure and a rising demand for advanced medical technologies.
Neurophotonics Industry Segmentation
-
1. System Type
- 1.1. Microscopy
- 1.2. Spectroscopy
- 1.3. Multimodal
- 1.4. Other System Type
-
2. Application
- 2.1. Research
- 2.2. Diagnostics
- 2.3. Therapeutics
Neurophotonics Industry Segmentation By Geography
- 1. North America
- 2. Europe
- 3. Asia Pacific
- 4. Rest of World
Neurophotonics Industry REPORT HIGHLIGHTS
| Aspects | Details |
|---|---|
| Study Period | 2019-2033 |
| Base Year | 2024 |
| Estimated Year | 2025 |
| Forecast Period | 2025-2033 |
| Historical Period | 2019-2024 |
| Growth Rate | CAGR of 11.00% from 2019-2033 |
| Segmentation |
|
Table of Contents
- 1. Introduction
- 1.1. Research Scope
- 1.2. Market Segmentation
- 1.3. Research Methodology
- 1.4. Definitions and Assumptions
- 2. Executive Summary
- 2.1. Introduction
- 3. Market Dynamics
- 3.1. Introduction
- 3.2. Market Drivers
- 3.2.1. ; Increasing Government Initiative for Research and Development; Technological Advancement in Pain Detection Technology
- 3.3. Market Restrains
- 3.3.1. ; Accessing the Human Brain in Live Individuals is Difficult
- 3.4. Market Trends
- 3.4.1. Increasing Research Activities Offers Potential Growth
- 4. Market Factor Analysis
- 4.1. Porters Five Forces
- 4.2. Supply/Value Chain
- 4.3. PESTEL analysis
- 4.4. Market Entropy
- 4.5. Patent/Trademark Analysis
- 5. Global Neurophotonics Industry Analysis, Insights and Forecast, 2019-2031
- 5.1. Market Analysis, Insights and Forecast - by System Type
- 5.1.1. Microscopy
- 5.1.2. Spectroscopy
- 5.1.3. Multimodal
- 5.1.4. Other System Type
- 5.2. Market Analysis, Insights and Forecast - by Application
- 5.2.1. Research
- 5.2.2. Diagnostics
- 5.2.3. Therapeutics
- 5.3. Market Analysis, Insights and Forecast - by Region
- 5.3.1. North America
- 5.3.2. Europe
- 5.3.3. Asia Pacific
- 5.3.4. Rest of World
- 5.1. Market Analysis, Insights and Forecast - by System Type
- 6. North America Neurophotonics Industry Analysis, Insights and Forecast, 2019-2031
- 6.1. Market Analysis, Insights and Forecast - by System Type
- 6.1.1. Microscopy
- 6.1.2. Spectroscopy
- 6.1.3. Multimodal
- 6.1.4. Other System Type
- 6.2. Market Analysis, Insights and Forecast - by Application
- 6.2.1. Research
- 6.2.2. Diagnostics
- 6.2.3. Therapeutics
- 6.1. Market Analysis, Insights and Forecast - by System Type
- 7. Europe Neurophotonics Industry Analysis, Insights and Forecast, 2019-2031
- 7.1. Market Analysis, Insights and Forecast - by System Type
- 7.1.1. Microscopy
- 7.1.2. Spectroscopy
- 7.1.3. Multimodal
- 7.1.4. Other System Type
- 7.2. Market Analysis, Insights and Forecast - by Application
- 7.2.1. Research
- 7.2.2. Diagnostics
- 7.2.3. Therapeutics
- 7.1. Market Analysis, Insights and Forecast - by System Type
- 8. Asia Pacific Neurophotonics Industry Analysis, Insights and Forecast, 2019-2031
- 8.1. Market Analysis, Insights and Forecast - by System Type
- 8.1.1. Microscopy
- 8.1.2. Spectroscopy
- 8.1.3. Multimodal
- 8.1.4. Other System Type
- 8.2. Market Analysis, Insights and Forecast - by Application
- 8.2.1. Research
- 8.2.2. Diagnostics
- 8.2.3. Therapeutics
- 8.1. Market Analysis, Insights and Forecast - by System Type
- 9. Rest of World Neurophotonics Industry Analysis, Insights and Forecast, 2019-2031
- 9.1. Market Analysis, Insights and Forecast - by System Type
- 9.1.1. Microscopy
- 9.1.2. Spectroscopy
- 9.1.3. Multimodal
- 9.1.4. Other System Type
- 9.2. Market Analysis, Insights and Forecast - by Application
- 9.2.1. Research
- 9.2.2. Diagnostics
- 9.2.3. Therapeutics
- 9.1. Market Analysis, Insights and Forecast - by System Type
- 10. North America Neurophotonics Industry Analysis, Insights and Forecast, 2019-2031
- 10.1. Market Analysis, Insights and Forecast - By Country/Sub-region
- 10.1.1. undefined
- 11. Europe Neurophotonics Industry Analysis, Insights and Forecast, 2019-2031
- 11.1. Market Analysis, Insights and Forecast - By Country/Sub-region
- 11.1.1. undefined
- 12. Asia Pacific Neurophotonics Industry Analysis, Insights and Forecast, 2019-2031
- 12.1. Market Analysis, Insights and Forecast - By Country/Sub-region
- 12.1.1. undefined
- 13. South America Neurophotonics Industry Analysis, Insights and Forecast, 2019-2031
- 13.1. Market Analysis, Insights and Forecast - By Country/Sub-region
- 13.1.1. undefined
- 14. North America Neurophotonics Industry Analysis, Insights and Forecast, 2019-2031
- 14.1. Market Analysis, Insights and Forecast - By Country/Sub-region
- 14.1.1. undefined
- 15. MEA Neurophotonics Industry Analysis, Insights and Forecast, 2019-2031
- 15.1. Market Analysis, Insights and Forecast - By Country/Sub-region
- 15.1.1. undefined
- 16. Competitive Analysis
- 16.1. Global Market Share Analysis 2024
- 16.2. Company Profiles
- 16.2.1 Intelligent Imaging Innovations
- 16.2.1.1. Overview
- 16.2.1.2. Products
- 16.2.1.3. SWOT Analysis
- 16.2.1.4. Recent Developments
- 16.2.1.5. Financials (Based on Availability)
- 16.2.2 Horiba Ltd
- 16.2.2.1. Overview
- 16.2.2.2. Products
- 16.2.2.3. SWOT Analysis
- 16.2.2.4. Recent Developments
- 16.2.2.5. Financials (Based on Availability)
- 16.2.3 Artinis Medical Systems
- 16.2.3.1. Overview
- 16.2.3.2. Products
- 16.2.3.3. SWOT Analysis
- 16.2.3.4. Recent Developments
- 16.2.3.5. Financials (Based on Availability)
- 16.2.4 fNIR Devices LLC
- 16.2.4.1. Overview
- 16.2.4.2. Products
- 16.2.4.3. SWOT Analysis
- 16.2.4.4. Recent Developments
- 16.2.4.5. Financials (Based on Availability)
- 16.2.5 Femtonics Ltd
- 16.2.5.1. Overview
- 16.2.5.2. Products
- 16.2.5.3. SWOT Analysis
- 16.2.5.4. Recent Developments
- 16.2.5.5. Financials (Based on Availability)
- 16.2.6 Cairn Research
- 16.2.6.1. Overview
- 16.2.6.2. Products
- 16.2.6.3. SWOT Analysis
- 16.2.6.4. Recent Developments
- 16.2.6.5. Financials (Based on Availability)
- 16.2.7 Hitachi Ltd
- 16.2.7.1. Overview
- 16.2.7.2. Products
- 16.2.7.3. SWOT Analysis
- 16.2.7.4. Recent Developments
- 16.2.7.5. Financials (Based on Availability)
- 16.2.8 Carl Zeiss AG
- 16.2.8.1. Overview
- 16.2.8.2. Products
- 16.2.8.3. SWOT Analysis
- 16.2.8.4. Recent Developments
- 16.2.8.5. Financials (Based on Availability)
- 16.2.9 Leica Microsystems
- 16.2.9.1. Overview
- 16.2.9.2. Products
- 16.2.9.3. SWOT Analysis
- 16.2.9.4. Recent Developments
- 16.2.9.5. Financials (Based on Availability)
- 16.2.10 HemoPhotonics
- 16.2.10.1. Overview
- 16.2.10.2. Products
- 16.2.10.3. SWOT Analysis
- 16.2.10.4. Recent Developments
- 16.2.10.5. Financials (Based on Availability)
- 16.2.1 Intelligent Imaging Innovations
List of Figures
- Figure 1: Global Neurophotonics Industry Revenue Breakdown (Million, %) by Region 2024 & 2032
- Figure 2: Global Neurophotonics Industry Volume Breakdown (K Unit, %) by Region 2024 & 2032
- Figure 3: North America Neurophotonics Industry Revenue (Million), by Country 2024 & 2032
- Figure 4: North America Neurophotonics Industry Volume (K Unit), by Country 2024 & 2032
- Figure 5: North America Neurophotonics Industry Revenue Share (%), by Country 2024 & 2032
- Figure 6: North America Neurophotonics Industry Volume Share (%), by Country 2024 & 2032
- Figure 7: Europe Neurophotonics Industry Revenue (Million), by Country 2024 & 2032
- Figure 8: Europe Neurophotonics Industry Volume (K Unit), by Country 2024 & 2032
- Figure 9: Europe Neurophotonics Industry Revenue Share (%), by Country 2024 & 2032
- Figure 10: Europe Neurophotonics Industry Volume Share (%), by Country 2024 & 2032
- Figure 11: Asia Pacific Neurophotonics Industry Revenue (Million), by Country 2024 & 2032
- Figure 12: Asia Pacific Neurophotonics Industry Volume (K Unit), by Country 2024 & 2032
- Figure 13: Asia Pacific Neurophotonics Industry Revenue Share (%), by Country 2024 & 2032
- Figure 14: Asia Pacific Neurophotonics Industry Volume Share (%), by Country 2024 & 2032
- Figure 15: South America Neurophotonics Industry Revenue (Million), by Country 2024 & 2032
- Figure 16: South America Neurophotonics Industry Volume (K Unit), by Country 2024 & 2032
- Figure 17: South America Neurophotonics Industry Revenue Share (%), by Country 2024 & 2032
- Figure 18: South America Neurophotonics Industry Volume Share (%), by Country 2024 & 2032
- Figure 19: North America Neurophotonics Industry Revenue (Million), by Country 2024 & 2032
- Figure 20: North America Neurophotonics Industry Volume (K Unit), by Country 2024 & 2032
- Figure 21: North America Neurophotonics Industry Revenue Share (%), by Country 2024 & 2032
- Figure 22: North America Neurophotonics Industry Volume Share (%), by Country 2024 & 2032
- Figure 23: MEA Neurophotonics Industry Revenue (Million), by Country 2024 & 2032
- Figure 24: MEA Neurophotonics Industry Volume (K Unit), by Country 2024 & 2032
- Figure 25: MEA Neurophotonics Industry Revenue Share (%), by Country 2024 & 2032
- Figure 26: MEA Neurophotonics Industry Volume Share (%), by Country 2024 & 2032
- Figure 27: North America Neurophotonics Industry Revenue (Million), by System Type 2024 & 2032
- Figure 28: North America Neurophotonics Industry Volume (K Unit), by System Type 2024 & 2032
- Figure 29: North America Neurophotonics Industry Revenue Share (%), by System Type 2024 & 2032
- Figure 30: North America Neurophotonics Industry Volume Share (%), by System Type 2024 & 2032
- Figure 31: North America Neurophotonics Industry Revenue (Million), by Application 2024 & 2032
- Figure 32: North America Neurophotonics Industry Volume (K Unit), by Application 2024 & 2032
- Figure 33: North America Neurophotonics Industry Revenue Share (%), by Application 2024 & 2032
- Figure 34: North America Neurophotonics Industry Volume Share (%), by Application 2024 & 2032
- Figure 35: North America Neurophotonics Industry Revenue (Million), by Country 2024 & 2032
- Figure 36: North America Neurophotonics Industry Volume (K Unit), by Country 2024 & 2032
- Figure 37: North America Neurophotonics Industry Revenue Share (%), by Country 2024 & 2032
- Figure 38: North America Neurophotonics Industry Volume Share (%), by Country 2024 & 2032
- Figure 39: Europe Neurophotonics Industry Revenue (Million), by System Type 2024 & 2032
- Figure 40: Europe Neurophotonics Industry Volume (K Unit), by System Type 2024 & 2032
- Figure 41: Europe Neurophotonics Industry Revenue Share (%), by System Type 2024 & 2032
- Figure 42: Europe Neurophotonics Industry Volume Share (%), by System Type 2024 & 2032
- Figure 43: Europe Neurophotonics Industry Revenue (Million), by Application 2024 & 2032
- Figure 44: Europe Neurophotonics Industry Volume (K Unit), by Application 2024 & 2032
- Figure 45: Europe Neurophotonics Industry Revenue Share (%), by Application 2024 & 2032
- Figure 46: Europe Neurophotonics Industry Volume Share (%), by Application 2024 & 2032
- Figure 47: Europe Neurophotonics Industry Revenue (Million), by Country 2024 & 2032
- Figure 48: Europe Neurophotonics Industry Volume (K Unit), by Country 2024 & 2032
- Figure 49: Europe Neurophotonics Industry Revenue Share (%), by Country 2024 & 2032
- Figure 50: Europe Neurophotonics Industry Volume Share (%), by Country 2024 & 2032
- Figure 51: Asia Pacific Neurophotonics Industry Revenue (Million), by System Type 2024 & 2032
- Figure 52: Asia Pacific Neurophotonics Industry Volume (K Unit), by System Type 2024 & 2032
- Figure 53: Asia Pacific Neurophotonics Industry Revenue Share (%), by System Type 2024 & 2032
- Figure 54: Asia Pacific Neurophotonics Industry Volume Share (%), by System Type 2024 & 2032
- Figure 55: Asia Pacific Neurophotonics Industry Revenue (Million), by Application 2024 & 2032
- Figure 56: Asia Pacific Neurophotonics Industry Volume (K Unit), by Application 2024 & 2032
- Figure 57: Asia Pacific Neurophotonics Industry Revenue Share (%), by Application 2024 & 2032
- Figure 58: Asia Pacific Neurophotonics Industry Volume Share (%), by Application 2024 & 2032
- Figure 59: Asia Pacific Neurophotonics Industry Revenue (Million), by Country 2024 & 2032
- Figure 60: Asia Pacific Neurophotonics Industry Volume (K Unit), by Country 2024 & 2032
- Figure 61: Asia Pacific Neurophotonics Industry Revenue Share (%), by Country 2024 & 2032
- Figure 62: Asia Pacific Neurophotonics Industry Volume Share (%), by Country 2024 & 2032
- Figure 63: Rest of World Neurophotonics Industry Revenue (Million), by System Type 2024 & 2032
- Figure 64: Rest of World Neurophotonics Industry Volume (K Unit), by System Type 2024 & 2032
- Figure 65: Rest of World Neurophotonics Industry Revenue Share (%), by System Type 2024 & 2032
- Figure 66: Rest of World Neurophotonics Industry Volume Share (%), by System Type 2024 & 2032
- Figure 67: Rest of World Neurophotonics Industry Revenue (Million), by Application 2024 & 2032
- Figure 68: Rest of World Neurophotonics Industry Volume (K Unit), by Application 2024 & 2032
- Figure 69: Rest of World Neurophotonics Industry Revenue Share (%), by Application 2024 & 2032
- Figure 70: Rest of World Neurophotonics Industry Volume Share (%), by Application 2024 & 2032
- Figure 71: Rest of World Neurophotonics Industry Revenue (Million), by Country 2024 & 2032
- Figure 72: Rest of World Neurophotonics Industry Volume (K Unit), by Country 2024 & 2032
- Figure 73: Rest of World Neurophotonics Industry Revenue Share (%), by Country 2024 & 2032
- Figure 74: Rest of World Neurophotonics Industry Volume Share (%), by Country 2024 & 2032
List of Tables
- Table 1: Global Neurophotonics Industry Revenue Million Forecast, by Region 2019 & 2032
- Table 2: Global Neurophotonics Industry Volume K Unit Forecast, by Region 2019 & 2032
- Table 3: Global Neurophotonics Industry Revenue Million Forecast, by System Type 2019 & 2032
- Table 4: Global Neurophotonics Industry Volume K Unit Forecast, by System Type 2019 & 2032
- Table 5: Global Neurophotonics Industry Revenue Million Forecast, by Application 2019 & 2032
- Table 6: Global Neurophotonics Industry Volume K Unit Forecast, by Application 2019 & 2032
- Table 7: Global Neurophotonics Industry Revenue Million Forecast, by Region 2019 & 2032
- Table 8: Global Neurophotonics Industry Volume K Unit Forecast, by Region 2019 & 2032
- Table 9: Global Neurophotonics Industry Revenue Million Forecast, by Country 2019 & 2032
- Table 10: Global Neurophotonics Industry Volume K Unit Forecast, by Country 2019 & 2032
- Table 11: Global Neurophotonics Industry Revenue Million Forecast, by Country 2019 & 2032
- Table 12: Global Neurophotonics Industry Volume K Unit Forecast, by Country 2019 & 2032
- Table 13: Global Neurophotonics Industry Revenue Million Forecast, by Country 2019 & 2032
- Table 14: Global Neurophotonics Industry Volume K Unit Forecast, by Country 2019 & 2032
- Table 15: Global Neurophotonics Industry Revenue Million Forecast, by Country 2019 & 2032
- Table 16: Global Neurophotonics Industry Volume K Unit Forecast, by Country 2019 & 2032
- Table 17: Global Neurophotonics Industry Revenue Million Forecast, by Country 2019 & 2032
- Table 18: Global Neurophotonics Industry Volume K Unit Forecast, by Country 2019 & 2032
- Table 19: Global Neurophotonics Industry Revenue Million Forecast, by Country 2019 & 2032
- Table 20: Global Neurophotonics Industry Volume K Unit Forecast, by Country 2019 & 2032
- Table 21: Global Neurophotonics Industry Revenue Million Forecast, by System Type 2019 & 2032
- Table 22: Global Neurophotonics Industry Volume K Unit Forecast, by System Type 2019 & 2032
- Table 23: Global Neurophotonics Industry Revenue Million Forecast, by Application 2019 & 2032
- Table 24: Global Neurophotonics Industry Volume K Unit Forecast, by Application 2019 & 2032
- Table 25: Global Neurophotonics Industry Revenue Million Forecast, by Country 2019 & 2032
- Table 26: Global Neurophotonics Industry Volume K Unit Forecast, by Country 2019 & 2032
- Table 27: Global Neurophotonics Industry Revenue Million Forecast, by System Type 2019 & 2032
- Table 28: Global Neurophotonics Industry Volume K Unit Forecast, by System Type 2019 & 2032
- Table 29: Global Neurophotonics Industry Revenue Million Forecast, by Application 2019 & 2032
- Table 30: Global Neurophotonics Industry Volume K Unit Forecast, by Application 2019 & 2032
- Table 31: Global Neurophotonics Industry Revenue Million Forecast, by Country 2019 & 2032
- Table 32: Global Neurophotonics Industry Volume K Unit Forecast, by Country 2019 & 2032
- Table 33: Global Neurophotonics Industry Revenue Million Forecast, by System Type 2019 & 2032
- Table 34: Global Neurophotonics Industry Volume K Unit Forecast, by System Type 2019 & 2032
- Table 35: Global Neurophotonics Industry Revenue Million Forecast, by Application 2019 & 2032
- Table 36: Global Neurophotonics Industry Volume K Unit Forecast, by Application 2019 & 2032
- Table 37: Global Neurophotonics Industry Revenue Million Forecast, by Country 2019 & 2032
- Table 38: Global Neurophotonics Industry Volume K Unit Forecast, by Country 2019 & 2032
- Table 39: Global Neurophotonics Industry Revenue Million Forecast, by System Type 2019 & 2032
- Table 40: Global Neurophotonics Industry Volume K Unit Forecast, by System Type 2019 & 2032
- Table 41: Global Neurophotonics Industry Revenue Million Forecast, by Application 2019 & 2032
- Table 42: Global Neurophotonics Industry Volume K Unit Forecast, by Application 2019 & 2032
- Table 43: Global Neurophotonics Industry Revenue Million Forecast, by Country 2019 & 2032
- Table 44: Global Neurophotonics Industry Volume K Unit Forecast, by Country 2019 & 2032
Frequently Asked Questions
1. What is the projected Compound Annual Growth Rate (CAGR) of the Neurophotonics Industry?
The projected CAGR is approximately 11.00%.
2. Which companies are prominent players in the Neurophotonics Industry?
Key companies in the market include Intelligent Imaging Innovations, Horiba Ltd, Artinis Medical Systems, fNIR Devices LLC, Femtonics Ltd, Cairn Research, Hitachi Ltd , Carl Zeiss AG, Leica Microsystems, HemoPhotonics.
3. What are the main segments of the Neurophotonics Industry?
The market segments include System Type, Application.
4. Can you provide details about the market size?
The market size is estimated to be USD XX Million as of 2022.
5. What are some drivers contributing to market growth?
; Increasing Government Initiative for Research and Development; Technological Advancement in Pain Detection Technology.
6. What are the notable trends driving market growth?
Increasing Research Activities Offers Potential Growth.
7. Are there any restraints impacting market growth?
; Accessing the Human Brain in Live Individuals is Difficult.
8. Can you provide examples of recent developments in the market?
N/A
9. What pricing options are available for accessing the report?
Pricing options include single-user, multi-user, and enterprise licenses priced at USD 4750, USD 5250, and USD 8750 respectively.
10. Is the market size provided in terms of value or volume?
The market size is provided in terms of value, measured in Million and volume, measured in K Unit.
11. Are there any specific market keywords associated with the report?
Yes, the market keyword associated with the report is "Neurophotonics Industry," which aids in identifying and referencing the specific market segment covered.
12. How do I determine which pricing option suits my needs best?
The pricing options vary based on user requirements and access needs. Individual users may opt for single-user licenses, while businesses requiring broader access may choose multi-user or enterprise licenses for cost-effective access to the report.
13. Are there any additional resources or data provided in the Neurophotonics Industry report?
While the report offers comprehensive insights, it's advisable to review the specific contents or supplementary materials provided to ascertain if additional resources or data are available.
14. How can I stay updated on further developments or reports in the Neurophotonics Industry?
To stay informed about further developments, trends, and reports in the Neurophotonics Industry, consider subscribing to industry newsletters, following relevant companies and organizations, or regularly checking reputable industry news sources and publications.
Methodology
Step 1 - Identification of Relevant Samples Size from Population Database


Step 2 - Approaches for Defining Global Market Size (Value, Volume* & Price*)

Note*: In applicable scenarios
Step 3 - Data Sources
Primary Research
- Web Analytics
- Survey Reports
- Research Institute
- Latest Research Reports
- Opinion Leaders
Secondary Research
- Annual Reports
- White Paper
- Latest Press Release
- Industry Association
- Paid Database
- Investor Presentations

Step 4 - Data Triangulation
Involves using different sources of information in order to increase the validity of a study
These sources are likely to be stakeholders in a program - participants, other researchers, program staff, other community members, and so on.
Then we put all data in single framework & apply various statistical tools to find out the dynamic on the market.
During the analysis stage, feedback from the stakeholder groups would be compared to determine areas of agreement as well as areas of divergence
