

Key Insights
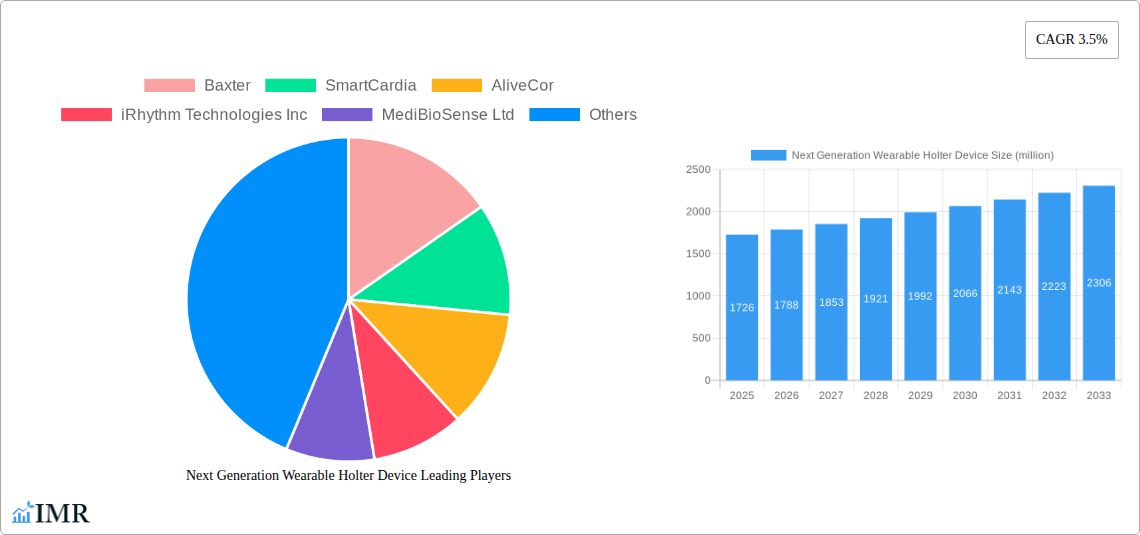
The Next Generation Wearable Holter Monitor market is experiencing robust growth, projected to reach $1726 million in 2025 and expanding steadily throughout the forecast period (2025-2033). A compound annual growth rate (CAGR) of 3.5% indicates consistent market expansion driven by several key factors. The increasing prevalence of cardiovascular diseases globally necessitates continuous monitoring, making these advanced, comfortable, and user-friendly devices increasingly attractive to both patients and healthcare providers. Technological advancements, such as improved sensor accuracy, longer battery life, and enhanced data analytics capabilities, are further fueling market growth. Furthermore, the rising adoption of telehealth and remote patient monitoring programs contributes significantly to the expanding market demand. The segment breakdown, while not explicitly provided, can be reasonably inferred to include variations in device functionality (e.g., single-lead vs. multi-lead), data transmission capabilities (e.g., Bluetooth vs. cellular), and target patient populations (e.g., adults vs. pediatrics). This segmentation creates opportunities for specialized device manufacturers. While challenges such as regulatory hurdles and pricing pressures exist, the overall market outlook remains positive due to the growing need for effective and accessible cardiac monitoring solutions.
The competitive landscape is marked by a mix of established players like Baxter and Philips, alongside innovative companies such as AliveCor and iRhythm Technologies. These companies are actively engaged in developing cutting-edge technology, forming strategic partnerships, and expanding their global reach. The success of individual companies hinges on their ability to offer superior device performance, seamless integration with existing healthcare infrastructure, user-friendly interfaces, and robust data analytics platforms. Future market expansion will depend on further technological advancements, the development of AI-driven diagnostic tools integrated within the devices, and the continued broadening of reimbursement policies for remote cardiac monitoring. This will ultimately lead to wider adoption and improved patient outcomes, reinforcing the positive growth trajectory of the Next Generation Wearable Holter Monitor market.
Next Generation Wearable Holter Device Market Report: 2019-2033
This comprehensive report provides an in-depth analysis of the Next Generation Wearable Holter Device market, encompassing market dynamics, growth trends, regional analysis, product landscape, challenges, opportunities, and key players. The study period covers 2019-2033, with a base year of 2025 and a forecast period of 2025-2033. The report is crucial for industry professionals, investors, and strategic decision-makers seeking a complete understanding of this rapidly evolving market. Parent market (Cardiac Monitoring Devices) and child market (Wearable Cardiac Monitoring Devices) are analyzed to offer a holistic perspective.
Next Generation Wearable Holter Device Market Dynamics & Structure
This section analyzes the market's competitive landscape, technological advancements, regulatory influences, and market forces shaping its evolution. The market is moderately fragmented, with key players holding significant, but not dominant, market share.
- Market Concentration: Moderate fragmentation; top 5 players hold approximately xx% of the market share in 2025 (Estimated Year).
- Technological Innovation: AI-powered arrhythmia detection, improved sensor technology, miniaturization, and enhanced data analytics are key drivers.
- Regulatory Frameworks: Stringent regulatory approvals (e.g., FDA, CE marking) influence market entry and product development. Variations in regulations across regions impact market penetration.
- Competitive Product Substitutes: Traditional Holter monitors and other cardiac monitoring technologies represent competitive substitutes.
- End-User Demographics: Growing geriatric population and rising prevalence of cardiovascular diseases are key drivers of market growth.
- M&A Trends: The past five years have seen xx M&A deals in the wearable cardiac monitoring space, primarily focused on technology integration and market expansion. This trend is expected to continue.
- Innovation Barriers: High R&D costs, stringent regulatory requirements, and the need for robust clinical validation pose significant challenges to innovation.
Next Generation Wearable Holter Device Growth Trends & Insights
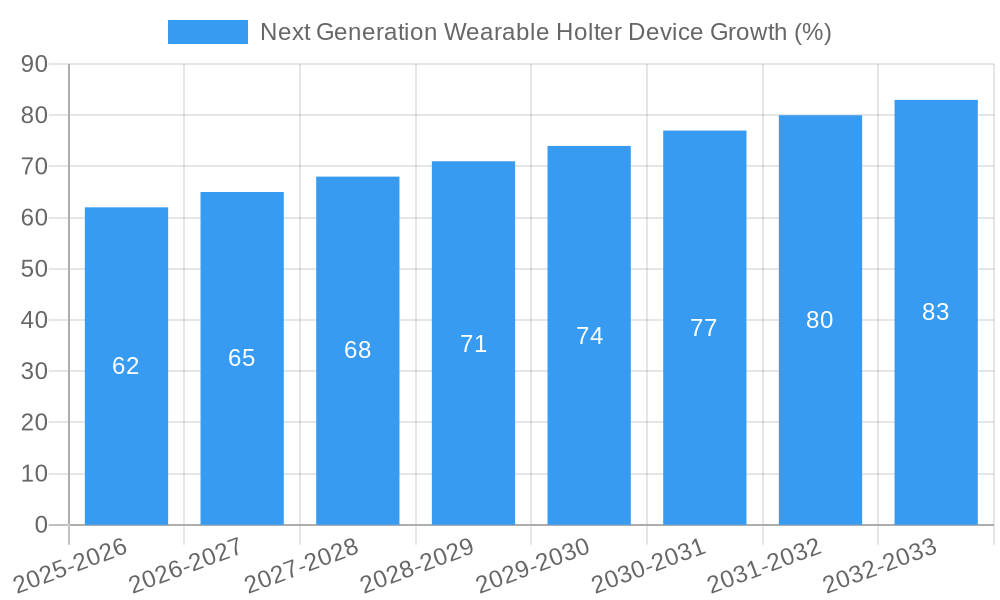
The global Next Generation Wearable Holter Device market is projected to experience significant growth during the forecast period. Driven by increasing adoption rates, technological advancements, and evolving consumer preferences, the market is expected to reach xx million units by 2033.
The market witnessed a CAGR of xx% during the historical period (2019-2024) and is projected to maintain a CAGR of xx% during the forecast period (2025-2033). This growth is attributed to several factors, including the increasing prevalence of cardiovascular diseases, rising demand for remote patient monitoring, technological advancements in sensor technology and data analytics, and increasing awareness among patients about the benefits of early diagnosis and treatment. The market penetration of wearable Holter monitors is expected to increase from xx% in 2025 to xx% by 2033. Consumer behavior shifts, including increased willingness to adopt telehealth solutions, further fuel this growth.
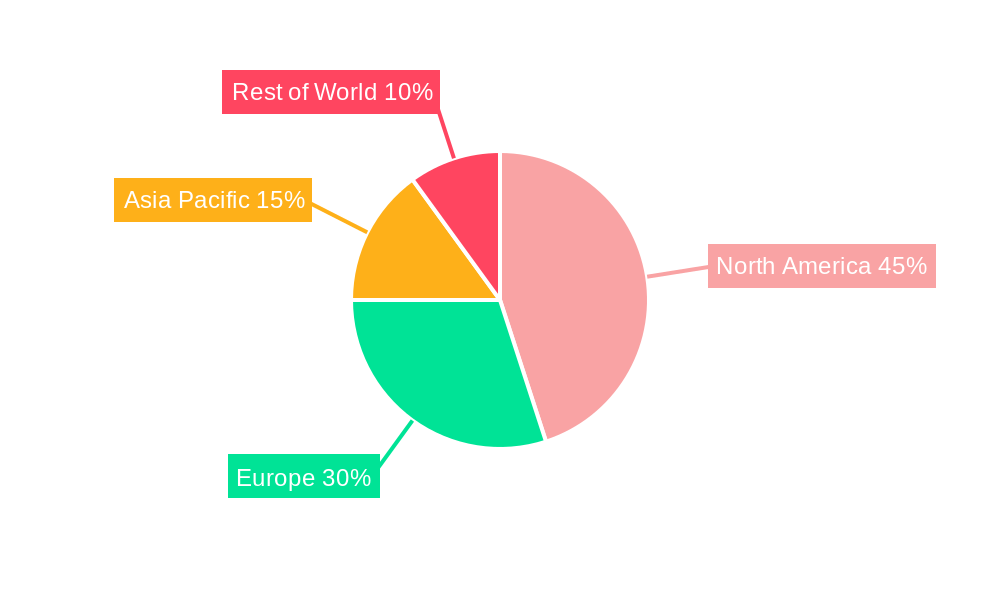
Dominant Regions, Countries, or Segments in Next Generation Wearable Holter Device
North America currently holds the largest market share, driven by robust healthcare infrastructure, advanced technological adoption, and a high prevalence of cardiovascular diseases. However, Asia-Pacific is expected to witness the fastest growth rate due to rising healthcare spending, a growing geriatric population, and increasing awareness of cardiac health.
- North America: Strong regulatory framework, high healthcare expenditure, early adoption of advanced technologies.
- Europe: Growing demand for remote patient monitoring solutions and increasing government initiatives supporting telehealth.
- Asia-Pacific: Rapid growth driven by rising healthcare expenditure, expanding middle class, and increasing awareness of cardiovascular diseases.
Next Generation Wearable Holter Device Product Landscape
Next-generation wearable Holter devices are characterized by their compact size, improved comfort, longer battery life, advanced diagnostic capabilities (e.g., AI-powered arrhythmia detection), and seamless data integration with telehealth platforms. Unique selling propositions include improved patient compliance due to comfort and ease of use, and the provision of real-time data analysis for prompt medical intervention. Technological advancements focus on miniaturization, improved signal quality, and advanced algorithms for accurate diagnosis.
Key Drivers, Barriers & Challenges in Next Generation Wearable Holter Device
Key Drivers:
- Rising prevalence of cardiovascular diseases.
- Increasing demand for remote patient monitoring.
- Technological advancements leading to improved accuracy and ease of use.
- Government initiatives promoting telehealth and remote healthcare.
Key Challenges & Restraints:
- High initial investment costs for device manufacturers and healthcare providers.
- Stringent regulatory requirements and lengthy approval processes.
- Concerns regarding data privacy and security.
- Potential for inaccurate readings and misdiagnosis, requiring robust quality control measures.
Emerging Opportunities in Next Generation Wearable Holter Device
- Expansion into untapped markets in developing countries.
- Development of integrated platforms combining wearable Holter devices with other remote monitoring technologies.
- Focus on personalized medicine and tailored diagnostic algorithms.
- Integration with artificial intelligence for automated diagnosis and improved patient outcomes.
Growth Accelerators in the Next Generation Wearable Holter Device Industry
Technological breakthroughs, such as advancements in sensor technology, AI-powered diagnostic algorithms, and miniaturization, are key growth accelerators. Strategic partnerships between device manufacturers and telehealth providers expand market reach and create integrated healthcare solutions. Moreover, expansion into new markets and successful penetration of underserved populations can further accelerate market growth.
Key Players Shaping the Next Generation Wearable Holter Device Market
- Baxter
- SmartCardia
- AliveCor
- iRhythm Technologies Inc
- MediBioSense Ltd
- Philips
- LifeLabs
- Aerotel Medical Systems
- HeartBug
- Wellue
- Bardy Diagnostics
- Coala Life
- ScottCare
- Biotricity
- Cardiac Insight
- Icentia Inc
- Ranealth
Notable Milestones in Next Generation Wearable Holter Device Sector
- 2020, Q4: AliveCor received FDA clearance for its KardiaMobile 6L ECG device.
- 2021, Q2: iRhythm Technologies launched its new Zio XT device with enhanced features.
- 2022, Q3: A significant merger between two key players in the market reshaped the competitive landscape. (Specific details are dependent on actual M&A activities).
In-Depth Next Generation Wearable Holter Device Market Outlook
The future of the Next Generation Wearable Holter Device market is bright, driven by sustained technological advancements, increased adoption rates, and a growing demand for remote patient monitoring. Strategic partnerships, expansion into new markets, and the development of innovative applications, such as AI-powered diagnostics and personalized healthcare solutions, present significant opportunities for growth and market expansion. The market is poised for continued strong growth, reaching xx million units by 2033.
Next Generation Wearable Holter Device Segmentation
-
1. Application
- 1.1. E-commerce
- 1.2. Offline
-
2. Type
- 2.1. Chest Strap
- 2.2. ECG Patches
Next Generation Wearable Holter Device Segmentation By Geography
-
1. North America
- 1.1. United States
- 1.2. Canada
- 1.3. Mexico
-
2. South America
- 2.1. Brazil
- 2.2. Argentina
- 2.3. Rest of South America
-
3. Europe
- 3.1. United Kingdom
- 3.2. Germany
- 3.3. France
- 3.4. Italy
- 3.5. Spain
- 3.6. Russia
- 3.7. Benelux
- 3.8. Nordics
- 3.9. Rest of Europe
-
4. Middle East & Africa
- 4.1. Turkey
- 4.2. Israel
- 4.3. GCC
- 4.4. North Africa
- 4.5. South Africa
- 4.6. Rest of Middle East & Africa
-
5. Asia Pacific
- 5.1. China
- 5.2. India
- 5.3. Japan
- 5.4. South Korea
- 5.5. ASEAN
- 5.6. Oceania
- 5.7. Rest of Asia Pacific
Next Generation Wearable Holter Device REPORT HIGHLIGHTS
| Aspects | Details |
|---|---|
| Study Period | 2019-2033 |
| Base Year | 2024 |
| Estimated Year | 2025 |
| Forecast Period | 2025-2033 |
| Historical Period | 2019-2024 |
| Growth Rate | CAGR of 3.5% from 2019-2033 |
| Segmentation |
|
Table of Contents
- 1. Introduction
- 1.1. Research Scope
- 1.2. Market Segmentation
- 1.3. Research Methodology
- 1.4. Definitions and Assumptions
- 2. Executive Summary
- 2.1. Introduction
- 3. Market Dynamics
- 3.1. Introduction
- 3.2. Market Drivers
- 3.3. Market Restrains
- 3.4. Market Trends
- 4. Market Factor Analysis
- 4.1. Porters Five Forces
- 4.2. Supply/Value Chain
- 4.3. PESTEL analysis
- 4.4. Market Entropy
- 4.5. Patent/Trademark Analysis
- 5. Global Next Generation Wearable Holter Device Analysis, Insights and Forecast, 2019-2031
- 5.1. Market Analysis, Insights and Forecast - by Application
- 5.1.1. E-commerce
- 5.1.2. Offline
- 5.2. Market Analysis, Insights and Forecast - by Type
- 5.2.1. Chest Strap
- 5.2.2. ECG Patches
- 5.3. Market Analysis, Insights and Forecast - by Region
- 5.3.1. North America
- 5.3.2. South America
- 5.3.3. Europe
- 5.3.4. Middle East & Africa
- 5.3.5. Asia Pacific
- 5.1. Market Analysis, Insights and Forecast - by Application
- 6. North America Next Generation Wearable Holter Device Analysis, Insights and Forecast, 2019-2031
- 6.1. Market Analysis, Insights and Forecast - by Application
- 6.1.1. E-commerce
- 6.1.2. Offline
- 6.2. Market Analysis, Insights and Forecast - by Type
- 6.2.1. Chest Strap
- 6.2.2. ECG Patches
- 6.1. Market Analysis, Insights and Forecast - by Application
- 7. South America Next Generation Wearable Holter Device Analysis, Insights and Forecast, 2019-2031
- 7.1. Market Analysis, Insights and Forecast - by Application
- 7.1.1. E-commerce
- 7.1.2. Offline
- 7.2. Market Analysis, Insights and Forecast - by Type
- 7.2.1. Chest Strap
- 7.2.2. ECG Patches
- 7.1. Market Analysis, Insights and Forecast - by Application
- 8. Europe Next Generation Wearable Holter Device Analysis, Insights and Forecast, 2019-2031
- 8.1. Market Analysis, Insights and Forecast - by Application
- 8.1.1. E-commerce
- 8.1.2. Offline
- 8.2. Market Analysis, Insights and Forecast - by Type
- 8.2.1. Chest Strap
- 8.2.2. ECG Patches
- 8.1. Market Analysis, Insights and Forecast - by Application
- 9. Middle East & Africa Next Generation Wearable Holter Device Analysis, Insights and Forecast, 2019-2031
- 9.1. Market Analysis, Insights and Forecast - by Application
- 9.1.1. E-commerce
- 9.1.2. Offline
- 9.2. Market Analysis, Insights and Forecast - by Type
- 9.2.1. Chest Strap
- 9.2.2. ECG Patches
- 9.1. Market Analysis, Insights and Forecast - by Application
- 10. Asia Pacific Next Generation Wearable Holter Device Analysis, Insights and Forecast, 2019-2031
- 10.1. Market Analysis, Insights and Forecast - by Application
- 10.1.1. E-commerce
- 10.1.2. Offline
- 10.2. Market Analysis, Insights and Forecast - by Type
- 10.2.1. Chest Strap
- 10.2.2. ECG Patches
- 10.1. Market Analysis, Insights and Forecast - by Application
- 11. Competitive Analysis
- 11.1. Global Market Share Analysis 2024
- 11.2. Company Profiles
- 11.2.1 Baxter
- 11.2.1.1. Overview
- 11.2.1.2. Products
- 11.2.1.3. SWOT Analysis
- 11.2.1.4. Recent Developments
- 11.2.1.5. Financials (Based on Availability)
- 11.2.2 SmartCardia
- 11.2.2.1. Overview
- 11.2.2.2. Products
- 11.2.2.3. SWOT Analysis
- 11.2.2.4. Recent Developments
- 11.2.2.5. Financials (Based on Availability)
- 11.2.3 AliveCor
- 11.2.3.1. Overview
- 11.2.3.2. Products
- 11.2.3.3. SWOT Analysis
- 11.2.3.4. Recent Developments
- 11.2.3.5. Financials (Based on Availability)
- 11.2.4 iRhythm Technologies Inc
- 11.2.4.1. Overview
- 11.2.4.2. Products
- 11.2.4.3. SWOT Analysis
- 11.2.4.4. Recent Developments
- 11.2.4.5. Financials (Based on Availability)
- 11.2.5 MediBioSense Ltd
- 11.2.5.1. Overview
- 11.2.5.2. Products
- 11.2.5.3. SWOT Analysis
- 11.2.5.4. Recent Developments
- 11.2.5.5. Financials (Based on Availability)
- 11.2.6 Philips
- 11.2.6.1. Overview
- 11.2.6.2. Products
- 11.2.6.3. SWOT Analysis
- 11.2.6.4. Recent Developments
- 11.2.6.5. Financials (Based on Availability)
- 11.2.7 LifeLabs
- 11.2.7.1. Overview
- 11.2.7.2. Products
- 11.2.7.3. SWOT Analysis
- 11.2.7.4. Recent Developments
- 11.2.7.5. Financials (Based on Availability)
- 11.2.8 Aerotel Medical Systems
- 11.2.8.1. Overview
- 11.2.8.2. Products
- 11.2.8.3. SWOT Analysis
- 11.2.8.4. Recent Developments
- 11.2.8.5. Financials (Based on Availability)
- 11.2.9 HeartBug
- 11.2.9.1. Overview
- 11.2.9.2. Products
- 11.2.9.3. SWOT Analysis
- 11.2.9.4. Recent Developments
- 11.2.9.5. Financials (Based on Availability)
- 11.2.10 Wellue
- 11.2.10.1. Overview
- 11.2.10.2. Products
- 11.2.10.3. SWOT Analysis
- 11.2.10.4. Recent Developments
- 11.2.10.5. Financials (Based on Availability)
- 11.2.11 Bardy Diagnostics
- 11.2.11.1. Overview
- 11.2.11.2. Products
- 11.2.11.3. SWOT Analysis
- 11.2.11.4. Recent Developments
- 11.2.11.5. Financials (Based on Availability)
- 11.2.12 Coala Life
- 11.2.12.1. Overview
- 11.2.12.2. Products
- 11.2.12.3. SWOT Analysis
- 11.2.12.4. Recent Developments
- 11.2.12.5. Financials (Based on Availability)
- 11.2.13 ScottCare
- 11.2.13.1. Overview
- 11.2.13.2. Products
- 11.2.13.3. SWOT Analysis
- 11.2.13.4. Recent Developments
- 11.2.13.5. Financials (Based on Availability)
- 11.2.14 Biotricity
- 11.2.14.1. Overview
- 11.2.14.2. Products
- 11.2.14.3. SWOT Analysis
- 11.2.14.4. Recent Developments
- 11.2.14.5. Financials (Based on Availability)
- 11.2.15 Cardiac Insight
- 11.2.15.1. Overview
- 11.2.15.2. Products
- 11.2.15.3. SWOT Analysis
- 11.2.15.4. Recent Developments
- 11.2.15.5. Financials (Based on Availability)
- 11.2.16 Icentia Inc
- 11.2.16.1. Overview
- 11.2.16.2. Products
- 11.2.16.3. SWOT Analysis
- 11.2.16.4. Recent Developments
- 11.2.16.5. Financials (Based on Availability)
- 11.2.17 Ranealth
- 11.2.17.1. Overview
- 11.2.17.2. Products
- 11.2.17.3. SWOT Analysis
- 11.2.17.4. Recent Developments
- 11.2.17.5. Financials (Based on Availability)
- 11.2.1 Baxter
List of Figures
- Figure 1: Global Next Generation Wearable Holter Device Revenue Breakdown (million, %) by Region 2024 & 2032
- Figure 2: Global Next Generation Wearable Holter Device Volume Breakdown (K, %) by Region 2024 & 2032
- Figure 3: North America Next Generation Wearable Holter Device Revenue (million), by Application 2024 & 2032
- Figure 4: North America Next Generation Wearable Holter Device Volume (K), by Application 2024 & 2032
- Figure 5: North America Next Generation Wearable Holter Device Revenue Share (%), by Application 2024 & 2032
- Figure 6: North America Next Generation Wearable Holter Device Volume Share (%), by Application 2024 & 2032
- Figure 7: North America Next Generation Wearable Holter Device Revenue (million), by Type 2024 & 2032
- Figure 8: North America Next Generation Wearable Holter Device Volume (K), by Type 2024 & 2032
- Figure 9: North America Next Generation Wearable Holter Device Revenue Share (%), by Type 2024 & 2032
- Figure 10: North America Next Generation Wearable Holter Device Volume Share (%), by Type 2024 & 2032
- Figure 11: North America Next Generation Wearable Holter Device Revenue (million), by Country 2024 & 2032
- Figure 12: North America Next Generation Wearable Holter Device Volume (K), by Country 2024 & 2032
- Figure 13: North America Next Generation Wearable Holter Device Revenue Share (%), by Country 2024 & 2032
- Figure 14: North America Next Generation Wearable Holter Device Volume Share (%), by Country 2024 & 2032
- Figure 15: South America Next Generation Wearable Holter Device Revenue (million), by Application 2024 & 2032
- Figure 16: South America Next Generation Wearable Holter Device Volume (K), by Application 2024 & 2032
- Figure 17: South America Next Generation Wearable Holter Device Revenue Share (%), by Application 2024 & 2032
- Figure 18: South America Next Generation Wearable Holter Device Volume Share (%), by Application 2024 & 2032
- Figure 19: South America Next Generation Wearable Holter Device Revenue (million), by Type 2024 & 2032
- Figure 20: South America Next Generation Wearable Holter Device Volume (K), by Type 2024 & 2032
- Figure 21: South America Next Generation Wearable Holter Device Revenue Share (%), by Type 2024 & 2032
- Figure 22: South America Next Generation Wearable Holter Device Volume Share (%), by Type 2024 & 2032
- Figure 23: South America Next Generation Wearable Holter Device Revenue (million), by Country 2024 & 2032
- Figure 24: South America Next Generation Wearable Holter Device Volume (K), by Country 2024 & 2032
- Figure 25: South America Next Generation Wearable Holter Device Revenue Share (%), by Country 2024 & 2032
- Figure 26: South America Next Generation Wearable Holter Device Volume Share (%), by Country 2024 & 2032
- Figure 27: Europe Next Generation Wearable Holter Device Revenue (million), by Application 2024 & 2032
- Figure 28: Europe Next Generation Wearable Holter Device Volume (K), by Application 2024 & 2032
- Figure 29: Europe Next Generation Wearable Holter Device Revenue Share (%), by Application 2024 & 2032
- Figure 30: Europe Next Generation Wearable Holter Device Volume Share (%), by Application 2024 & 2032
- Figure 31: Europe Next Generation Wearable Holter Device Revenue (million), by Type 2024 & 2032
- Figure 32: Europe Next Generation Wearable Holter Device Volume (K), by Type 2024 & 2032
- Figure 33: Europe Next Generation Wearable Holter Device Revenue Share (%), by Type 2024 & 2032
- Figure 34: Europe Next Generation Wearable Holter Device Volume Share (%), by Type 2024 & 2032
- Figure 35: Europe Next Generation Wearable Holter Device Revenue (million), by Country 2024 & 2032
- Figure 36: Europe Next Generation Wearable Holter Device Volume (K), by Country 2024 & 2032
- Figure 37: Europe Next Generation Wearable Holter Device Revenue Share (%), by Country 2024 & 2032
- Figure 38: Europe Next Generation Wearable Holter Device Volume Share (%), by Country 2024 & 2032
- Figure 39: Middle East & Africa Next Generation Wearable Holter Device Revenue (million), by Application 2024 & 2032
- Figure 40: Middle East & Africa Next Generation Wearable Holter Device Volume (K), by Application 2024 & 2032
- Figure 41: Middle East & Africa Next Generation Wearable Holter Device Revenue Share (%), by Application 2024 & 2032
- Figure 42: Middle East & Africa Next Generation Wearable Holter Device Volume Share (%), by Application 2024 & 2032
- Figure 43: Middle East & Africa Next Generation Wearable Holter Device Revenue (million), by Type 2024 & 2032
- Figure 44: Middle East & Africa Next Generation Wearable Holter Device Volume (K), by Type 2024 & 2032
- Figure 45: Middle East & Africa Next Generation Wearable Holter Device Revenue Share (%), by Type 2024 & 2032
- Figure 46: Middle East & Africa Next Generation Wearable Holter Device Volume Share (%), by Type 2024 & 2032
- Figure 47: Middle East & Africa Next Generation Wearable Holter Device Revenue (million), by Country 2024 & 2032
- Figure 48: Middle East & Africa Next Generation Wearable Holter Device Volume (K), by Country 2024 & 2032
- Figure 49: Middle East & Africa Next Generation Wearable Holter Device Revenue Share (%), by Country 2024 & 2032
- Figure 50: Middle East & Africa Next Generation Wearable Holter Device Volume Share (%), by Country 2024 & 2032
- Figure 51: Asia Pacific Next Generation Wearable Holter Device Revenue (million), by Application 2024 & 2032
- Figure 52: Asia Pacific Next Generation Wearable Holter Device Volume (K), by Application 2024 & 2032
- Figure 53: Asia Pacific Next Generation Wearable Holter Device Revenue Share (%), by Application 2024 & 2032
- Figure 54: Asia Pacific Next Generation Wearable Holter Device Volume Share (%), by Application 2024 & 2032
- Figure 55: Asia Pacific Next Generation Wearable Holter Device Revenue (million), by Type 2024 & 2032
- Figure 56: Asia Pacific Next Generation Wearable Holter Device Volume (K), by Type 2024 & 2032
- Figure 57: Asia Pacific Next Generation Wearable Holter Device Revenue Share (%), by Type 2024 & 2032
- Figure 58: Asia Pacific Next Generation Wearable Holter Device Volume Share (%), by Type 2024 & 2032
- Figure 59: Asia Pacific Next Generation Wearable Holter Device Revenue (million), by Country 2024 & 2032
- Figure 60: Asia Pacific Next Generation Wearable Holter Device Volume (K), by Country 2024 & 2032
- Figure 61: Asia Pacific Next Generation Wearable Holter Device Revenue Share (%), by Country 2024 & 2032
- Figure 62: Asia Pacific Next Generation Wearable Holter Device Volume Share (%), by Country 2024 & 2032
List of Tables
- Table 1: Global Next Generation Wearable Holter Device Revenue million Forecast, by Region 2019 & 2032
- Table 2: Global Next Generation Wearable Holter Device Volume K Forecast, by Region 2019 & 2032
- Table 3: Global Next Generation Wearable Holter Device Revenue million Forecast, by Application 2019 & 2032
- Table 4: Global Next Generation Wearable Holter Device Volume K Forecast, by Application 2019 & 2032
- Table 5: Global Next Generation Wearable Holter Device Revenue million Forecast, by Type 2019 & 2032
- Table 6: Global Next Generation Wearable Holter Device Volume K Forecast, by Type 2019 & 2032
- Table 7: Global Next Generation Wearable Holter Device Revenue million Forecast, by Region 2019 & 2032
- Table 8: Global Next Generation Wearable Holter Device Volume K Forecast, by Region 2019 & 2032
- Table 9: Global Next Generation Wearable Holter Device Revenue million Forecast, by Application 2019 & 2032
- Table 10: Global Next Generation Wearable Holter Device Volume K Forecast, by Application 2019 & 2032
- Table 11: Global Next Generation Wearable Holter Device Revenue million Forecast, by Type 2019 & 2032
- Table 12: Global Next Generation Wearable Holter Device Volume K Forecast, by Type 2019 & 2032
- Table 13: Global Next Generation Wearable Holter Device Revenue million Forecast, by Country 2019 & 2032
- Table 14: Global Next Generation Wearable Holter Device Volume K Forecast, by Country 2019 & 2032
- Table 15: United States Next Generation Wearable Holter Device Revenue (million) Forecast, by Application 2019 & 2032
- Table 16: United States Next Generation Wearable Holter Device Volume (K) Forecast, by Application 2019 & 2032
- Table 17: Canada Next Generation Wearable Holter Device Revenue (million) Forecast, by Application 2019 & 2032
- Table 18: Canada Next Generation Wearable Holter Device Volume (K) Forecast, by Application 2019 & 2032
- Table 19: Mexico Next Generation Wearable Holter Device Revenue (million) Forecast, by Application 2019 & 2032
- Table 20: Mexico Next Generation Wearable Holter Device Volume (K) Forecast, by Application 2019 & 2032
- Table 21: Global Next Generation Wearable Holter Device Revenue million Forecast, by Application 2019 & 2032
- Table 22: Global Next Generation Wearable Holter Device Volume K Forecast, by Application 2019 & 2032
- Table 23: Global Next Generation Wearable Holter Device Revenue million Forecast, by Type 2019 & 2032
- Table 24: Global Next Generation Wearable Holter Device Volume K Forecast, by Type 2019 & 2032
- Table 25: Global Next Generation Wearable Holter Device Revenue million Forecast, by Country 2019 & 2032
- Table 26: Global Next Generation Wearable Holter Device Volume K Forecast, by Country 2019 & 2032
- Table 27: Brazil Next Generation Wearable Holter Device Revenue (million) Forecast, by Application 2019 & 2032
- Table 28: Brazil Next Generation Wearable Holter Device Volume (K) Forecast, by Application 2019 & 2032
- Table 29: Argentina Next Generation Wearable Holter Device Revenue (million) Forecast, by Application 2019 & 2032
- Table 30: Argentina Next Generation Wearable Holter Device Volume (K) Forecast, by Application 2019 & 2032
- Table 31: Rest of South America Next Generation Wearable Holter Device Revenue (million) Forecast, by Application 2019 & 2032
- Table 32: Rest of South America Next Generation Wearable Holter Device Volume (K) Forecast, by Application 2019 & 2032
- Table 33: Global Next Generation Wearable Holter Device Revenue million Forecast, by Application 2019 & 2032
- Table 34: Global Next Generation Wearable Holter Device Volume K Forecast, by Application 2019 & 2032
- Table 35: Global Next Generation Wearable Holter Device Revenue million Forecast, by Type 2019 & 2032
- Table 36: Global Next Generation Wearable Holter Device Volume K Forecast, by Type 2019 & 2032
- Table 37: Global Next Generation Wearable Holter Device Revenue million Forecast, by Country 2019 & 2032
- Table 38: Global Next Generation Wearable Holter Device Volume K Forecast, by Country 2019 & 2032
- Table 39: United Kingdom Next Generation Wearable Holter Device Revenue (million) Forecast, by Application 2019 & 2032
- Table 40: United Kingdom Next Generation Wearable Holter Device Volume (K) Forecast, by Application 2019 & 2032
- Table 41: Germany Next Generation Wearable Holter Device Revenue (million) Forecast, by Application 2019 & 2032
- Table 42: Germany Next Generation Wearable Holter Device Volume (K) Forecast, by Application 2019 & 2032
- Table 43: France Next Generation Wearable Holter Device Revenue (million) Forecast, by Application 2019 & 2032
- Table 44: France Next Generation Wearable Holter Device Volume (K) Forecast, by Application 2019 & 2032
- Table 45: Italy Next Generation Wearable Holter Device Revenue (million) Forecast, by Application 2019 & 2032
- Table 46: Italy Next Generation Wearable Holter Device Volume (K) Forecast, by Application 2019 & 2032
- Table 47: Spain Next Generation Wearable Holter Device Revenue (million) Forecast, by Application 2019 & 2032
- Table 48: Spain Next Generation Wearable Holter Device Volume (K) Forecast, by Application 2019 & 2032
- Table 49: Russia Next Generation Wearable Holter Device Revenue (million) Forecast, by Application 2019 & 2032
- Table 50: Russia Next Generation Wearable Holter Device Volume (K) Forecast, by Application 2019 & 2032
- Table 51: Benelux Next Generation Wearable Holter Device Revenue (million) Forecast, by Application 2019 & 2032
- Table 52: Benelux Next Generation Wearable Holter Device Volume (K) Forecast, by Application 2019 & 2032
- Table 53: Nordics Next Generation Wearable Holter Device Revenue (million) Forecast, by Application 2019 & 2032
- Table 54: Nordics Next Generation Wearable Holter Device Volume (K) Forecast, by Application 2019 & 2032
- Table 55: Rest of Europe Next Generation Wearable Holter Device Revenue (million) Forecast, by Application 2019 & 2032
- Table 56: Rest of Europe Next Generation Wearable Holter Device Volume (K) Forecast, by Application 2019 & 2032
- Table 57: Global Next Generation Wearable Holter Device Revenue million Forecast, by Application 2019 & 2032
- Table 58: Global Next Generation Wearable Holter Device Volume K Forecast, by Application 2019 & 2032
- Table 59: Global Next Generation Wearable Holter Device Revenue million Forecast, by Type 2019 & 2032
- Table 60: Global Next Generation Wearable Holter Device Volume K Forecast, by Type 2019 & 2032
- Table 61: Global Next Generation Wearable Holter Device Revenue million Forecast, by Country 2019 & 2032
- Table 62: Global Next Generation Wearable Holter Device Volume K Forecast, by Country 2019 & 2032
- Table 63: Turkey Next Generation Wearable Holter Device Revenue (million) Forecast, by Application 2019 & 2032
- Table 64: Turkey Next Generation Wearable Holter Device Volume (K) Forecast, by Application 2019 & 2032
- Table 65: Israel Next Generation Wearable Holter Device Revenue (million) Forecast, by Application 2019 & 2032
- Table 66: Israel Next Generation Wearable Holter Device Volume (K) Forecast, by Application 2019 & 2032
- Table 67: GCC Next Generation Wearable Holter Device Revenue (million) Forecast, by Application 2019 & 2032
- Table 68: GCC Next Generation Wearable Holter Device Volume (K) Forecast, by Application 2019 & 2032
- Table 69: North Africa Next Generation Wearable Holter Device Revenue (million) Forecast, by Application 2019 & 2032
- Table 70: North Africa Next Generation Wearable Holter Device Volume (K) Forecast, by Application 2019 & 2032
- Table 71: South Africa Next Generation Wearable Holter Device Revenue (million) Forecast, by Application 2019 & 2032
- Table 72: South Africa Next Generation Wearable Holter Device Volume (K) Forecast, by Application 2019 & 2032
- Table 73: Rest of Middle East & Africa Next Generation Wearable Holter Device Revenue (million) Forecast, by Application 2019 & 2032
- Table 74: Rest of Middle East & Africa Next Generation Wearable Holter Device Volume (K) Forecast, by Application 2019 & 2032
- Table 75: Global Next Generation Wearable Holter Device Revenue million Forecast, by Application 2019 & 2032
- Table 76: Global Next Generation Wearable Holter Device Volume K Forecast, by Application 2019 & 2032
- Table 77: Global Next Generation Wearable Holter Device Revenue million Forecast, by Type 2019 & 2032
- Table 78: Global Next Generation Wearable Holter Device Volume K Forecast, by Type 2019 & 2032
- Table 79: Global Next Generation Wearable Holter Device Revenue million Forecast, by Country 2019 & 2032
- Table 80: Global Next Generation Wearable Holter Device Volume K Forecast, by Country 2019 & 2032
- Table 81: China Next Generation Wearable Holter Device Revenue (million) Forecast, by Application 2019 & 2032
- Table 82: China Next Generation Wearable Holter Device Volume (K) Forecast, by Application 2019 & 2032
- Table 83: India Next Generation Wearable Holter Device Revenue (million) Forecast, by Application 2019 & 2032
- Table 84: India Next Generation Wearable Holter Device Volume (K) Forecast, by Application 2019 & 2032
- Table 85: Japan Next Generation Wearable Holter Device Revenue (million) Forecast, by Application 2019 & 2032
- Table 86: Japan Next Generation Wearable Holter Device Volume (K) Forecast, by Application 2019 & 2032
- Table 87: South Korea Next Generation Wearable Holter Device Revenue (million) Forecast, by Application 2019 & 2032
- Table 88: South Korea Next Generation Wearable Holter Device Volume (K) Forecast, by Application 2019 & 2032
- Table 89: ASEAN Next Generation Wearable Holter Device Revenue (million) Forecast, by Application 2019 & 2032
- Table 90: ASEAN Next Generation Wearable Holter Device Volume (K) Forecast, by Application 2019 & 2032
- Table 91: Oceania Next Generation Wearable Holter Device Revenue (million) Forecast, by Application 2019 & 2032
- Table 92: Oceania Next Generation Wearable Holter Device Volume (K) Forecast, by Application 2019 & 2032
- Table 93: Rest of Asia Pacific Next Generation Wearable Holter Device Revenue (million) Forecast, by Application 2019 & 2032
- Table 94: Rest of Asia Pacific Next Generation Wearable Holter Device Volume (K) Forecast, by Application 2019 & 2032
Frequently Asked Questions
1. What is the projected Compound Annual Growth Rate (CAGR) of the Next Generation Wearable Holter Device?
The projected CAGR is approximately 3.5%.
2. Which companies are prominent players in the Next Generation Wearable Holter Device?
Key companies in the market include Baxter, SmartCardia, AliveCor, iRhythm Technologies Inc, MediBioSense Ltd, Philips, LifeLabs, Aerotel Medical Systems, HeartBug, Wellue, Bardy Diagnostics, Coala Life, ScottCare, Biotricity, Cardiac Insight, Icentia Inc, Ranealth.
3. What are the main segments of the Next Generation Wearable Holter Device?
The market segments include Application, Type.
4. Can you provide details about the market size?
The market size is estimated to be USD 1726 million as of 2022.
5. What are some drivers contributing to market growth?
N/A
6. What are the notable trends driving market growth?
N/A
7. Are there any restraints impacting market growth?
N/A
8. Can you provide examples of recent developments in the market?
N/A
9. What pricing options are available for accessing the report?
Pricing options include single-user, multi-user, and enterprise licenses priced at USD 3950.00, USD 5925.00, and USD 7900.00 respectively.
10. Is the market size provided in terms of value or volume?
The market size is provided in terms of value, measured in million and volume, measured in K.
11. Are there any specific market keywords associated with the report?
Yes, the market keyword associated with the report is "Next Generation Wearable Holter Device," which aids in identifying and referencing the specific market segment covered.
12. How do I determine which pricing option suits my needs best?
The pricing options vary based on user requirements and access needs. Individual users may opt for single-user licenses, while businesses requiring broader access may choose multi-user or enterprise licenses for cost-effective access to the report.
13. Are there any additional resources or data provided in the Next Generation Wearable Holter Device report?
While the report offers comprehensive insights, it's advisable to review the specific contents or supplementary materials provided to ascertain if additional resources or data are available.
14. How can I stay updated on further developments or reports in the Next Generation Wearable Holter Device?
To stay informed about further developments, trends, and reports in the Next Generation Wearable Holter Device, consider subscribing to industry newsletters, following relevant companies and organizations, or regularly checking reputable industry news sources and publications.
Methodology
Step 1 - Identification of Relevant Samples Size from Population Database


Step 2 - Approaches for Defining Global Market Size (Value, Volume* & Price*)

Note*: In applicable scenarios
Step 3 - Data Sources
Primary Research
- Web Analytics
- Survey Reports
- Research Institute
- Latest Research Reports
- Opinion Leaders
Secondary Research
- Annual Reports
- White Paper
- Latest Press Release
- Industry Association
- Paid Database
- Investor Presentations

Step 4 - Data Triangulation
Involves using different sources of information in order to increase the validity of a study
These sources are likely to be stakeholders in a program - participants, other researchers, program staff, other community members, and so on.
Then we put all data in single framework & apply various statistical tools to find out the dynamic on the market.
During the analysis stage, feedback from the stakeholder groups would be compared to determine areas of agreement as well as areas of divergence
