

Key Insights
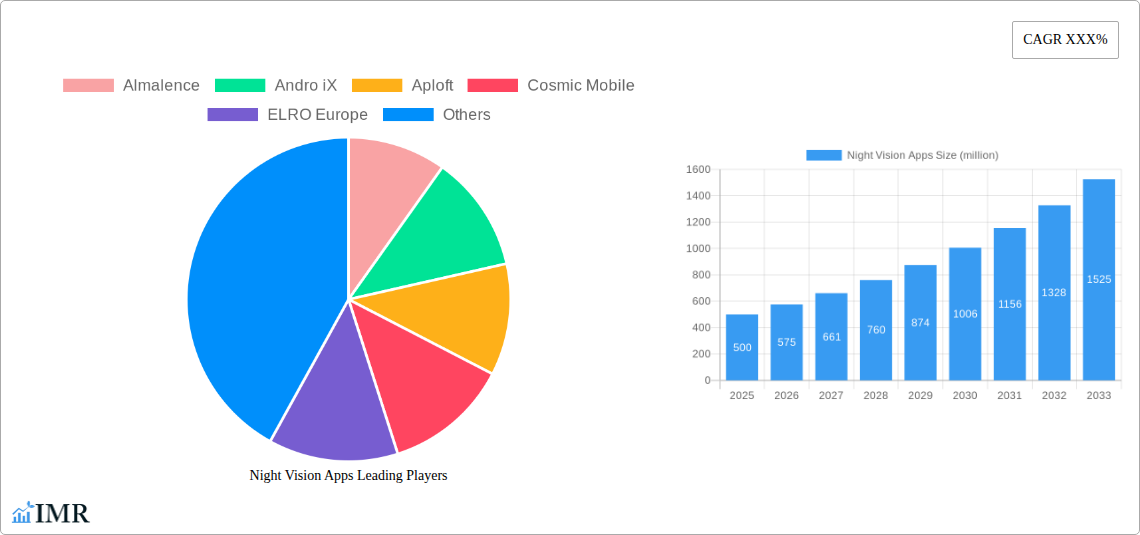
The night vision app market is experiencing robust growth, driven by increasing smartphone penetration, advancements in mobile camera technology, and a rising demand for enhanced security and safety features. The market, estimated at $500 million in 2025, is projected to exhibit a Compound Annual Growth Rate (CAGR) of 15% from 2025 to 2033, reaching approximately $1.8 billion by 2033. This growth is fueled by several key trends, including the integration of advanced image processing algorithms, the increasing availability of affordable and high-quality night vision cameras on smartphones, and the growing popularity of outdoor activities and adventure tourism where night vision capabilities are highly beneficial. Furthermore, the development of user-friendly interfaces and the expansion of app functionalities beyond simple night vision, such as incorporating features like thermal imaging simulation or object recognition, are further driving market expansion.
However, certain restraints hinder the market's potential. These include challenges related to battery consumption, limitations in low-light performance in extreme conditions, and concerns about privacy and data security related to image capture and storage. Despite these challenges, the market is segmented into various app types based on features and target audiences, such as basic night vision, advanced night vision with image enhancement, and specialized apps for specific applications (e.g., hunting, security). Key players in the market, such as Almalence, Andro iX, Aploft, Cosmic Mobile, and others, are constantly innovating to overcome these restraints and cater to the growing demand for improved night vision capabilities on mobile devices. Competition is intensifying, leading to continuous improvements in app features, performance, and user experience, thereby shaping the future of this dynamic market segment.
Night Vision Apps Market Report: 2019-2033
This comprehensive report provides an in-depth analysis of the Night Vision Apps market, encompassing market dynamics, growth trends, regional dominance, product landscape, key players, and future outlook. The study period covers 2019-2033, with 2025 as the base and estimated year. The forecast period is 2025-2033, and the historical period is 2019-2024. This report is crucial for industry professionals, investors, and anyone seeking a detailed understanding of this rapidly evolving market segment within the broader Mobile Application and Imaging Software markets (parent and child markets). The market is expected to reach xx million units by 2033.
Night Vision Apps Market Dynamics & Structure
The Night Vision Apps market exhibits a moderately fragmented structure, with several key players vying for market share. Technological innovation, particularly in image processing and augmented reality (AR), is a primary driver of market growth. Regulatory frameworks surrounding data privacy and app store policies influence market dynamics. Competitive substitutes include dedicated night vision devices, but the convenience and accessibility of apps drive adoption. The end-user demographics are diverse, ranging from security professionals to outdoor enthusiasts. M&A activity in the sector has been relatively low in recent years, with only xx deals recorded between 2019 and 2024.
- Market Concentration: Moderately fragmented, with no single dominant player holding more than xx% market share in 2025.
- Innovation Drivers: Advancements in low-light image processing algorithms, AR integration, and improved camera hardware.
- Regulatory Frameworks: Data privacy regulations (e.g., GDPR) and app store guidelines impacting app features and monetization.
- Competitive Substitutes: Dedicated night vision devices offer superior performance but lack the portability and affordability of apps.
- End-User Demographics: Security personnel, law enforcement, outdoor adventurers, hunters, and smartphone users.
- M&A Trends: Low M&A activity (xx deals between 2019-2024), indicating organic growth as the dominant strategy.
Night Vision Apps Growth Trends & Insights
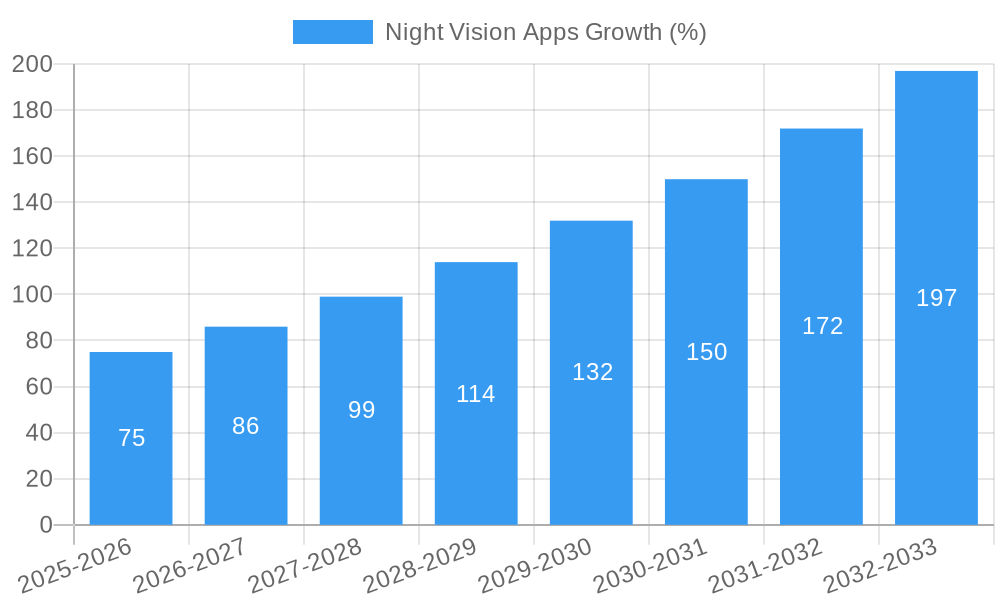
The Night Vision Apps market has experienced substantial growth since 2019, driven by increased smartphone penetration, improved app functionalities, and rising demand across various sectors. The market size reached xx million units in 2024 and is projected to witness a Compound Annual Growth Rate (CAGR) of xx% from 2025 to 2033. Technological disruptions, such as the introduction of AI-powered image enhancement, are accelerating market expansion. Consumer behavior shifts towards increased adoption of mobile applications for diverse functionalities contribute significantly to growth. Market penetration is expected to reach xx% by 2033, indicating significant untapped potential. This growth is fueled by the increasing affordability of smartphones with advanced camera capabilities and the growing demand for night vision solutions in various applications.
Dominant Regions, Countries, or Segments in Night Vision Apps
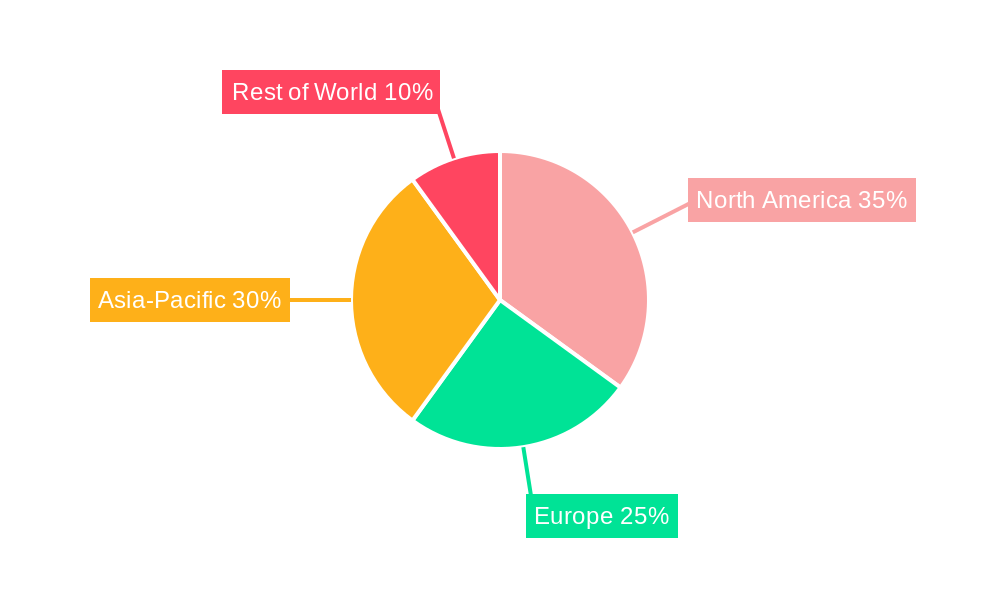
North America currently holds the largest market share in the Night Vision Apps sector, driven by strong technological advancements, high smartphone penetration, and a considerable defense and security market. Europe follows closely, showing significant growth potential due to rising adoption of smart devices and increasing demand for enhanced safety and security solutions. Asia Pacific is anticipated to experience the highest growth rate in the forecast period, propelled by rapid economic development, expanding smartphone usage, and increasing investment in technology.
- North America: High smartphone penetration, strong technological base, significant defense spending drive market leadership.
- Europe: Growing adoption of smart devices and safety concerns fuel market expansion.
- Asia Pacific: Rapid economic development, increasing smartphone usage, and technological investment boost growth.
- Other Regions: Emerging markets demonstrate significant growth potential, although constrained by lower smartphone penetration and economic factors.
Night Vision Apps Product Landscape
Night vision apps offer a variety of features, from basic low-light enhancement to advanced functionalities like thermal imaging simulation and object recognition. Technological advancements include improved algorithms for noise reduction, enhanced detail preservation, and integration with other smartphone sensors. Many apps offer user-adjustable settings, allowing users to optimize performance for diverse environments. Unique selling propositions often include features such as real-time image processing, user-friendly interfaces, and integration with other applications.
Key Drivers, Barriers & Challenges in Night Vision Apps
Key Drivers:
- The increasing affordability and accessibility of smartphones with high-quality cameras.
- Advancements in image processing algorithms and artificial intelligence.
- Growing demand for night vision capabilities across various sectors.
Challenges:
- Competition from dedicated night vision devices.
- Power consumption limitations of smartphone cameras.
- Concerns about data privacy and security.
- Regulatory hurdles for specific applications.
Emerging Opportunities in Night Vision Apps
The integration of night vision technology with augmented reality (AR) and virtual reality (VR) presents significant opportunities. Expansion into untapped markets, such as wildlife observation and industrial inspection, offers substantial growth potential. The development of more energy-efficient algorithms and improved camera sensors will enhance app performance and expand the market.
Growth Accelerators in the Night Vision Apps Industry
Strategic partnerships between app developers and hardware manufacturers are boosting innovation. Technological breakthroughs in image processing and AI are enhancing app capabilities. Market expansion into new geographic regions and applications is driving sustainable growth.
Key Players Shaping the Night Vision Apps Market
- Almalence
- Andro iX
- Aploft
- Cosmic Mobile
- ELRO Europe
- Illumes Lite
- Just4Fun
- NAV
- Night Eye
- Virtual Night Vision
Notable Milestones in Night Vision Apps Sector
- 2020-03: Introduction of AI-powered image enhancement in several leading apps.
- 2021-10: Launch of the first night vision app with integrated thermal imaging simulation.
- 2023-05: Major partnership between a leading app developer and a smartphone manufacturer.
In-Depth Night Vision Apps Market Outlook
The Night Vision Apps market is poised for significant growth in the coming years. Technological advancements, strategic partnerships, and expanding applications will continue to drive market expansion. Opportunities exist in developing innovative features, expanding into new geographic regions, and tailoring apps for specific market segments. The market presents a compelling investment opportunity for companies with a strong technological foundation and a clear market strategy.
Night Vision Apps Segmentation
-
1. Application
- 1.1. Private Users
- 1.2. Commercial Users
-
2. Type
- 2.1. Android
- 2.2. IOS
- 2.3. Others
Night Vision Apps Segmentation By Geography
-
1. North America
- 1.1. United States
- 1.2. Canada
- 1.3. Mexico
-
2. South America
- 2.1. Brazil
- 2.2. Argentina
- 2.3. Rest of South America
-
3. Europe
- 3.1. United Kingdom
- 3.2. Germany
- 3.3. France
- 3.4. Italy
- 3.5. Spain
- 3.6. Russia
- 3.7. Benelux
- 3.8. Nordics
- 3.9. Rest of Europe
-
4. Middle East & Africa
- 4.1. Turkey
- 4.2. Israel
- 4.3. GCC
- 4.4. North Africa
- 4.5. South Africa
- 4.6. Rest of Middle East & Africa
-
5. Asia Pacific
- 5.1. China
- 5.2. India
- 5.3. Japan
- 5.4. South Korea
- 5.5. ASEAN
- 5.6. Oceania
- 5.7. Rest of Asia Pacific
Night Vision Apps REPORT HIGHLIGHTS
| Aspects | Details |
|---|---|
| Study Period | 2019-2033 |
| Base Year | 2024 |
| Estimated Year | 2025 |
| Forecast Period | 2025-2033 |
| Historical Period | 2019-2024 |
| Growth Rate | CAGR of XXX% from 2019-2033 |
| Segmentation |
|
Table of Contents
- 1. Introduction
- 1.1. Research Scope
- 1.2. Market Segmentation
- 1.3. Research Methodology
- 1.4. Definitions and Assumptions
- 2. Executive Summary
- 2.1. Introduction
- 3. Market Dynamics
- 3.1. Introduction
- 3.2. Market Drivers
- 3.3. Market Restrains
- 3.4. Market Trends
- 4. Market Factor Analysis
- 4.1. Porters Five Forces
- 4.2. Supply/Value Chain
- 4.3. PESTEL analysis
- 4.4. Market Entropy
- 4.5. Patent/Trademark Analysis
- 5. Global Night Vision Apps Analysis, Insights and Forecast, 2019-2031
- 5.1. Market Analysis, Insights and Forecast - by Application
- 5.1.1. Private Users
- 5.1.2. Commercial Users
- 5.2. Market Analysis, Insights and Forecast - by Type
- 5.2.1. Android
- 5.2.2. IOS
- 5.2.3. Others
- 5.3. Market Analysis, Insights and Forecast - by Region
- 5.3.1. North America
- 5.3.2. South America
- 5.3.3. Europe
- 5.3.4. Middle East & Africa
- 5.3.5. Asia Pacific
- 5.1. Market Analysis, Insights and Forecast - by Application
- 6. North America Night Vision Apps Analysis, Insights and Forecast, 2019-2031
- 6.1. Market Analysis, Insights and Forecast - by Application
- 6.1.1. Private Users
- 6.1.2. Commercial Users
- 6.2. Market Analysis, Insights and Forecast - by Type
- 6.2.1. Android
- 6.2.2. IOS
- 6.2.3. Others
- 6.1. Market Analysis, Insights and Forecast - by Application
- 7. South America Night Vision Apps Analysis, Insights and Forecast, 2019-2031
- 7.1. Market Analysis, Insights and Forecast - by Application
- 7.1.1. Private Users
- 7.1.2. Commercial Users
- 7.2. Market Analysis, Insights and Forecast - by Type
- 7.2.1. Android
- 7.2.2. IOS
- 7.2.3. Others
- 7.1. Market Analysis, Insights and Forecast - by Application
- 8. Europe Night Vision Apps Analysis, Insights and Forecast, 2019-2031
- 8.1. Market Analysis, Insights and Forecast - by Application
- 8.1.1. Private Users
- 8.1.2. Commercial Users
- 8.2. Market Analysis, Insights and Forecast - by Type
- 8.2.1. Android
- 8.2.2. IOS
- 8.2.3. Others
- 8.1. Market Analysis, Insights and Forecast - by Application
- 9. Middle East & Africa Night Vision Apps Analysis, Insights and Forecast, 2019-2031
- 9.1. Market Analysis, Insights and Forecast - by Application
- 9.1.1. Private Users
- 9.1.2. Commercial Users
- 9.2. Market Analysis, Insights and Forecast - by Type
- 9.2.1. Android
- 9.2.2. IOS
- 9.2.3. Others
- 9.1. Market Analysis, Insights and Forecast - by Application
- 10. Asia Pacific Night Vision Apps Analysis, Insights and Forecast, 2019-2031
- 10.1. Market Analysis, Insights and Forecast - by Application
- 10.1.1. Private Users
- 10.1.2. Commercial Users
- 10.2. Market Analysis, Insights and Forecast - by Type
- 10.2.1. Android
- 10.2.2. IOS
- 10.2.3. Others
- 10.1. Market Analysis, Insights and Forecast - by Application
- 11. Competitive Analysis
- 11.1. Global Market Share Analysis 2024
- 11.2. Company Profiles
- 11.2.1 Almalence
- 11.2.1.1. Overview
- 11.2.1.2. Products
- 11.2.1.3. SWOT Analysis
- 11.2.1.4. Recent Developments
- 11.2.1.5. Financials (Based on Availability)
- 11.2.2 Andro iX
- 11.2.2.1. Overview
- 11.2.2.2. Products
- 11.2.2.3. SWOT Analysis
- 11.2.2.4. Recent Developments
- 11.2.2.5. Financials (Based on Availability)
- 11.2.3 Aploft
- 11.2.3.1. Overview
- 11.2.3.2. Products
- 11.2.3.3. SWOT Analysis
- 11.2.3.4. Recent Developments
- 11.2.3.5. Financials (Based on Availability)
- 11.2.4 Cosmic Mobile
- 11.2.4.1. Overview
- 11.2.4.2. Products
- 11.2.4.3. SWOT Analysis
- 11.2.4.4. Recent Developments
- 11.2.4.5. Financials (Based on Availability)
- 11.2.5 ELRO Europe
- 11.2.5.1. Overview
- 11.2.5.2. Products
- 11.2.5.3. SWOT Analysis
- 11.2.5.4. Recent Developments
- 11.2.5.5. Financials (Based on Availability)
- 11.2.6 Illumes Lite
- 11.2.6.1. Overview
- 11.2.6.2. Products
- 11.2.6.3. SWOT Analysis
- 11.2.6.4. Recent Developments
- 11.2.6.5. Financials (Based on Availability)
- 11.2.7 Just4Fun
- 11.2.7.1. Overview
- 11.2.7.2. Products
- 11.2.7.3. SWOT Analysis
- 11.2.7.4. Recent Developments
- 11.2.7.5. Financials (Based on Availability)
- 11.2.8 NAV
- 11.2.8.1. Overview
- 11.2.8.2. Products
- 11.2.8.3. SWOT Analysis
- 11.2.8.4. Recent Developments
- 11.2.8.5. Financials (Based on Availability)
- 11.2.9 Night Eye
- 11.2.9.1. Overview
- 11.2.9.2. Products
- 11.2.9.3. SWOT Analysis
- 11.2.9.4. Recent Developments
- 11.2.9.5. Financials (Based on Availability)
- 11.2.10 Virtual Night Vision
- 11.2.10.1. Overview
- 11.2.10.2. Products
- 11.2.10.3. SWOT Analysis
- 11.2.10.4. Recent Developments
- 11.2.10.5. Financials (Based on Availability)
- 11.2.1 Almalence
List of Figures
- Figure 1: Global Night Vision Apps Revenue Breakdown (million, %) by Region 2024 & 2032
- Figure 2: North America Night Vision Apps Revenue (million), by Application 2024 & 2032
- Figure 3: North America Night Vision Apps Revenue Share (%), by Application 2024 & 2032
- Figure 4: North America Night Vision Apps Revenue (million), by Type 2024 & 2032
- Figure 5: North America Night Vision Apps Revenue Share (%), by Type 2024 & 2032
- Figure 6: North America Night Vision Apps Revenue (million), by Country 2024 & 2032
- Figure 7: North America Night Vision Apps Revenue Share (%), by Country 2024 & 2032
- Figure 8: South America Night Vision Apps Revenue (million), by Application 2024 & 2032
- Figure 9: South America Night Vision Apps Revenue Share (%), by Application 2024 & 2032
- Figure 10: South America Night Vision Apps Revenue (million), by Type 2024 & 2032
- Figure 11: South America Night Vision Apps Revenue Share (%), by Type 2024 & 2032
- Figure 12: South America Night Vision Apps Revenue (million), by Country 2024 & 2032
- Figure 13: South America Night Vision Apps Revenue Share (%), by Country 2024 & 2032
- Figure 14: Europe Night Vision Apps Revenue (million), by Application 2024 & 2032
- Figure 15: Europe Night Vision Apps Revenue Share (%), by Application 2024 & 2032
- Figure 16: Europe Night Vision Apps Revenue (million), by Type 2024 & 2032
- Figure 17: Europe Night Vision Apps Revenue Share (%), by Type 2024 & 2032
- Figure 18: Europe Night Vision Apps Revenue (million), by Country 2024 & 2032
- Figure 19: Europe Night Vision Apps Revenue Share (%), by Country 2024 & 2032
- Figure 20: Middle East & Africa Night Vision Apps Revenue (million), by Application 2024 & 2032
- Figure 21: Middle East & Africa Night Vision Apps Revenue Share (%), by Application 2024 & 2032
- Figure 22: Middle East & Africa Night Vision Apps Revenue (million), by Type 2024 & 2032
- Figure 23: Middle East & Africa Night Vision Apps Revenue Share (%), by Type 2024 & 2032
- Figure 24: Middle East & Africa Night Vision Apps Revenue (million), by Country 2024 & 2032
- Figure 25: Middle East & Africa Night Vision Apps Revenue Share (%), by Country 2024 & 2032
- Figure 26: Asia Pacific Night Vision Apps Revenue (million), by Application 2024 & 2032
- Figure 27: Asia Pacific Night Vision Apps Revenue Share (%), by Application 2024 & 2032
- Figure 28: Asia Pacific Night Vision Apps Revenue (million), by Type 2024 & 2032
- Figure 29: Asia Pacific Night Vision Apps Revenue Share (%), by Type 2024 & 2032
- Figure 30: Asia Pacific Night Vision Apps Revenue (million), by Country 2024 & 2032
- Figure 31: Asia Pacific Night Vision Apps Revenue Share (%), by Country 2024 & 2032
List of Tables
- Table 1: Global Night Vision Apps Revenue million Forecast, by Region 2019 & 2032
- Table 2: Global Night Vision Apps Revenue million Forecast, by Application 2019 & 2032
- Table 3: Global Night Vision Apps Revenue million Forecast, by Type 2019 & 2032
- Table 4: Global Night Vision Apps Revenue million Forecast, by Region 2019 & 2032
- Table 5: Global Night Vision Apps Revenue million Forecast, by Application 2019 & 2032
- Table 6: Global Night Vision Apps Revenue million Forecast, by Type 2019 & 2032
- Table 7: Global Night Vision Apps Revenue million Forecast, by Country 2019 & 2032
- Table 8: United States Night Vision Apps Revenue (million) Forecast, by Application 2019 & 2032
- Table 9: Canada Night Vision Apps Revenue (million) Forecast, by Application 2019 & 2032
- Table 10: Mexico Night Vision Apps Revenue (million) Forecast, by Application 2019 & 2032
- Table 11: Global Night Vision Apps Revenue million Forecast, by Application 2019 & 2032
- Table 12: Global Night Vision Apps Revenue million Forecast, by Type 2019 & 2032
- Table 13: Global Night Vision Apps Revenue million Forecast, by Country 2019 & 2032
- Table 14: Brazil Night Vision Apps Revenue (million) Forecast, by Application 2019 & 2032
- Table 15: Argentina Night Vision Apps Revenue (million) Forecast, by Application 2019 & 2032
- Table 16: Rest of South America Night Vision Apps Revenue (million) Forecast, by Application 2019 & 2032
- Table 17: Global Night Vision Apps Revenue million Forecast, by Application 2019 & 2032
- Table 18: Global Night Vision Apps Revenue million Forecast, by Type 2019 & 2032
- Table 19: Global Night Vision Apps Revenue million Forecast, by Country 2019 & 2032
- Table 20: United Kingdom Night Vision Apps Revenue (million) Forecast, by Application 2019 & 2032
- Table 21: Germany Night Vision Apps Revenue (million) Forecast, by Application 2019 & 2032
- Table 22: France Night Vision Apps Revenue (million) Forecast, by Application 2019 & 2032
- Table 23: Italy Night Vision Apps Revenue (million) Forecast, by Application 2019 & 2032
- Table 24: Spain Night Vision Apps Revenue (million) Forecast, by Application 2019 & 2032
- Table 25: Russia Night Vision Apps Revenue (million) Forecast, by Application 2019 & 2032
- Table 26: Benelux Night Vision Apps Revenue (million) Forecast, by Application 2019 & 2032
- Table 27: Nordics Night Vision Apps Revenue (million) Forecast, by Application 2019 & 2032
- Table 28: Rest of Europe Night Vision Apps Revenue (million) Forecast, by Application 2019 & 2032
- Table 29: Global Night Vision Apps Revenue million Forecast, by Application 2019 & 2032
- Table 30: Global Night Vision Apps Revenue million Forecast, by Type 2019 & 2032
- Table 31: Global Night Vision Apps Revenue million Forecast, by Country 2019 & 2032
- Table 32: Turkey Night Vision Apps Revenue (million) Forecast, by Application 2019 & 2032
- Table 33: Israel Night Vision Apps Revenue (million) Forecast, by Application 2019 & 2032
- Table 34: GCC Night Vision Apps Revenue (million) Forecast, by Application 2019 & 2032
- Table 35: North Africa Night Vision Apps Revenue (million) Forecast, by Application 2019 & 2032
- Table 36: South Africa Night Vision Apps Revenue (million) Forecast, by Application 2019 & 2032
- Table 37: Rest of Middle East & Africa Night Vision Apps Revenue (million) Forecast, by Application 2019 & 2032
- Table 38: Global Night Vision Apps Revenue million Forecast, by Application 2019 & 2032
- Table 39: Global Night Vision Apps Revenue million Forecast, by Type 2019 & 2032
- Table 40: Global Night Vision Apps Revenue million Forecast, by Country 2019 & 2032
- Table 41: China Night Vision Apps Revenue (million) Forecast, by Application 2019 & 2032
- Table 42: India Night Vision Apps Revenue (million) Forecast, by Application 2019 & 2032
- Table 43: Japan Night Vision Apps Revenue (million) Forecast, by Application 2019 & 2032
- Table 44: South Korea Night Vision Apps Revenue (million) Forecast, by Application 2019 & 2032
- Table 45: ASEAN Night Vision Apps Revenue (million) Forecast, by Application 2019 & 2032
- Table 46: Oceania Night Vision Apps Revenue (million) Forecast, by Application 2019 & 2032
- Table 47: Rest of Asia Pacific Night Vision Apps Revenue (million) Forecast, by Application 2019 & 2032
Frequently Asked Questions
1. What is the projected Compound Annual Growth Rate (CAGR) of the Night Vision Apps?
The projected CAGR is approximately XXX%.
2. Which companies are prominent players in the Night Vision Apps?
Key companies in the market include Almalence, Andro iX, Aploft, Cosmic Mobile, ELRO Europe, Illumes Lite, Just4Fun, NAV, Night Eye, Virtual Night Vision.
3. What are the main segments of the Night Vision Apps?
The market segments include Application, Type.
4. Can you provide details about the market size?
The market size is estimated to be USD XXX million as of 2022.
5. What are some drivers contributing to market growth?
N/A
6. What are the notable trends driving market growth?
N/A
7. Are there any restraints impacting market growth?
N/A
8. Can you provide examples of recent developments in the market?
N/A
9. What pricing options are available for accessing the report?
Pricing options include single-user, multi-user, and enterprise licenses priced at USD 3950.00, USD 5925.00, and USD 7900.00 respectively.
10. Is the market size provided in terms of value or volume?
The market size is provided in terms of value, measured in million.
11. Are there any specific market keywords associated with the report?
Yes, the market keyword associated with the report is "Night Vision Apps," which aids in identifying and referencing the specific market segment covered.
12. How do I determine which pricing option suits my needs best?
The pricing options vary based on user requirements and access needs. Individual users may opt for single-user licenses, while businesses requiring broader access may choose multi-user or enterprise licenses for cost-effective access to the report.
13. Are there any additional resources or data provided in the Night Vision Apps report?
While the report offers comprehensive insights, it's advisable to review the specific contents or supplementary materials provided to ascertain if additional resources or data are available.
14. How can I stay updated on further developments or reports in the Night Vision Apps?
To stay informed about further developments, trends, and reports in the Night Vision Apps, consider subscribing to industry newsletters, following relevant companies and organizations, or regularly checking reputable industry news sources and publications.
Methodology
Step 1 - Identification of Relevant Samples Size from Population Database


Step 2 - Approaches for Defining Global Market Size (Value, Volume* & Price*)

Note*: In applicable scenarios
Step 3 - Data Sources
Primary Research
- Web Analytics
- Survey Reports
- Research Institute
- Latest Research Reports
- Opinion Leaders
Secondary Research
- Annual Reports
- White Paper
- Latest Press Release
- Industry Association
- Paid Database
- Investor Presentations

Step 4 - Data Triangulation
Involves using different sources of information in order to increase the validity of a study
These sources are likely to be stakeholders in a program - participants, other researchers, program staff, other community members, and so on.
Then we put all data in single framework & apply various statistical tools to find out the dynamic on the market.
During the analysis stage, feedback from the stakeholder groups would be compared to determine areas of agreement as well as areas of divergence
