

Key Insights
The Non-Halogenated Flame Retardants (NHFR) chemicals market is experiencing robust growth, driven by stringent regulations against halogenated flame retardants due to their environmental and health concerns. The market's compound annual growth rate (CAGR) exceeding 5% signifies significant expansion, projected to continue through 2033. Key drivers include the increasing demand for flame-retardant materials in various end-use sectors, particularly electronics, construction, and transportation, where safety and regulatory compliance are paramount. The shift towards sustainable and eco-friendly materials is further fueling the adoption of NHFRs. The inorganic segment, encompassing materials like aluminum hydroxide and magnesium hydroxide, currently holds a substantial market share due to their cost-effectiveness and established application history. However, the organic segment, including phosphorus-based and nitrogen-based compounds, is witnessing accelerated growth owing to their superior performance characteristics and expanding applications in high-performance materials. Growth within the organic segment is further propelled by ongoing research and development in creating novel, more efficient, and sustainable NHFR formulations. Market segmentation by end-user industry reveals that the electrical and electronics sector is a major consumer of NHFRs, followed by buildings and construction, reflecting the critical need for fire safety in these sectors. Competitive dynamics are shaped by established players like ICL, Clariant, and BASF, alongside emerging regional manufacturers, creating a dynamic market landscape. Geographic distribution shows strong growth across Asia-Pacific, fueled by rapid industrialization and infrastructure development, with North America and Europe maintaining significant market shares due to their established regulatory frameworks and strong demand for safety standards.
The market faces certain restraints, primarily the higher cost of some NHFRs compared to their halogenated counterparts. However, this is being mitigated by technological advancements leading to cost reductions and improved efficiencies. Further challenges include the need for continuous innovation to meet evolving performance requirements in diverse applications. To address these challenges, industry participants are investing in research and development to produce high-performance, cost-effective, and environmentally sustainable NHFR solutions. This ongoing innovation, coupled with stricter environmental regulations and increased awareness of fire safety, is expected to drive continuous growth within the NHFR market throughout the forecast period. The market is expected to witness increased consolidation through mergers and acquisitions as companies strive to expand their product portfolios and market reach.

Non-Halogenated Flame Retardants Chemicals Industry Market Report: 2019-2033
This comprehensive report provides an in-depth analysis of the Non-Halogenated Flame Retardants Chemicals market, encompassing market dynamics, growth trends, regional analysis, product landscape, key players, and future outlook. The study period covers 2019-2033, with 2025 as the base and estimated year. This report is essential for industry professionals, investors, and strategic decision-makers seeking a clear understanding of this dynamic market. The report analyzes the parent market of Specialty Chemicals and the child market of Flame Retardants, providing a nuanced perspective on market segmentation and growth drivers.
Non-Halogenated Flame Retardants Chemicals Industry Market Dynamics & Structure
The Non-Halogenated Flame Retardants Chemicals market exhibits a moderately concentrated structure with key players such as ICL, Clariant, and BASF SE holding significant market share. Market concentration is expected to remain relatively stable over the forecast period, although M&A activity may lead to some shifts. Technological innovation, driven by stringent environmental regulations and demand for enhanced performance, plays a crucial role in shaping market dynamics. The increasing adoption of sustainable and eco-friendly flame retardants is a key driver. Regulatory frameworks, particularly those restricting the use of halogenated flame retardants, are significantly influencing market growth. Competitive product substitutes, including novel materials and alternative fire safety solutions, present ongoing challenges. End-user demographics, primarily driven by growth in the electrical & electronics and construction sectors, further shape market demand.
- Market Concentration: Moderately Concentrated (xx% market share held by top 5 players in 2025)
- M&A Activity: xx deals completed between 2019-2024, with an average deal value of $xx million.
- Technological Innovation: Focus on phosphorus-based and other inorganic compounds.
- Regulatory Landscape: Stricter regulations driving the adoption of non-halogenated alternatives.
Non-Halogenated Flame Retardants Chemicals Industry Growth Trends & Insights
The Non-Halogenated Flame Retardants Chemicals market experienced significant growth between 2019 and 2024, driven by increasing demand from various end-use sectors. The market size reached $xx million in 2024 and is projected to reach $xx million by 2033, exhibiting a CAGR of xx% during the forecast period (2025-2033). This growth is fueled by the rising adoption of non-halogenated alternatives due to stricter environmental regulations and growing consumer awareness of health and safety concerns associated with halogenated compounds. Technological disruptions, such as the development of high-performance, eco-friendly flame retardants, are accelerating market expansion. Consumer behavior shifts towards sustainable products are further boosting demand. Market penetration in key end-use sectors such as electronics and construction remains high but offers significant scope for expansion in emerging markets.

Dominant Regions, Countries, or Segments in Non-Halogenated Flame Retardants Chemicals Industry
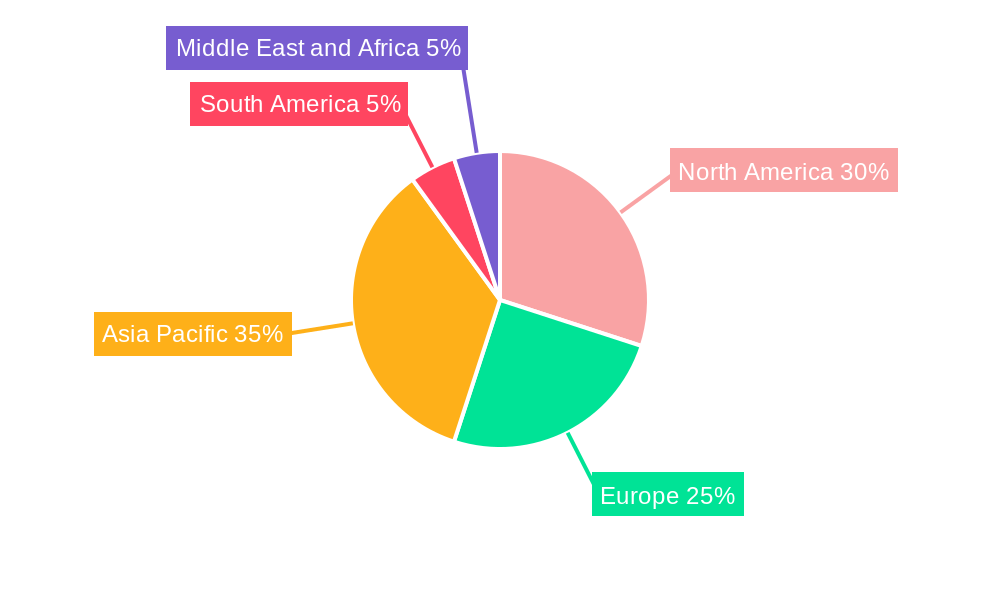
The Asia-Pacific region is currently the dominant market for non-halogenated flame retardants, driven by rapid industrialization and infrastructure development in countries like China and India. North America and Europe also hold significant market share, fueled by stringent environmental regulations and a focus on sustainable materials.
Leading Segments:
- Type: Inorganic flame retardants command the largest market share (xx% in 2025), owing to their cost-effectiveness and wide applicability.
- End-user Industry: The electrical and electronics sector represents the largest end-user segment (xx% in 2025) due to its high demand for flame-retardant materials in electronic devices. Buildings and construction also represent a significant segment.
Key Drivers:
- Stringent Environmental Regulations: Bans and restrictions on halogenated flame retardants are accelerating market growth.
- Infrastructure Development: Large-scale infrastructure projects in developing countries boost demand.
- Rising Disposable Incomes: Increased purchasing power in developing economies drives demand for electronic goods and appliances.
Non-Halogenated Flame Retardants Chemicals Industry Product Landscape
The non-halogenated flame retardants market showcases a diverse product landscape, featuring inorganic and organic compounds such as phosphorus-based, nitrogen-based, and boron-based materials. Ongoing innovation focuses on enhancing performance characteristics like thermal stability, flame-retardant efficiency, and processability. Unique selling propositions (USPs) include improved efficacy at lower loadings, enhanced compatibility with various polymers, and reduced environmental impact. Technological advancements concentrate on nanotechnology-based flame retardants and synergistic blends for optimizing performance and cost-effectiveness.
Key Drivers, Barriers & Challenges in Non-Halogenated Flame Retardants Chemicals Industry
Key Drivers:
- Growing demand from electronics, construction, and transportation sectors.
- Stringent regulations against halogenated flame retardants.
- Focus on sustainable and environmentally friendly solutions.
Key Challenges:
- High initial investment costs for new technologies.
- Potential supply chain disruptions due to raw material scarcity.
- Meeting the performance requirements of diverse applications.
- Intense competition from existing and emerging players.
Emerging Opportunities in Non-Halogenated Flame Retardants Chemicals Industry
Emerging opportunities lie in developing advanced materials with superior performance characteristics. Untapped markets in developing economies offer significant growth potential. Focus on eco-friendly and bio-based flame retardants will drive innovation. Collaboration with end-users to develop customized solutions represents a key area of opportunity.
Growth Accelerators in the Non-Halogenated Flame Retardants Chemicals Industry
Strategic partnerships between chemical manufacturers and end-use industries to co-develop innovative flame-retardant solutions are accelerating market growth. Technological advancements, like the development of high-performance, cost-effective flame retardants, are fueling expansion. Market expansion strategies, including entering new geographical regions and developing new product applications, are also contributing to growth.
Key Players Shaping the Non-Halogenated Flame Retardants Chemicals Market
- ICL
- DIC Corporation
- TOR Minerals
- Clariant
- Jiangsu Jacques Technology Co Ltd
- MPI Chemie BV
- Italmatch Chemicals SpA
- LANXESS
- Nippon Carbide Industries Co Inc (Sanwa Chemical Industry Co Ltd)
- BASF SE
- Rin Kagaku Kogyo Co Ltd
- Shandong Brother Sci & Tech Co Ltd
- Nabaltec AG
- Thor
- Eti Maden
- Apexical Inc
- NYACOL Nano Technologies Inc
- Huber Engineered Materials
- Daihachi Chemical Industry Co Ltd
Notable Milestones in Non-Halogenated Flame Retardants Chemicals Industry Sector
- 2021 Q3: Clariant launched a new range of phosphorus-based flame retardants.
- 2022 Q1: BASF SE and ICL announced a joint venture for the production of a novel flame retardant.
- 2023 Q2: New regulations on halogenated flame retardants were implemented in the EU.
In-Depth Non-Halogenated Flame Retardants Chemicals Industry Market Outlook
The Non-Halogenated Flame Retardants Chemicals market is poised for significant growth over the next decade, driven by sustained demand from various end-use sectors and continued innovation in eco-friendly flame retardant technologies. Strategic investments in research and development, coupled with strategic partnerships and market expansion strategies, will shape the future of the industry. The focus will remain on developing high-performance, sustainable solutions that meet stringent environmental regulations and address evolving consumer preferences. The market offers significant opportunities for players who can leverage technological advancements and adopt innovative business strategies.
Non-Halogenated Flame Retardants Chemicals Industry Segmentation
-
1. Type
-
1.1. Inorganic
- 1.1.1. Aluminum Hydroxide
- 1.1.2. Magnesium Hydroxide
- 1.1.3. Boron Compounds
- 1.2. Phosphorus
- 1.3. Nitrogen
- 1.4. Other Types
-
1.1. Inorganic
-
2. End-user Industry
- 2.1. Electrical and Electronics
- 2.2. Buildings and Construction
- 2.3. Transportation
- 2.4. Textiles and Furniture
Non-Halogenated Flame Retardants Chemicals Industry Segmentation By Geography
-
1. Asia Pacific
- 1.1. China
- 1.2. India
- 1.3. Japan
- 1.4. South Korea
- 1.5. Rest of Asia Pacific
-
2. North America
- 2.1. United States
- 2.2. Canada
- 2.3. Mexico
-
3. Europe
- 3.1. Germany
- 3.2. United Kingdom
- 3.3. Italy
- 3.4. France
- 3.5. Rest of Europe
-
4. South America
- 4.1. Brazil
- 4.2. Argentina
- 4.3. Rest of South America
-
5. Middle East and Africa
- 5.1. Saudi Arabia
- 5.2. South Africa
- 5.3. Rest of Middle East and Africa
Non-Halogenated Flame Retardants Chemicals Industry REPORT HIGHLIGHTS
| Aspects | Details |
|---|---|
| Study Period | 2019-2033 |
| Base Year | 2024 |
| Estimated Year | 2025 |
| Forecast Period | 2025-2033 |
| Historical Period | 2019-2024 |
| Growth Rate | CAGR of > 5.00% from 2019-2033 |
| Segmentation |
|
Table of Contents
- 1. Introduction
- 1.1. Research Scope
- 1.2. Market Segmentation
- 1.3. Research Methodology
- 1.4. Definitions and Assumptions
- 2. Executive Summary
- 2.1. Introduction
- 3. Market Dynamics
- 3.1. Introduction
- 3.2. Market Drivers
- 3.2.1. ; Environmental and Health Concerns Regarding Brominated and Other Flame Retardants; Increasing Infrastructure Activities in Asia-Pacific; Rising Consumer Electrical and Electronic Goods Manufacturing
- 3.3. Market Restrains
- 3.3.1. ; Non-suitability of Hydroxides to High Temperature Applications
- 3.4. Market Trends
- 3.4.1. Increasing Demand from the Buildings and Construction Industry
- 4. Market Factor Analysis
- 4.1. Porters Five Forces
- 4.2. Supply/Value Chain
- 4.3. PESTEL analysis
- 4.4. Market Entropy
- 4.5. Patent/Trademark Analysis
- 5. Global Non-Halogenated Flame Retardants Chemicals Industry Analysis, Insights and Forecast, 2019-2031
- 5.1. Market Analysis, Insights and Forecast - by Type
- 5.1.1. Inorganic
- 5.1.1.1. Aluminum Hydroxide
- 5.1.1.2. Magnesium Hydroxide
- 5.1.1.3. Boron Compounds
- 5.1.2. Phosphorus
- 5.1.3. Nitrogen
- 5.1.4. Other Types
- 5.1.1. Inorganic
- 5.2. Market Analysis, Insights and Forecast - by End-user Industry
- 5.2.1. Electrical and Electronics
- 5.2.2. Buildings and Construction
- 5.2.3. Transportation
- 5.2.4. Textiles and Furniture
- 5.3. Market Analysis, Insights and Forecast - by Region
- 5.3.1. Asia Pacific
- 5.3.2. North America
- 5.3.3. Europe
- 5.3.4. South America
- 5.3.5. Middle East and Africa
- 5.1. Market Analysis, Insights and Forecast - by Type
- 6. Asia Pacific Non-Halogenated Flame Retardants Chemicals Industry Analysis, Insights and Forecast, 2019-2031
- 6.1. Market Analysis, Insights and Forecast - by Type
- 6.1.1. Inorganic
- 6.1.1.1. Aluminum Hydroxide
- 6.1.1.2. Magnesium Hydroxide
- 6.1.1.3. Boron Compounds
- 6.1.2. Phosphorus
- 6.1.3. Nitrogen
- 6.1.4. Other Types
- 6.1.1. Inorganic
- 6.2. Market Analysis, Insights and Forecast - by End-user Industry
- 6.2.1. Electrical and Electronics
- 6.2.2. Buildings and Construction
- 6.2.3. Transportation
- 6.2.4. Textiles and Furniture
- 6.1. Market Analysis, Insights and Forecast - by Type
- 7. North America Non-Halogenated Flame Retardants Chemicals Industry Analysis, Insights and Forecast, 2019-2031
- 7.1. Market Analysis, Insights and Forecast - by Type
- 7.1.1. Inorganic
- 7.1.1.1. Aluminum Hydroxide
- 7.1.1.2. Magnesium Hydroxide
- 7.1.1.3. Boron Compounds
- 7.1.2. Phosphorus
- 7.1.3. Nitrogen
- 7.1.4. Other Types
- 7.1.1. Inorganic
- 7.2. Market Analysis, Insights and Forecast - by End-user Industry
- 7.2.1. Electrical and Electronics
- 7.2.2. Buildings and Construction
- 7.2.3. Transportation
- 7.2.4. Textiles and Furniture
- 7.1. Market Analysis, Insights and Forecast - by Type
- 8. Europe Non-Halogenated Flame Retardants Chemicals Industry Analysis, Insights and Forecast, 2019-2031
- 8.1. Market Analysis, Insights and Forecast - by Type
- 8.1.1. Inorganic
- 8.1.1.1. Aluminum Hydroxide
- 8.1.1.2. Magnesium Hydroxide
- 8.1.1.3. Boron Compounds
- 8.1.2. Phosphorus
- 8.1.3. Nitrogen
- 8.1.4. Other Types
- 8.1.1. Inorganic
- 8.2. Market Analysis, Insights and Forecast - by End-user Industry
- 8.2.1. Electrical and Electronics
- 8.2.2. Buildings and Construction
- 8.2.3. Transportation
- 8.2.4. Textiles and Furniture
- 8.1. Market Analysis, Insights and Forecast - by Type
- 9. South America Non-Halogenated Flame Retardants Chemicals Industry Analysis, Insights and Forecast, 2019-2031
- 9.1. Market Analysis, Insights and Forecast - by Type
- 9.1.1. Inorganic
- 9.1.1.1. Aluminum Hydroxide
- 9.1.1.2. Magnesium Hydroxide
- 9.1.1.3. Boron Compounds
- 9.1.2. Phosphorus
- 9.1.3. Nitrogen
- 9.1.4. Other Types
- 9.1.1. Inorganic
- 9.2. Market Analysis, Insights and Forecast - by End-user Industry
- 9.2.1. Electrical and Electronics
- 9.2.2. Buildings and Construction
- 9.2.3. Transportation
- 9.2.4. Textiles and Furniture
- 9.1. Market Analysis, Insights and Forecast - by Type
- 10. Middle East and Africa Non-Halogenated Flame Retardants Chemicals Industry Analysis, Insights and Forecast, 2019-2031
- 10.1. Market Analysis, Insights and Forecast - by Type
- 10.1.1. Inorganic
- 10.1.1.1. Aluminum Hydroxide
- 10.1.1.2. Magnesium Hydroxide
- 10.1.1.3. Boron Compounds
- 10.1.2. Phosphorus
- 10.1.3. Nitrogen
- 10.1.4. Other Types
- 10.1.1. Inorganic
- 10.2. Market Analysis, Insights and Forecast - by End-user Industry
- 10.2.1. Electrical and Electronics
- 10.2.2. Buildings and Construction
- 10.2.3. Transportation
- 10.2.4. Textiles and Furniture
- 10.1. Market Analysis, Insights and Forecast - by Type
- 11. North America Non-Halogenated Flame Retardants Chemicals Industry Analysis, Insights and Forecast, 2019-2031
- 11.1. Market Analysis, Insights and Forecast - By Country/Sub-region
- 11.1.1 United States
- 11.1.2 Canada
- 11.1.3 Mexico
- 12. Europe Non-Halogenated Flame Retardants Chemicals Industry Analysis, Insights and Forecast, 2019-2031
- 12.1. Market Analysis, Insights and Forecast - By Country/Sub-region
- 12.1.1 Germany
- 12.1.2 France
- 12.1.3 Italy
- 12.1.4 United Kingdom
- 12.1.5 Netherlands
- 12.1.6 Rest of Europe
- 13. Asia Pacific Non-Halogenated Flame Retardants Chemicals Industry Analysis, Insights and Forecast, 2019-2031
- 13.1. Market Analysis, Insights and Forecast - By Country/Sub-region
- 13.1.1 China
- 13.1.2 Japan
- 13.1.3 India
- 13.1.4 South Korea
- 13.1.5 Taiwan
- 13.1.6 Australia
- 13.1.7 Rest of Asia-Pacific
- 14. South America Non-Halogenated Flame Retardants Chemicals Industry Analysis, Insights and Forecast, 2019-2031
- 14.1. Market Analysis, Insights and Forecast - By Country/Sub-region
- 14.1.1 Brazil
- 14.1.2 Argentina
- 14.1.3 Rest of South America
- 15. Middle East and Africa Non-Halogenated Flame Retardants Chemicals Industry Analysis, Insights and Forecast, 2019-2031
- 15.1. Market Analysis, Insights and Forecast - By Country/Sub-region
- 15.1.1 Middle East
- 15.1.2 Africa
- 16. Competitive Analysis
- 16.1. Global Market Share Analysis 2024
- 16.2. Company Profiles
- 16.2.1 ICL
- 16.2.1.1. Overview
- 16.2.1.2. Products
- 16.2.1.3. SWOT Analysis
- 16.2.1.4. Recent Developments
- 16.2.1.5. Financials (Based on Availability)
- 16.2.2 DIC Corporation
- 16.2.2.1. Overview
- 16.2.2.2. Products
- 16.2.2.3. SWOT Analysis
- 16.2.2.4. Recent Developments
- 16.2.2.5. Financials (Based on Availability)
- 16.2.3 TOR Minerals
- 16.2.3.1. Overview
- 16.2.3.2. Products
- 16.2.3.3. SWOT Analysis
- 16.2.3.4. Recent Developments
- 16.2.3.5. Financials (Based on Availability)
- 16.2.4 Clariant
- 16.2.4.1. Overview
- 16.2.4.2. Products
- 16.2.4.3. SWOT Analysis
- 16.2.4.4. Recent Developments
- 16.2.4.5. Financials (Based on Availability)
- 16.2.5 Jiangsu Jacques Technology Co Ltd
- 16.2.5.1. Overview
- 16.2.5.2. Products
- 16.2.5.3. SWOT Analysis
- 16.2.5.4. Recent Developments
- 16.2.5.5. Financials (Based on Availability)
- 16.2.6 MPI Chemie BV
- 16.2.6.1. Overview
- 16.2.6.2. Products
- 16.2.6.3. SWOT Analysis
- 16.2.6.4. Recent Developments
- 16.2.6.5. Financials (Based on Availability)
- 16.2.7 Italmatch Chemicals SpA
- 16.2.7.1. Overview
- 16.2.7.2. Products
- 16.2.7.3. SWOT Analysis
- 16.2.7.4. Recent Developments
- 16.2.7.5. Financials (Based on Availability)
- 16.2.8 LANXESS
- 16.2.8.1. Overview
- 16.2.8.2. Products
- 16.2.8.3. SWOT Analysis
- 16.2.8.4. Recent Developments
- 16.2.8.5. Financials (Based on Availability)
- 16.2.9 Nippon Carbide Indestries Co Inc (Sanwa Chemical Industry Co Ltd)
- 16.2.9.1. Overview
- 16.2.9.2. Products
- 16.2.9.3. SWOT Analysis
- 16.2.9.4. Recent Developments
- 16.2.9.5. Financials (Based on Availability)
- 16.2.10 BASF SE
- 16.2.10.1. Overview
- 16.2.10.2. Products
- 16.2.10.3. SWOT Analysis
- 16.2.10.4. Recent Developments
- 16.2.10.5. Financials (Based on Availability)
- 16.2.11 Rin Kagaku Kogyo Co Ltd
- 16.2.11.1. Overview
- 16.2.11.2. Products
- 16.2.11.3. SWOT Analysis
- 16.2.11.4. Recent Developments
- 16.2.11.5. Financials (Based on Availability)
- 16.2.12 Shandong Brother Sci &Tech Co Ltd
- 16.2.12.1. Overview
- 16.2.12.2. Products
- 16.2.12.3. SWOT Analysis
- 16.2.12.4. Recent Developments
- 16.2.12.5. Financials (Based on Availability)
- 16.2.13 Nabaltec AG
- 16.2.13.1. Overview
- 16.2.13.2. Products
- 16.2.13.3. SWOT Analysis
- 16.2.13.4. Recent Developments
- 16.2.13.5. Financials (Based on Availability)
- 16.2.14 Thor
- 16.2.14.1. Overview
- 16.2.14.2. Products
- 16.2.14.3. SWOT Analysis
- 16.2.14.4. Recent Developments
- 16.2.14.5. Financials (Based on Availability)
- 16.2.15 Eti Maden
- 16.2.15.1. Overview
- 16.2.15.2. Products
- 16.2.15.3. SWOT Analysis
- 16.2.15.4. Recent Developments
- 16.2.15.5. Financials (Based on Availability)
- 16.2.16 Apexical Inc
- 16.2.16.1. Overview
- 16.2.16.2. Products
- 16.2.16.3. SWOT Analysis
- 16.2.16.4. Recent Developments
- 16.2.16.5. Financials (Based on Availability)
- 16.2.17 NYACOL Nano Technologies Inc
- 16.2.17.1. Overview
- 16.2.17.2. Products
- 16.2.17.3. SWOT Analysis
- 16.2.17.4. Recent Developments
- 16.2.17.5. Financials (Based on Availability)
- 16.2.18 Huber Engineered Materials
- 16.2.18.1. Overview
- 16.2.18.2. Products
- 16.2.18.3. SWOT Analysis
- 16.2.18.4. Recent Developments
- 16.2.18.5. Financials (Based on Availability)
- 16.2.19 Daihachi Chemical Industry Co Ltd
- 16.2.19.1. Overview
- 16.2.19.2. Products
- 16.2.19.3. SWOT Analysis
- 16.2.19.4. Recent Developments
- 16.2.19.5. Financials (Based on Availability)
- 16.2.1 ICL
List of Figures
- Figure 1: Global Non-Halogenated Flame Retardants Chemicals Industry Revenue Breakdown (Million, %) by Region 2024 & 2032
- Figure 2: Global Non-Halogenated Flame Retardants Chemicals Industry Volume Breakdown (K Tons, %) by Region 2024 & 2032
- Figure 3: North America Non-Halogenated Flame Retardants Chemicals Industry Revenue (Million), by Country 2024 & 2032
- Figure 4: North America Non-Halogenated Flame Retardants Chemicals Industry Volume (K Tons), by Country 2024 & 2032
- Figure 5: North America Non-Halogenated Flame Retardants Chemicals Industry Revenue Share (%), by Country 2024 & 2032
- Figure 6: North America Non-Halogenated Flame Retardants Chemicals Industry Volume Share (%), by Country 2024 & 2032
- Figure 7: Europe Non-Halogenated Flame Retardants Chemicals Industry Revenue (Million), by Country 2024 & 2032
- Figure 8: Europe Non-Halogenated Flame Retardants Chemicals Industry Volume (K Tons), by Country 2024 & 2032
- Figure 9: Europe Non-Halogenated Flame Retardants Chemicals Industry Revenue Share (%), by Country 2024 & 2032
- Figure 10: Europe Non-Halogenated Flame Retardants Chemicals Industry Volume Share (%), by Country 2024 & 2032
- Figure 11: Asia Pacific Non-Halogenated Flame Retardants Chemicals Industry Revenue (Million), by Country 2024 & 2032
- Figure 12: Asia Pacific Non-Halogenated Flame Retardants Chemicals Industry Volume (K Tons), by Country 2024 & 2032
- Figure 13: Asia Pacific Non-Halogenated Flame Retardants Chemicals Industry Revenue Share (%), by Country 2024 & 2032
- Figure 14: Asia Pacific Non-Halogenated Flame Retardants Chemicals Industry Volume Share (%), by Country 2024 & 2032
- Figure 15: South America Non-Halogenated Flame Retardants Chemicals Industry Revenue (Million), by Country 2024 & 2032
- Figure 16: South America Non-Halogenated Flame Retardants Chemicals Industry Volume (K Tons), by Country 2024 & 2032
- Figure 17: South America Non-Halogenated Flame Retardants Chemicals Industry Revenue Share (%), by Country 2024 & 2032
- Figure 18: South America Non-Halogenated Flame Retardants Chemicals Industry Volume Share (%), by Country 2024 & 2032
- Figure 19: Middle East and Africa Non-Halogenated Flame Retardants Chemicals Industry Revenue (Million), by Country 2024 & 2032
- Figure 20: Middle East and Africa Non-Halogenated Flame Retardants Chemicals Industry Volume (K Tons), by Country 2024 & 2032
- Figure 21: Middle East and Africa Non-Halogenated Flame Retardants Chemicals Industry Revenue Share (%), by Country 2024 & 2032
- Figure 22: Middle East and Africa Non-Halogenated Flame Retardants Chemicals Industry Volume Share (%), by Country 2024 & 2032
- Figure 23: Asia Pacific Non-Halogenated Flame Retardants Chemicals Industry Revenue (Million), by Type 2024 & 2032
- Figure 24: Asia Pacific Non-Halogenated Flame Retardants Chemicals Industry Volume (K Tons), by Type 2024 & 2032
- Figure 25: Asia Pacific Non-Halogenated Flame Retardants Chemicals Industry Revenue Share (%), by Type 2024 & 2032
- Figure 26: Asia Pacific Non-Halogenated Flame Retardants Chemicals Industry Volume Share (%), by Type 2024 & 2032
- Figure 27: Asia Pacific Non-Halogenated Flame Retardants Chemicals Industry Revenue (Million), by End-user Industry 2024 & 2032
- Figure 28: Asia Pacific Non-Halogenated Flame Retardants Chemicals Industry Volume (K Tons), by End-user Industry 2024 & 2032
- Figure 29: Asia Pacific Non-Halogenated Flame Retardants Chemicals Industry Revenue Share (%), by End-user Industry 2024 & 2032
- Figure 30: Asia Pacific Non-Halogenated Flame Retardants Chemicals Industry Volume Share (%), by End-user Industry 2024 & 2032
- Figure 31: Asia Pacific Non-Halogenated Flame Retardants Chemicals Industry Revenue (Million), by Country 2024 & 2032
- Figure 32: Asia Pacific Non-Halogenated Flame Retardants Chemicals Industry Volume (K Tons), by Country 2024 & 2032
- Figure 33: Asia Pacific Non-Halogenated Flame Retardants Chemicals Industry Revenue Share (%), by Country 2024 & 2032
- Figure 34: Asia Pacific Non-Halogenated Flame Retardants Chemicals Industry Volume Share (%), by Country 2024 & 2032
- Figure 35: North America Non-Halogenated Flame Retardants Chemicals Industry Revenue (Million), by Type 2024 & 2032
- Figure 36: North America Non-Halogenated Flame Retardants Chemicals Industry Volume (K Tons), by Type 2024 & 2032
- Figure 37: North America Non-Halogenated Flame Retardants Chemicals Industry Revenue Share (%), by Type 2024 & 2032
- Figure 38: North America Non-Halogenated Flame Retardants Chemicals Industry Volume Share (%), by Type 2024 & 2032
- Figure 39: North America Non-Halogenated Flame Retardants Chemicals Industry Revenue (Million), by End-user Industry 2024 & 2032
- Figure 40: North America Non-Halogenated Flame Retardants Chemicals Industry Volume (K Tons), by End-user Industry 2024 & 2032
- Figure 41: North America Non-Halogenated Flame Retardants Chemicals Industry Revenue Share (%), by End-user Industry 2024 & 2032
- Figure 42: North America Non-Halogenated Flame Retardants Chemicals Industry Volume Share (%), by End-user Industry 2024 & 2032
- Figure 43: North America Non-Halogenated Flame Retardants Chemicals Industry Revenue (Million), by Country 2024 & 2032
- Figure 44: North America Non-Halogenated Flame Retardants Chemicals Industry Volume (K Tons), by Country 2024 & 2032
- Figure 45: North America Non-Halogenated Flame Retardants Chemicals Industry Revenue Share (%), by Country 2024 & 2032
- Figure 46: North America Non-Halogenated Flame Retardants Chemicals Industry Volume Share (%), by Country 2024 & 2032
- Figure 47: Europe Non-Halogenated Flame Retardants Chemicals Industry Revenue (Million), by Type 2024 & 2032
- Figure 48: Europe Non-Halogenated Flame Retardants Chemicals Industry Volume (K Tons), by Type 2024 & 2032
- Figure 49: Europe Non-Halogenated Flame Retardants Chemicals Industry Revenue Share (%), by Type 2024 & 2032
- Figure 50: Europe Non-Halogenated Flame Retardants Chemicals Industry Volume Share (%), by Type 2024 & 2032
- Figure 51: Europe Non-Halogenated Flame Retardants Chemicals Industry Revenue (Million), by End-user Industry 2024 & 2032
- Figure 52: Europe Non-Halogenated Flame Retardants Chemicals Industry Volume (K Tons), by End-user Industry 2024 & 2032
- Figure 53: Europe Non-Halogenated Flame Retardants Chemicals Industry Revenue Share (%), by End-user Industry 2024 & 2032
- Figure 54: Europe Non-Halogenated Flame Retardants Chemicals Industry Volume Share (%), by End-user Industry 2024 & 2032
- Figure 55: Europe Non-Halogenated Flame Retardants Chemicals Industry Revenue (Million), by Country 2024 & 2032
- Figure 56: Europe Non-Halogenated Flame Retardants Chemicals Industry Volume (K Tons), by Country 2024 & 2032
- Figure 57: Europe Non-Halogenated Flame Retardants Chemicals Industry Revenue Share (%), by Country 2024 & 2032
- Figure 58: Europe Non-Halogenated Flame Retardants Chemicals Industry Volume Share (%), by Country 2024 & 2032
- Figure 59: South America Non-Halogenated Flame Retardants Chemicals Industry Revenue (Million), by Type 2024 & 2032
- Figure 60: South America Non-Halogenated Flame Retardants Chemicals Industry Volume (K Tons), by Type 2024 & 2032
- Figure 61: South America Non-Halogenated Flame Retardants Chemicals Industry Revenue Share (%), by Type 2024 & 2032
- Figure 62: South America Non-Halogenated Flame Retardants Chemicals Industry Volume Share (%), by Type 2024 & 2032
- Figure 63: South America Non-Halogenated Flame Retardants Chemicals Industry Revenue (Million), by End-user Industry 2024 & 2032
- Figure 64: South America Non-Halogenated Flame Retardants Chemicals Industry Volume (K Tons), by End-user Industry 2024 & 2032
- Figure 65: South America Non-Halogenated Flame Retardants Chemicals Industry Revenue Share (%), by End-user Industry 2024 & 2032
- Figure 66: South America Non-Halogenated Flame Retardants Chemicals Industry Volume Share (%), by End-user Industry 2024 & 2032
- Figure 67: South America Non-Halogenated Flame Retardants Chemicals Industry Revenue (Million), by Country 2024 & 2032
- Figure 68: South America Non-Halogenated Flame Retardants Chemicals Industry Volume (K Tons), by Country 2024 & 2032
- Figure 69: South America Non-Halogenated Flame Retardants Chemicals Industry Revenue Share (%), by Country 2024 & 2032
- Figure 70: South America Non-Halogenated Flame Retardants Chemicals Industry Volume Share (%), by Country 2024 & 2032
- Figure 71: Middle East and Africa Non-Halogenated Flame Retardants Chemicals Industry Revenue (Million), by Type 2024 & 2032
- Figure 72: Middle East and Africa Non-Halogenated Flame Retardants Chemicals Industry Volume (K Tons), by Type 2024 & 2032
- Figure 73: Middle East and Africa Non-Halogenated Flame Retardants Chemicals Industry Revenue Share (%), by Type 2024 & 2032
- Figure 74: Middle East and Africa Non-Halogenated Flame Retardants Chemicals Industry Volume Share (%), by Type 2024 & 2032
- Figure 75: Middle East and Africa Non-Halogenated Flame Retardants Chemicals Industry Revenue (Million), by End-user Industry 2024 & 2032
- Figure 76: Middle East and Africa Non-Halogenated Flame Retardants Chemicals Industry Volume (K Tons), by End-user Industry 2024 & 2032
- Figure 77: Middle East and Africa Non-Halogenated Flame Retardants Chemicals Industry Revenue Share (%), by End-user Industry 2024 & 2032
- Figure 78: Middle East and Africa Non-Halogenated Flame Retardants Chemicals Industry Volume Share (%), by End-user Industry 2024 & 2032
- Figure 79: Middle East and Africa Non-Halogenated Flame Retardants Chemicals Industry Revenue (Million), by Country 2024 & 2032
- Figure 80: Middle East and Africa Non-Halogenated Flame Retardants Chemicals Industry Volume (K Tons), by Country 2024 & 2032
- Figure 81: Middle East and Africa Non-Halogenated Flame Retardants Chemicals Industry Revenue Share (%), by Country 2024 & 2032
- Figure 82: Middle East and Africa Non-Halogenated Flame Retardants Chemicals Industry Volume Share (%), by Country 2024 & 2032
List of Tables
- Table 1: Global Non-Halogenated Flame Retardants Chemicals Industry Revenue Million Forecast, by Region 2019 & 2032
- Table 2: Global Non-Halogenated Flame Retardants Chemicals Industry Volume K Tons Forecast, by Region 2019 & 2032
- Table 3: Global Non-Halogenated Flame Retardants Chemicals Industry Revenue Million Forecast, by Type 2019 & 2032
- Table 4: Global Non-Halogenated Flame Retardants Chemicals Industry Volume K Tons Forecast, by Type 2019 & 2032
- Table 5: Global Non-Halogenated Flame Retardants Chemicals Industry Revenue Million Forecast, by End-user Industry 2019 & 2032
- Table 6: Global Non-Halogenated Flame Retardants Chemicals Industry Volume K Tons Forecast, by End-user Industry 2019 & 2032
- Table 7: Global Non-Halogenated Flame Retardants Chemicals Industry Revenue Million Forecast, by Region 2019 & 2032
- Table 8: Global Non-Halogenated Flame Retardants Chemicals Industry Volume K Tons Forecast, by Region 2019 & 2032
- Table 9: Global Non-Halogenated Flame Retardants Chemicals Industry Revenue Million Forecast, by Country 2019 & 2032
- Table 10: Global Non-Halogenated Flame Retardants Chemicals Industry Volume K Tons Forecast, by Country 2019 & 2032
- Table 11: United States Non-Halogenated Flame Retardants Chemicals Industry Revenue (Million) Forecast, by Application 2019 & 2032
- Table 12: United States Non-Halogenated Flame Retardants Chemicals Industry Volume (K Tons) Forecast, by Application 2019 & 2032
- Table 13: Canada Non-Halogenated Flame Retardants Chemicals Industry Revenue (Million) Forecast, by Application 2019 & 2032
- Table 14: Canada Non-Halogenated Flame Retardants Chemicals Industry Volume (K Tons) Forecast, by Application 2019 & 2032
- Table 15: Mexico Non-Halogenated Flame Retardants Chemicals Industry Revenue (Million) Forecast, by Application 2019 & 2032
- Table 16: Mexico Non-Halogenated Flame Retardants Chemicals Industry Volume (K Tons) Forecast, by Application 2019 & 2032
- Table 17: Global Non-Halogenated Flame Retardants Chemicals Industry Revenue Million Forecast, by Country 2019 & 2032
- Table 18: Global Non-Halogenated Flame Retardants Chemicals Industry Volume K Tons Forecast, by Country 2019 & 2032
- Table 19: Germany Non-Halogenated Flame Retardants Chemicals Industry Revenue (Million) Forecast, by Application 2019 & 2032
- Table 20: Germany Non-Halogenated Flame Retardants Chemicals Industry Volume (K Tons) Forecast, by Application 2019 & 2032
- Table 21: France Non-Halogenated Flame Retardants Chemicals Industry Revenue (Million) Forecast, by Application 2019 & 2032
- Table 22: France Non-Halogenated Flame Retardants Chemicals Industry Volume (K Tons) Forecast, by Application 2019 & 2032
- Table 23: Italy Non-Halogenated Flame Retardants Chemicals Industry Revenue (Million) Forecast, by Application 2019 & 2032
- Table 24: Italy Non-Halogenated Flame Retardants Chemicals Industry Volume (K Tons) Forecast, by Application 2019 & 2032
- Table 25: United Kingdom Non-Halogenated Flame Retardants Chemicals Industry Revenue (Million) Forecast, by Application 2019 & 2032
- Table 26: United Kingdom Non-Halogenated Flame Retardants Chemicals Industry Volume (K Tons) Forecast, by Application 2019 & 2032
- Table 27: Netherlands Non-Halogenated Flame Retardants Chemicals Industry Revenue (Million) Forecast, by Application 2019 & 2032
- Table 28: Netherlands Non-Halogenated Flame Retardants Chemicals Industry Volume (K Tons) Forecast, by Application 2019 & 2032
- Table 29: Rest of Europe Non-Halogenated Flame Retardants Chemicals Industry Revenue (Million) Forecast, by Application 2019 & 2032
- Table 30: Rest of Europe Non-Halogenated Flame Retardants Chemicals Industry Volume (K Tons) Forecast, by Application 2019 & 2032
- Table 31: Global Non-Halogenated Flame Retardants Chemicals Industry Revenue Million Forecast, by Country 2019 & 2032
- Table 32: Global Non-Halogenated Flame Retardants Chemicals Industry Volume K Tons Forecast, by Country 2019 & 2032
- Table 33: China Non-Halogenated Flame Retardants Chemicals Industry Revenue (Million) Forecast, by Application 2019 & 2032
- Table 34: China Non-Halogenated Flame Retardants Chemicals Industry Volume (K Tons) Forecast, by Application 2019 & 2032
- Table 35: Japan Non-Halogenated Flame Retardants Chemicals Industry Revenue (Million) Forecast, by Application 2019 & 2032
- Table 36: Japan Non-Halogenated Flame Retardants Chemicals Industry Volume (K Tons) Forecast, by Application 2019 & 2032
- Table 37: India Non-Halogenated Flame Retardants Chemicals Industry Revenue (Million) Forecast, by Application 2019 & 2032
- Table 38: India Non-Halogenated Flame Retardants Chemicals Industry Volume (K Tons) Forecast, by Application 2019 & 2032
- Table 39: South Korea Non-Halogenated Flame Retardants Chemicals Industry Revenue (Million) Forecast, by Application 2019 & 2032
- Table 40: South Korea Non-Halogenated Flame Retardants Chemicals Industry Volume (K Tons) Forecast, by Application 2019 & 2032
- Table 41: Taiwan Non-Halogenated Flame Retardants Chemicals Industry Revenue (Million) Forecast, by Application 2019 & 2032
- Table 42: Taiwan Non-Halogenated Flame Retardants Chemicals Industry Volume (K Tons) Forecast, by Application 2019 & 2032
- Table 43: Australia Non-Halogenated Flame Retardants Chemicals Industry Revenue (Million) Forecast, by Application 2019 & 2032
- Table 44: Australia Non-Halogenated Flame Retardants Chemicals Industry Volume (K Tons) Forecast, by Application 2019 & 2032
- Table 45: Rest of Asia-Pacific Non-Halogenated Flame Retardants Chemicals Industry Revenue (Million) Forecast, by Application 2019 & 2032
- Table 46: Rest of Asia-Pacific Non-Halogenated Flame Retardants Chemicals Industry Volume (K Tons) Forecast, by Application 2019 & 2032
- Table 47: Global Non-Halogenated Flame Retardants Chemicals Industry Revenue Million Forecast, by Country 2019 & 2032
- Table 48: Global Non-Halogenated Flame Retardants Chemicals Industry Volume K Tons Forecast, by Country 2019 & 2032
- Table 49: Brazil Non-Halogenated Flame Retardants Chemicals Industry Revenue (Million) Forecast, by Application 2019 & 2032
- Table 50: Brazil Non-Halogenated Flame Retardants Chemicals Industry Volume (K Tons) Forecast, by Application 2019 & 2032
- Table 51: Argentina Non-Halogenated Flame Retardants Chemicals Industry Revenue (Million) Forecast, by Application 2019 & 2032
- Table 52: Argentina Non-Halogenated Flame Retardants Chemicals Industry Volume (K Tons) Forecast, by Application 2019 & 2032
- Table 53: Rest of South America Non-Halogenated Flame Retardants Chemicals Industry Revenue (Million) Forecast, by Application 2019 & 2032
- Table 54: Rest of South America Non-Halogenated Flame Retardants Chemicals Industry Volume (K Tons) Forecast, by Application 2019 & 2032
- Table 55: Global Non-Halogenated Flame Retardants Chemicals Industry Revenue Million Forecast, by Country 2019 & 2032
- Table 56: Global Non-Halogenated Flame Retardants Chemicals Industry Volume K Tons Forecast, by Country 2019 & 2032
- Table 57: Middle East Non-Halogenated Flame Retardants Chemicals Industry Revenue (Million) Forecast, by Application 2019 & 2032
- Table 58: Middle East Non-Halogenated Flame Retardants Chemicals Industry Volume (K Tons) Forecast, by Application 2019 & 2032
- Table 59: Africa Non-Halogenated Flame Retardants Chemicals Industry Revenue (Million) Forecast, by Application 2019 & 2032
- Table 60: Africa Non-Halogenated Flame Retardants Chemicals Industry Volume (K Tons) Forecast, by Application 2019 & 2032
- Table 61: Global Non-Halogenated Flame Retardants Chemicals Industry Revenue Million Forecast, by Type 2019 & 2032
- Table 62: Global Non-Halogenated Flame Retardants Chemicals Industry Volume K Tons Forecast, by Type 2019 & 2032
- Table 63: Global Non-Halogenated Flame Retardants Chemicals Industry Revenue Million Forecast, by End-user Industry 2019 & 2032
- Table 64: Global Non-Halogenated Flame Retardants Chemicals Industry Volume K Tons Forecast, by End-user Industry 2019 & 2032
- Table 65: Global Non-Halogenated Flame Retardants Chemicals Industry Revenue Million Forecast, by Country 2019 & 2032
- Table 66: Global Non-Halogenated Flame Retardants Chemicals Industry Volume K Tons Forecast, by Country 2019 & 2032
- Table 67: China Non-Halogenated Flame Retardants Chemicals Industry Revenue (Million) Forecast, by Application 2019 & 2032
- Table 68: China Non-Halogenated Flame Retardants Chemicals Industry Volume (K Tons) Forecast, by Application 2019 & 2032
- Table 69: India Non-Halogenated Flame Retardants Chemicals Industry Revenue (Million) Forecast, by Application 2019 & 2032
- Table 70: India Non-Halogenated Flame Retardants Chemicals Industry Volume (K Tons) Forecast, by Application 2019 & 2032
- Table 71: Japan Non-Halogenated Flame Retardants Chemicals Industry Revenue (Million) Forecast, by Application 2019 & 2032
- Table 72: Japan Non-Halogenated Flame Retardants Chemicals Industry Volume (K Tons) Forecast, by Application 2019 & 2032
- Table 73: South Korea Non-Halogenated Flame Retardants Chemicals Industry Revenue (Million) Forecast, by Application 2019 & 2032
- Table 74: South Korea Non-Halogenated Flame Retardants Chemicals Industry Volume (K Tons) Forecast, by Application 2019 & 2032
- Table 75: Rest of Asia Pacific Non-Halogenated Flame Retardants Chemicals Industry Revenue (Million) Forecast, by Application 2019 & 2032
- Table 76: Rest of Asia Pacific Non-Halogenated Flame Retardants Chemicals Industry Volume (K Tons) Forecast, by Application 2019 & 2032
- Table 77: Global Non-Halogenated Flame Retardants Chemicals Industry Revenue Million Forecast, by Type 2019 & 2032
- Table 78: Global Non-Halogenated Flame Retardants Chemicals Industry Volume K Tons Forecast, by Type 2019 & 2032
- Table 79: Global Non-Halogenated Flame Retardants Chemicals Industry Revenue Million Forecast, by End-user Industry 2019 & 2032
- Table 80: Global Non-Halogenated Flame Retardants Chemicals Industry Volume K Tons Forecast, by End-user Industry 2019 & 2032
- Table 81: Global Non-Halogenated Flame Retardants Chemicals Industry Revenue Million Forecast, by Country 2019 & 2032
- Table 82: Global Non-Halogenated Flame Retardants Chemicals Industry Volume K Tons Forecast, by Country 2019 & 2032
- Table 83: United States Non-Halogenated Flame Retardants Chemicals Industry Revenue (Million) Forecast, by Application 2019 & 2032
- Table 84: United States Non-Halogenated Flame Retardants Chemicals Industry Volume (K Tons) Forecast, by Application 2019 & 2032
- Table 85: Canada Non-Halogenated Flame Retardants Chemicals Industry Revenue (Million) Forecast, by Application 2019 & 2032
- Table 86: Canada Non-Halogenated Flame Retardants Chemicals Industry Volume (K Tons) Forecast, by Application 2019 & 2032
- Table 87: Mexico Non-Halogenated Flame Retardants Chemicals Industry Revenue (Million) Forecast, by Application 2019 & 2032
- Table 88: Mexico Non-Halogenated Flame Retardants Chemicals Industry Volume (K Tons) Forecast, by Application 2019 & 2032
- Table 89: Global Non-Halogenated Flame Retardants Chemicals Industry Revenue Million Forecast, by Type 2019 & 2032
- Table 90: Global Non-Halogenated Flame Retardants Chemicals Industry Volume K Tons Forecast, by Type 2019 & 2032
- Table 91: Global Non-Halogenated Flame Retardants Chemicals Industry Revenue Million Forecast, by End-user Industry 2019 & 2032
- Table 92: Global Non-Halogenated Flame Retardants Chemicals Industry Volume K Tons Forecast, by End-user Industry 2019 & 2032
- Table 93: Global Non-Halogenated Flame Retardants Chemicals Industry Revenue Million Forecast, by Country 2019 & 2032
- Table 94: Global Non-Halogenated Flame Retardants Chemicals Industry Volume K Tons Forecast, by Country 2019 & 2032
- Table 95: Germany Non-Halogenated Flame Retardants Chemicals Industry Revenue (Million) Forecast, by Application 2019 & 2032
- Table 96: Germany Non-Halogenated Flame Retardants Chemicals Industry Volume (K Tons) Forecast, by Application 2019 & 2032
- Table 97: United Kingdom Non-Halogenated Flame Retardants Chemicals Industry Revenue (Million) Forecast, by Application 2019 & 2032
- Table 98: United Kingdom Non-Halogenated Flame Retardants Chemicals Industry Volume (K Tons) Forecast, by Application 2019 & 2032
- Table 99: Italy Non-Halogenated Flame Retardants Chemicals Industry Revenue (Million) Forecast, by Application 2019 & 2032
- Table 100: Italy Non-Halogenated Flame Retardants Chemicals Industry Volume (K Tons) Forecast, by Application 2019 & 2032
- Table 101: France Non-Halogenated Flame Retardants Chemicals Industry Revenue (Million) Forecast, by Application 2019 & 2032
- Table 102: France Non-Halogenated Flame Retardants Chemicals Industry Volume (K Tons) Forecast, by Application 2019 & 2032
- Table 103: Rest of Europe Non-Halogenated Flame Retardants Chemicals Industry Revenue (Million) Forecast, by Application 2019 & 2032
- Table 104: Rest of Europe Non-Halogenated Flame Retardants Chemicals Industry Volume (K Tons) Forecast, by Application 2019 & 2032
- Table 105: Global Non-Halogenated Flame Retardants Chemicals Industry Revenue Million Forecast, by Type 2019 & 2032
- Table 106: Global Non-Halogenated Flame Retardants Chemicals Industry Volume K Tons Forecast, by Type 2019 & 2032
- Table 107: Global Non-Halogenated Flame Retardants Chemicals Industry Revenue Million Forecast, by End-user Industry 2019 & 2032
- Table 108: Global Non-Halogenated Flame Retardants Chemicals Industry Volume K Tons Forecast, by End-user Industry 2019 & 2032
- Table 109: Global Non-Halogenated Flame Retardants Chemicals Industry Revenue Million Forecast, by Country 2019 & 2032
- Table 110: Global Non-Halogenated Flame Retardants Chemicals Industry Volume K Tons Forecast, by Country 2019 & 2032
- Table 111: Brazil Non-Halogenated Flame Retardants Chemicals Industry Revenue (Million) Forecast, by Application 2019 & 2032
- Table 112: Brazil Non-Halogenated Flame Retardants Chemicals Industry Volume (K Tons) Forecast, by Application 2019 & 2032
- Table 113: Argentina Non-Halogenated Flame Retardants Chemicals Industry Revenue (Million) Forecast, by Application 2019 & 2032
- Table 114: Argentina Non-Halogenated Flame Retardants Chemicals Industry Volume (K Tons) Forecast, by Application 2019 & 2032
- Table 115: Rest of South America Non-Halogenated Flame Retardants Chemicals Industry Revenue (Million) Forecast, by Application 2019 & 2032
- Table 116: Rest of South America Non-Halogenated Flame Retardants Chemicals Industry Volume (K Tons) Forecast, by Application 2019 & 2032
- Table 117: Global Non-Halogenated Flame Retardants Chemicals Industry Revenue Million Forecast, by Type 2019 & 2032
- Table 118: Global Non-Halogenated Flame Retardants Chemicals Industry Volume K Tons Forecast, by Type 2019 & 2032
- Table 119: Global Non-Halogenated Flame Retardants Chemicals Industry Revenue Million Forecast, by End-user Industry 2019 & 2032
- Table 120: Global Non-Halogenated Flame Retardants Chemicals Industry Volume K Tons Forecast, by End-user Industry 2019 & 2032
- Table 121: Global Non-Halogenated Flame Retardants Chemicals Industry Revenue Million Forecast, by Country 2019 & 2032
- Table 122: Global Non-Halogenated Flame Retardants Chemicals Industry Volume K Tons Forecast, by Country 2019 & 2032
- Table 123: Saudi Arabia Non-Halogenated Flame Retardants Chemicals Industry Revenue (Million) Forecast, by Application 2019 & 2032
- Table 124: Saudi Arabia Non-Halogenated Flame Retardants Chemicals Industry Volume (K Tons) Forecast, by Application 2019 & 2032
- Table 125: South Africa Non-Halogenated Flame Retardants Chemicals Industry Revenue (Million) Forecast, by Application 2019 & 2032
- Table 126: South Africa Non-Halogenated Flame Retardants Chemicals Industry Volume (K Tons) Forecast, by Application 2019 & 2032
- Table 127: Rest of Middle East and Africa Non-Halogenated Flame Retardants Chemicals Industry Revenue (Million) Forecast, by Application 2019 & 2032
- Table 128: Rest of Middle East and Africa Non-Halogenated Flame Retardants Chemicals Industry Volume (K Tons) Forecast, by Application 2019 & 2032
Frequently Asked Questions
1. What is the projected Compound Annual Growth Rate (CAGR) of the Non-Halogenated Flame Retardants Chemicals Industry?
The projected CAGR is approximately > 5.00%.
2. Which companies are prominent players in the Non-Halogenated Flame Retardants Chemicals Industry?
Key companies in the market include ICL, DIC Corporation, TOR Minerals, Clariant, Jiangsu Jacques Technology Co Ltd, MPI Chemie BV, Italmatch Chemicals SpA, LANXESS, Nippon Carbide Indestries Co Inc (Sanwa Chemical Industry Co Ltd), BASF SE, Rin Kagaku Kogyo Co Ltd, Shandong Brother Sci &Tech Co Ltd, Nabaltec AG, Thor, Eti Maden, Apexical Inc, NYACOL Nano Technologies Inc, Huber Engineered Materials, Daihachi Chemical Industry Co Ltd.
3. What are the main segments of the Non-Halogenated Flame Retardants Chemicals Industry?
The market segments include Type, End-user Industry.
4. Can you provide details about the market size?
The market size is estimated to be USD XX Million as of 2022.
5. What are some drivers contributing to market growth?
; Environmental and Health Concerns Regarding Brominated and Other Flame Retardants; Increasing Infrastructure Activities in Asia-Pacific; Rising Consumer Electrical and Electronic Goods Manufacturing.
6. What are the notable trends driving market growth?
Increasing Demand from the Buildings and Construction Industry.
7. Are there any restraints impacting market growth?
; Non-suitability of Hydroxides to High Temperature Applications.
8. Can you provide examples of recent developments in the market?
N/A
9. What pricing options are available for accessing the report?
Pricing options include single-user, multi-user, and enterprise licenses priced at USD 4750, USD 5250, and USD 8750 respectively.
10. Is the market size provided in terms of value or volume?
The market size is provided in terms of value, measured in Million and volume, measured in K Tons.
11. Are there any specific market keywords associated with the report?
Yes, the market keyword associated with the report is "Non-Halogenated Flame Retardants Chemicals Industry," which aids in identifying and referencing the specific market segment covered.
12. How do I determine which pricing option suits my needs best?
The pricing options vary based on user requirements and access needs. Individual users may opt for single-user licenses, while businesses requiring broader access may choose multi-user or enterprise licenses for cost-effective access to the report.
13. Are there any additional resources or data provided in the Non-Halogenated Flame Retardants Chemicals Industry report?
While the report offers comprehensive insights, it's advisable to review the specific contents or supplementary materials provided to ascertain if additional resources or data are available.
14. How can I stay updated on further developments or reports in the Non-Halogenated Flame Retardants Chemicals Industry?
To stay informed about further developments, trends, and reports in the Non-Halogenated Flame Retardants Chemicals Industry, consider subscribing to industry newsletters, following relevant companies and organizations, or regularly checking reputable industry news sources and publications.
Methodology
Step 1 - Identification of Relevant Samples Size from Population Database


Step 2 - Approaches for Defining Global Market Size (Value, Volume* & Price*)

Note*: In applicable scenarios
Step 3 - Data Sources
Primary Research
- Web Analytics
- Survey Reports
- Research Institute
- Latest Research Reports
- Opinion Leaders
Secondary Research
- Annual Reports
- White Paper
- Latest Press Release
- Industry Association
- Paid Database
- Investor Presentations

Step 4 - Data Triangulation
Involves using different sources of information in order to increase the validity of a study
These sources are likely to be stakeholders in a program - participants, other researchers, program staff, other community members, and so on.
Then we put all data in single framework & apply various statistical tools to find out the dynamic on the market.
During the analysis stage, feedback from the stakeholder groups would be compared to determine areas of agreement as well as areas of divergence
