

Key Insights
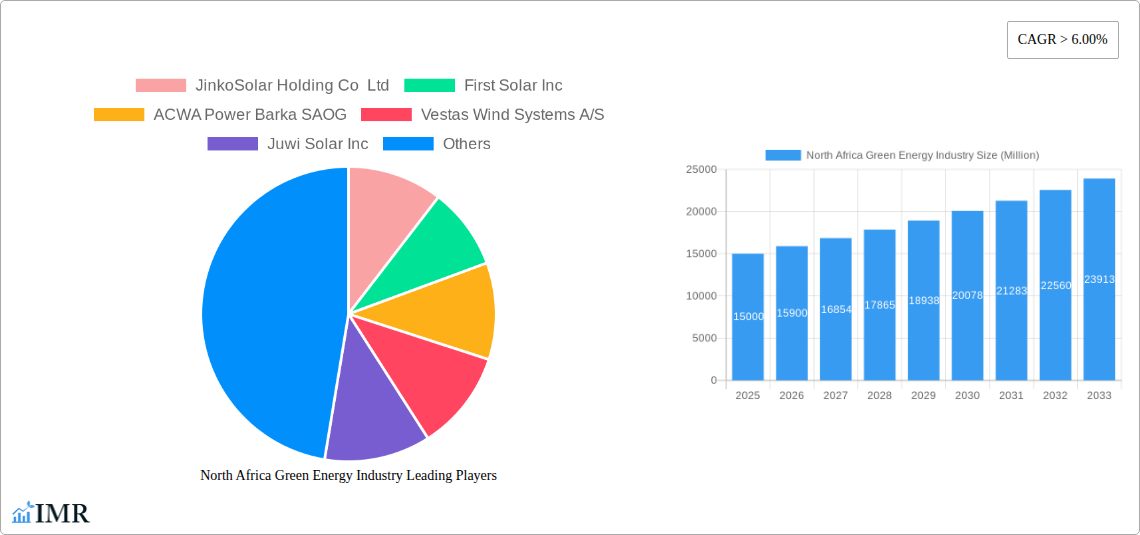
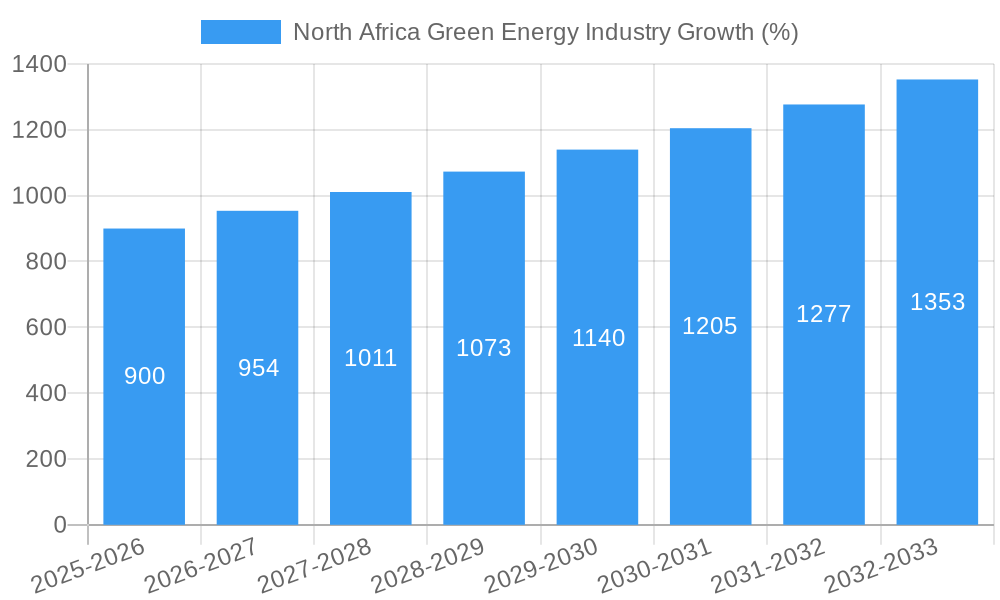
The North African green energy market, encompassing solar, wind, and other renewable sources, is experiencing robust growth, projected to maintain a Compound Annual Growth Rate (CAGR) exceeding 6% from 2025 to 2033. This expansion is driven by several factors. Firstly, the region's abundant solar irradiance and wind resources provide a strong foundation for renewable energy generation. Government initiatives promoting energy independence and diversification away from fossil fuels are significant catalysts, coupled with increasing investments in renewable energy infrastructure. Furthermore, the falling cost of solar and wind technologies makes these options increasingly competitive with traditional energy sources. Morocco, Egypt, and Algeria are leading the charge, benefiting from substantial government support and large-scale projects. However, challenges remain, including grid infrastructure limitations in some areas, requiring significant investment in upgrading transmission networks to efficiently integrate renewable energy sources into the power grid. Additionally, financing constraints and regulatory hurdles can sometimes hinder project development. Despite these obstacles, the long-term outlook remains positive, with a substantial growth trajectory projected throughout the forecast period, fueled by international collaborations and a growing awareness of the urgent need for sustainable energy solutions.
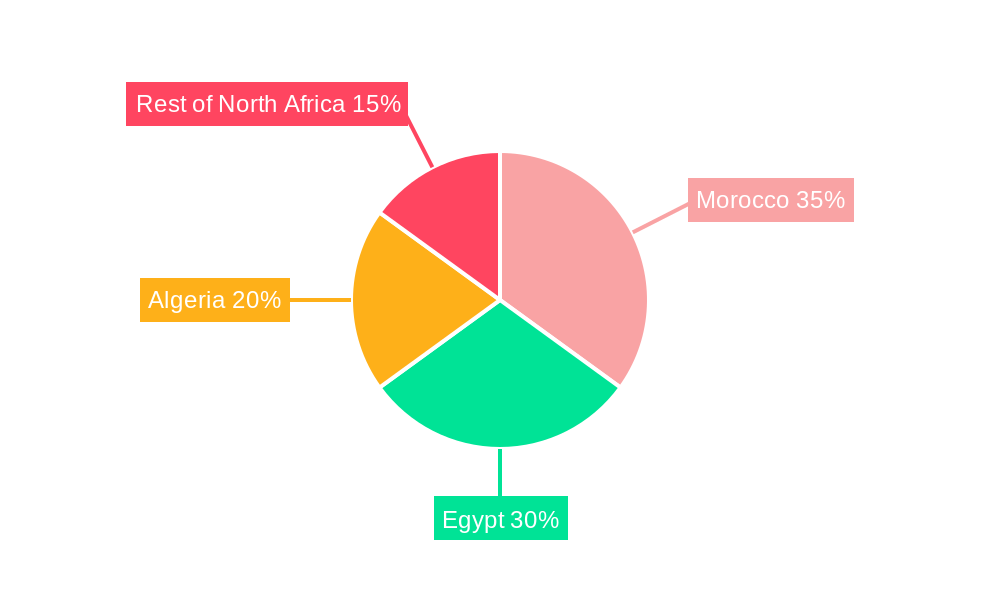
The market segmentation reveals solar and wind energy as the dominant forces, with 'others' (likely including hydropower and geothermal) comprising a smaller but still significant share. Within the geographical breakdown, Morocco, Egypt, and Algeria represent the largest markets due to their more developed infrastructure and supportive policy frameworks. Key players like JinkoSolar, First Solar, ACWA Power, Vestas, and Siemens Gamesa are actively shaping the market landscape, contributing to technological advancements and project development. While South Africa, among other sub-Saharan African nations, holds considerable renewable energy potential, the North African region currently leads in terms of market size and investment due to more favorable policy environments and stronger grid infrastructure. The growth will likely be fueled by a combination of large-scale utility projects and decentralized, distributed generation initiatives, driving the expansion of the green energy sector across North Africa in the coming years.
This comprehensive report provides a detailed analysis of the North Africa green energy market, encompassing market dynamics, growth trends, key players, and future outlook. With a focus on solar, wind, and other renewable energy sources across Morocco, Egypt, Algeria, and the rest of North Africa, this report is an invaluable resource for industry professionals, investors, and policymakers. The study period covers 2019-2033, with a base year of 2025 and a forecast period of 2025-2033.
North Africa Green Energy Industry Market Dynamics & Structure
This section analyzes the North African green energy market's structure, encompassing market concentration, technological innovation, regulatory frameworks, competitive dynamics, and M&A activity. The market is characterized by a mix of international players and local companies, leading to a moderately concentrated market structure. Technological innovation is driven by the need for cost reduction and efficiency improvements, while regulatory frameworks vary across countries, impacting market development. The substitution of fossil fuels with renewable energy sources is a key trend, shaped by end-user demands for clean and sustainable energy.
- Market Concentration: Moderately concentrated, with both international and local players holding significant shares (xx%).
- Technological Innovation: Focus on cost reduction, efficiency gains in solar PV and wind turbine technology, and grid integration solutions.
- Regulatory Frameworks: Varying policies across countries influence investment and project development, creating both opportunities and challenges.
- Competitive Substitutes: Primarily fossil fuels (natural gas, oil), facing increasing pressure due to environmental concerns and cost competitiveness of renewables.
- End-User Demographics: Growing energy demand in urban and industrial sectors drives renewable energy adoption.
- M&A Trends: Moderate M&A activity observed, primarily driven by strategic expansion and technology acquisition (xx deals in the historical period).
North Africa Green Energy Industry Growth Trends & Insights
The North African green energy market is experiencing robust growth, driven by supportive government policies, increasing energy demand, and falling renewable energy costs. The market size is projected to experience significant expansion, with a Compound Annual Growth Rate (CAGR) of xx% during the forecast period (2025-2033). This growth is fueled by rising investments in large-scale renewable energy projects and a shift towards sustainable energy solutions among consumers and businesses. Technological advancements in solar and wind energy technologies are also significantly contributing to market expansion, leading to increased adoption rates and improved efficiency. Consumer behavior is shifting towards environmentally conscious energy choices, further boosting market growth.
Dominant Regions, Countries, or Segments in North Africa Green Energy Industry
Morocco and Egypt currently dominate the North African green energy market, driven by ambitious renewable energy targets, supportive government policies, and significant investments in large-scale projects. The solar segment holds a leading position due to the region's abundant solar resources. However, wind energy is also experiencing substantial growth, particularly in areas with favorable wind conditions.
- Leading Region: Morocco and Egypt
- Leading Country: Morocco (Market share xx%, driven by significant solar investments) and Egypt (Market share xx%, boosted by large-scale wind and solar projects).
- Leading Segment: Solar (xx% market share), followed by Wind (xx%) and Others (xx%).
- Key Drivers: Government targets, investment incentives, favorable resource availability, decreasing technology costs.
North Africa Green Energy Industry Product Landscape
The North African green energy market showcases a diverse product landscape, featuring advanced solar photovoltaic (PV) panels with higher efficiency, larger-capacity wind turbines, and innovative energy storage solutions. These products are deployed across various applications, including utility-scale power plants, distributed generation systems, and off-grid solutions. Key performance indicators include energy yield, capacity factor, and levelized cost of energy (LCOE), constantly improving due to technological advancements and economies of scale. Unique selling propositions often focus on efficiency, reliability, and cost-effectiveness.
Key Drivers, Barriers & Challenges in North Africa Green Energy Industry
Key Drivers:
- Abundant solar and wind resources
- Supportive government policies and targets
- Decreasing renewable energy costs
- Increasing energy demand
- Growing environmental awareness
Key Challenges:
- Grid infrastructure limitations (xx Million USD needed for upgrading)
- Financing challenges for large-scale projects
- Regulatory uncertainty and permitting delays
- Water scarcity (impact on cooling systems)
- Dependence on imported technology and expertise
Emerging Opportunities in North Africa Green Energy Industry
Emerging opportunities lie in distributed generation, off-grid solutions for remote communities, and the integration of energy storage systems to enhance grid stability and reliability. Furthermore, the development of green hydrogen production using renewable energy sources presents significant potential. The increasing adoption of smart grids and digital technologies offers further opportunities for optimization and efficiency improvements.
Growth Accelerators in the North Africa Green Energy Industry Industry
Technological breakthroughs in solar PV and wind turbine technology, coupled with strategic partnerships between international and local companies, are accelerating market growth. The expansion of green energy initiatives across various sectors, including agriculture, transportation and industry, is further boosting market expansion. The emergence of innovative financing mechanisms is also creating a more favorable investment climate.
Key Players Shaping the North Africa Green Energy Industry Market
- JinkoSolar Holding Co Ltd
- First Solar Inc
- ACWA Power Barka SAOG
- Vestas Wind Systems A/S
- Juwi Solar Inc
- SkyPower Ltd
- Siemens Gamesa Renewable Energy SA
- Canadian Solar Inc
- Scatec Solar ASA
Notable Milestones in North Africa Green Energy Industry Sector
- December 2022: Xlinks announces plans for a 10.5 GWh solar power plant.
- December 2022: TuNur announces plans for a 4.5 GWh solar power plant in Tunisia, exporting electricity to Europe.
- November 2022: Egypt signs agreements for USD 1 Billion in wind and solar projects backed by IFC.
In-Depth North Africa Green Energy Industry Market Outlook
The North African green energy market presents substantial long-term growth potential, driven by strong policy support, abundant resources, and decreasing technology costs. Strategic opportunities exist for companies focusing on innovative technologies, efficient project development, and localized supply chains. The market's future success hinges on addressing key challenges related to grid infrastructure, financing, and regulatory frameworks. However, with continued investment and technological advancements, the region is poised for significant growth in renewable energy capacity and market value over the forecast period.
North Africa Green Energy Industry Segmentation
-
1. Source
- 1.1. Solar
- 1.2. Wind
- 1.3. Others
-
2. Geogrpahy
- 2.1. Morocco
- 2.2. Egypt
- 2.3. Algeria
- 2.4. Rest of North Africa
North Africa Green Energy Industry Segmentation By Geography
-
1. North America
- 1.1. United States
- 1.2. Canada
- 1.3. Mexico
-
2. South America
- 2.1. Brazil
- 2.2. Argentina
- 2.3. Rest of South America
-
3. Europe
- 3.1. United Kingdom
- 3.2. Germany
- 3.3. France
- 3.4. Italy
- 3.5. Spain
- 3.6. Russia
- 3.7. Benelux
- 3.8. Nordics
- 3.9. Rest of Europe
-
4. Middle East & Africa
- 4.1. Turkey
- 4.2. Israel
- 4.3. GCC
- 4.4. North Africa
- 4.5. South Africa
- 4.6. Rest of Middle East & Africa
-
5. Asia Pacific
- 5.1. China
- 5.2. India
- 5.3. Japan
- 5.4. South Korea
- 5.5. ASEAN
- 5.6. Oceania
- 5.7. Rest of Asia Pacific
North Africa Green Energy Industry REPORT HIGHLIGHTS
| Aspects | Details |
|---|---|
| Study Period | 2019-2033 |
| Base Year | 2024 |
| Estimated Year | 2025 |
| Forecast Period | 2025-2033 |
| Historical Period | 2019-2024 |
| Growth Rate | CAGR of > 6.00% from 2019-2033 |
| Segmentation |
|
Table of Contents
- 1. Introduction
- 1.1. Research Scope
- 1.2. Market Segmentation
- 1.3. Research Methodology
- 1.4. Definitions and Assumptions
- 2. Executive Summary
- 2.1. Introduction
- 3. Market Dynamics
- 3.1. Introduction
- 3.2. Market Drivers
- 3.2.1. 4.; Demand for Solar Photovoltaic Installations4.; Growing Investments
- 3.3. Market Restrains
- 3.3.1. 4.; Increasing Wind Energy Installations
- 3.4. Market Trends
- 3.4.1. Solar Energy is Expected to Dominate the Market
- 4. Market Factor Analysis
- 4.1. Porters Five Forces
- 4.2. Supply/Value Chain
- 4.3. PESTEL analysis
- 4.4. Market Entropy
- 4.5. Patent/Trademark Analysis
- 5. Global North Africa Green Energy Industry Analysis, Insights and Forecast, 2019-2031
- 5.1. Market Analysis, Insights and Forecast - by Source
- 5.1.1. Solar
- 5.1.2. Wind
- 5.1.3. Others
- 5.2. Market Analysis, Insights and Forecast - by Geogrpahy
- 5.2.1. Morocco
- 5.2.2. Egypt
- 5.2.3. Algeria
- 5.2.4. Rest of North Africa
- 5.3. Market Analysis, Insights and Forecast - by Region
- 5.3.1. North America
- 5.3.2. South America
- 5.3.3. Europe
- 5.3.4. Middle East & Africa
- 5.3.5. Asia Pacific
- 5.1. Market Analysis, Insights and Forecast - by Source
- 6. North America North Africa Green Energy Industry Analysis, Insights and Forecast, 2019-2031
- 6.1. Market Analysis, Insights and Forecast - by Source
- 6.1.1. Solar
- 6.1.2. Wind
- 6.1.3. Others
- 6.2. Market Analysis, Insights and Forecast - by Geogrpahy
- 6.2.1. Morocco
- 6.2.2. Egypt
- 6.2.3. Algeria
- 6.2.4. Rest of North Africa
- 6.1. Market Analysis, Insights and Forecast - by Source
- 7. South America North Africa Green Energy Industry Analysis, Insights and Forecast, 2019-2031
- 7.1. Market Analysis, Insights and Forecast - by Source
- 7.1.1. Solar
- 7.1.2. Wind
- 7.1.3. Others
- 7.2. Market Analysis, Insights and Forecast - by Geogrpahy
- 7.2.1. Morocco
- 7.2.2. Egypt
- 7.2.3. Algeria
- 7.2.4. Rest of North Africa
- 7.1. Market Analysis, Insights and Forecast - by Source
- 8. Europe North Africa Green Energy Industry Analysis, Insights and Forecast, 2019-2031
- 8.1. Market Analysis, Insights and Forecast - by Source
- 8.1.1. Solar
- 8.1.2. Wind
- 8.1.3. Others
- 8.2. Market Analysis, Insights and Forecast - by Geogrpahy
- 8.2.1. Morocco
- 8.2.2. Egypt
- 8.2.3. Algeria
- 8.2.4. Rest of North Africa
- 8.1. Market Analysis, Insights and Forecast - by Source
- 9. Middle East & Africa North Africa Green Energy Industry Analysis, Insights and Forecast, 2019-2031
- 9.1. Market Analysis, Insights and Forecast - by Source
- 9.1.1. Solar
- 9.1.2. Wind
- 9.1.3. Others
- 9.2. Market Analysis, Insights and Forecast - by Geogrpahy
- 9.2.1. Morocco
- 9.2.2. Egypt
- 9.2.3. Algeria
- 9.2.4. Rest of North Africa
- 9.1. Market Analysis, Insights and Forecast - by Source
- 10. Asia Pacific North Africa Green Energy Industry Analysis, Insights and Forecast, 2019-2031
- 10.1. Market Analysis, Insights and Forecast - by Source
- 10.1.1. Solar
- 10.1.2. Wind
- 10.1.3. Others
- 10.2. Market Analysis, Insights and Forecast - by Geogrpahy
- 10.2.1. Morocco
- 10.2.2. Egypt
- 10.2.3. Algeria
- 10.2.4. Rest of North Africa
- 10.1. Market Analysis, Insights and Forecast - by Source
- 11. South Africa North Africa Green Energy Industry Analysis, Insights and Forecast, 2019-2031
- 12. Sudan North Africa Green Energy Industry Analysis, Insights and Forecast, 2019-2031
- 13. Uganda North Africa Green Energy Industry Analysis, Insights and Forecast, 2019-2031
- 14. Tanzania North Africa Green Energy Industry Analysis, Insights and Forecast, 2019-2031
- 15. Kenya North Africa Green Energy Industry Analysis, Insights and Forecast, 2019-2031
- 16. Rest of Africa North Africa Green Energy Industry Analysis, Insights and Forecast, 2019-2031
- 17. Competitive Analysis
- 17.1. Global Market Share Analysis 2024
- 17.2. Company Profiles
- 17.2.1 JinkoSolar Holding Co Ltd
- 17.2.1.1. Overview
- 17.2.1.2. Products
- 17.2.1.3. SWOT Analysis
- 17.2.1.4. Recent Developments
- 17.2.1.5. Financials (Based on Availability)
- 17.2.2 First Solar Inc
- 17.2.2.1. Overview
- 17.2.2.2. Products
- 17.2.2.3. SWOT Analysis
- 17.2.2.4. Recent Developments
- 17.2.2.5. Financials (Based on Availability)
- 17.2.3 ACWA Power Barka SAOG
- 17.2.3.1. Overview
- 17.2.3.2. Products
- 17.2.3.3. SWOT Analysis
- 17.2.3.4. Recent Developments
- 17.2.3.5. Financials (Based on Availability)
- 17.2.4 Vestas Wind Systems A/S
- 17.2.4.1. Overview
- 17.2.4.2. Products
- 17.2.4.3. SWOT Analysis
- 17.2.4.4. Recent Developments
- 17.2.4.5. Financials (Based on Availability)
- 17.2.5 Juwi Solar Inc
- 17.2.5.1. Overview
- 17.2.5.2. Products
- 17.2.5.3. SWOT Analysis
- 17.2.5.4. Recent Developments
- 17.2.5.5. Financials (Based on Availability)
- 17.2.6 SkyPower Ltd
- 17.2.6.1. Overview
- 17.2.6.2. Products
- 17.2.6.3. SWOT Analysis
- 17.2.6.4. Recent Developments
- 17.2.6.5. Financials (Based on Availability)
- 17.2.7 Siemens Gamesa Renewable Energy SA
- 17.2.7.1. Overview
- 17.2.7.2. Products
- 17.2.7.3. SWOT Analysis
- 17.2.7.4. Recent Developments
- 17.2.7.5. Financials (Based on Availability)
- 17.2.8 Canadian Solar Inc
- 17.2.8.1. Overview
- 17.2.8.2. Products
- 17.2.8.3. SWOT Analysis
- 17.2.8.4. Recent Developments
- 17.2.8.5. Financials (Based on Availability)
- 17.2.9 Scatec Solar ASA
- 17.2.9.1. Overview
- 17.2.9.2. Products
- 17.2.9.3. SWOT Analysis
- 17.2.9.4. Recent Developments
- 17.2.9.5. Financials (Based on Availability)
- 17.2.1 JinkoSolar Holding Co Ltd
List of Figures
- Figure 1: Global North Africa Green Energy Industry Revenue Breakdown (Million, %) by Region 2024 & 2032
- Figure 2: Global North Africa Green Energy Industry Volume Breakdown (Gigawatte, %) by Region 2024 & 2032
- Figure 3: Africa North Africa Green Energy Industry Revenue (Million), by Country 2024 & 2032
- Figure 4: Africa North Africa Green Energy Industry Volume (Gigawatte), by Country 2024 & 2032
- Figure 5: Africa North Africa Green Energy Industry Revenue Share (%), by Country 2024 & 2032
- Figure 6: Africa North Africa Green Energy Industry Volume Share (%), by Country 2024 & 2032
- Figure 7: North America North Africa Green Energy Industry Revenue (Million), by Source 2024 & 2032
- Figure 8: North America North Africa Green Energy Industry Volume (Gigawatte), by Source 2024 & 2032
- Figure 9: North America North Africa Green Energy Industry Revenue Share (%), by Source 2024 & 2032
- Figure 10: North America North Africa Green Energy Industry Volume Share (%), by Source 2024 & 2032
- Figure 11: North America North Africa Green Energy Industry Revenue (Million), by Geogrpahy 2024 & 2032
- Figure 12: North America North Africa Green Energy Industry Volume (Gigawatte), by Geogrpahy 2024 & 2032
- Figure 13: North America North Africa Green Energy Industry Revenue Share (%), by Geogrpahy 2024 & 2032
- Figure 14: North America North Africa Green Energy Industry Volume Share (%), by Geogrpahy 2024 & 2032
- Figure 15: North America North Africa Green Energy Industry Revenue (Million), by Country 2024 & 2032
- Figure 16: North America North Africa Green Energy Industry Volume (Gigawatte), by Country 2024 & 2032
- Figure 17: North America North Africa Green Energy Industry Revenue Share (%), by Country 2024 & 2032
- Figure 18: North America North Africa Green Energy Industry Volume Share (%), by Country 2024 & 2032
- Figure 19: South America North Africa Green Energy Industry Revenue (Million), by Source 2024 & 2032
- Figure 20: South America North Africa Green Energy Industry Volume (Gigawatte), by Source 2024 & 2032
- Figure 21: South America North Africa Green Energy Industry Revenue Share (%), by Source 2024 & 2032
- Figure 22: South America North Africa Green Energy Industry Volume Share (%), by Source 2024 & 2032
- Figure 23: South America North Africa Green Energy Industry Revenue (Million), by Geogrpahy 2024 & 2032
- Figure 24: South America North Africa Green Energy Industry Volume (Gigawatte), by Geogrpahy 2024 & 2032
- Figure 25: South America North Africa Green Energy Industry Revenue Share (%), by Geogrpahy 2024 & 2032
- Figure 26: South America North Africa Green Energy Industry Volume Share (%), by Geogrpahy 2024 & 2032
- Figure 27: South America North Africa Green Energy Industry Revenue (Million), by Country 2024 & 2032
- Figure 28: South America North Africa Green Energy Industry Volume (Gigawatte), by Country 2024 & 2032
- Figure 29: South America North Africa Green Energy Industry Revenue Share (%), by Country 2024 & 2032
- Figure 30: South America North Africa Green Energy Industry Volume Share (%), by Country 2024 & 2032
- Figure 31: Europe North Africa Green Energy Industry Revenue (Million), by Source 2024 & 2032
- Figure 32: Europe North Africa Green Energy Industry Volume (Gigawatte), by Source 2024 & 2032
- Figure 33: Europe North Africa Green Energy Industry Revenue Share (%), by Source 2024 & 2032
- Figure 34: Europe North Africa Green Energy Industry Volume Share (%), by Source 2024 & 2032
- Figure 35: Europe North Africa Green Energy Industry Revenue (Million), by Geogrpahy 2024 & 2032
- Figure 36: Europe North Africa Green Energy Industry Volume (Gigawatte), by Geogrpahy 2024 & 2032
- Figure 37: Europe North Africa Green Energy Industry Revenue Share (%), by Geogrpahy 2024 & 2032
- Figure 38: Europe North Africa Green Energy Industry Volume Share (%), by Geogrpahy 2024 & 2032
- Figure 39: Europe North Africa Green Energy Industry Revenue (Million), by Country 2024 & 2032
- Figure 40: Europe North Africa Green Energy Industry Volume (Gigawatte), by Country 2024 & 2032
- Figure 41: Europe North Africa Green Energy Industry Revenue Share (%), by Country 2024 & 2032
- Figure 42: Europe North Africa Green Energy Industry Volume Share (%), by Country 2024 & 2032
- Figure 43: Middle East & Africa North Africa Green Energy Industry Revenue (Million), by Source 2024 & 2032
- Figure 44: Middle East & Africa North Africa Green Energy Industry Volume (Gigawatte), by Source 2024 & 2032
- Figure 45: Middle East & Africa North Africa Green Energy Industry Revenue Share (%), by Source 2024 & 2032
- Figure 46: Middle East & Africa North Africa Green Energy Industry Volume Share (%), by Source 2024 & 2032
- Figure 47: Middle East & Africa North Africa Green Energy Industry Revenue (Million), by Geogrpahy 2024 & 2032
- Figure 48: Middle East & Africa North Africa Green Energy Industry Volume (Gigawatte), by Geogrpahy 2024 & 2032
- Figure 49: Middle East & Africa North Africa Green Energy Industry Revenue Share (%), by Geogrpahy 2024 & 2032
- Figure 50: Middle East & Africa North Africa Green Energy Industry Volume Share (%), by Geogrpahy 2024 & 2032
- Figure 51: Middle East & Africa North Africa Green Energy Industry Revenue (Million), by Country 2024 & 2032
- Figure 52: Middle East & Africa North Africa Green Energy Industry Volume (Gigawatte), by Country 2024 & 2032
- Figure 53: Middle East & Africa North Africa Green Energy Industry Revenue Share (%), by Country 2024 & 2032
- Figure 54: Middle East & Africa North Africa Green Energy Industry Volume Share (%), by Country 2024 & 2032
- Figure 55: Asia Pacific North Africa Green Energy Industry Revenue (Million), by Source 2024 & 2032
- Figure 56: Asia Pacific North Africa Green Energy Industry Volume (Gigawatte), by Source 2024 & 2032
- Figure 57: Asia Pacific North Africa Green Energy Industry Revenue Share (%), by Source 2024 & 2032
- Figure 58: Asia Pacific North Africa Green Energy Industry Volume Share (%), by Source 2024 & 2032
- Figure 59: Asia Pacific North Africa Green Energy Industry Revenue (Million), by Geogrpahy 2024 & 2032
- Figure 60: Asia Pacific North Africa Green Energy Industry Volume (Gigawatte), by Geogrpahy 2024 & 2032
- Figure 61: Asia Pacific North Africa Green Energy Industry Revenue Share (%), by Geogrpahy 2024 & 2032
- Figure 62: Asia Pacific North Africa Green Energy Industry Volume Share (%), by Geogrpahy 2024 & 2032
- Figure 63: Asia Pacific North Africa Green Energy Industry Revenue (Million), by Country 2024 & 2032
- Figure 64: Asia Pacific North Africa Green Energy Industry Volume (Gigawatte), by Country 2024 & 2032
- Figure 65: Asia Pacific North Africa Green Energy Industry Revenue Share (%), by Country 2024 & 2032
- Figure 66: Asia Pacific North Africa Green Energy Industry Volume Share (%), by Country 2024 & 2032
List of Tables
- Table 1: Global North Africa Green Energy Industry Revenue Million Forecast, by Region 2019 & 2032
- Table 2: Global North Africa Green Energy Industry Volume Gigawatte Forecast, by Region 2019 & 2032
- Table 3: Global North Africa Green Energy Industry Revenue Million Forecast, by Source 2019 & 2032
- Table 4: Global North Africa Green Energy Industry Volume Gigawatte Forecast, by Source 2019 & 2032
- Table 5: Global North Africa Green Energy Industry Revenue Million Forecast, by Geogrpahy 2019 & 2032
- Table 6: Global North Africa Green Energy Industry Volume Gigawatte Forecast, by Geogrpahy 2019 & 2032
- Table 7: Global North Africa Green Energy Industry Revenue Million Forecast, by Region 2019 & 2032
- Table 8: Global North Africa Green Energy Industry Volume Gigawatte Forecast, by Region 2019 & 2032
- Table 9: Global North Africa Green Energy Industry Revenue Million Forecast, by Country 2019 & 2032
- Table 10: Global North Africa Green Energy Industry Volume Gigawatte Forecast, by Country 2019 & 2032
- Table 11: South Africa North Africa Green Energy Industry Revenue (Million) Forecast, by Application 2019 & 2032
- Table 12: South Africa North Africa Green Energy Industry Volume (Gigawatte) Forecast, by Application 2019 & 2032
- Table 13: Sudan North Africa Green Energy Industry Revenue (Million) Forecast, by Application 2019 & 2032
- Table 14: Sudan North Africa Green Energy Industry Volume (Gigawatte) Forecast, by Application 2019 & 2032
- Table 15: Uganda North Africa Green Energy Industry Revenue (Million) Forecast, by Application 2019 & 2032
- Table 16: Uganda North Africa Green Energy Industry Volume (Gigawatte) Forecast, by Application 2019 & 2032
- Table 17: Tanzania North Africa Green Energy Industry Revenue (Million) Forecast, by Application 2019 & 2032
- Table 18: Tanzania North Africa Green Energy Industry Volume (Gigawatte) Forecast, by Application 2019 & 2032
- Table 19: Kenya North Africa Green Energy Industry Revenue (Million) Forecast, by Application 2019 & 2032
- Table 20: Kenya North Africa Green Energy Industry Volume (Gigawatte) Forecast, by Application 2019 & 2032
- Table 21: Rest of Africa North Africa Green Energy Industry Revenue (Million) Forecast, by Application 2019 & 2032
- Table 22: Rest of Africa North Africa Green Energy Industry Volume (Gigawatte) Forecast, by Application 2019 & 2032
- Table 23: Global North Africa Green Energy Industry Revenue Million Forecast, by Source 2019 & 2032
- Table 24: Global North Africa Green Energy Industry Volume Gigawatte Forecast, by Source 2019 & 2032
- Table 25: Global North Africa Green Energy Industry Revenue Million Forecast, by Geogrpahy 2019 & 2032
- Table 26: Global North Africa Green Energy Industry Volume Gigawatte Forecast, by Geogrpahy 2019 & 2032
- Table 27: Global North Africa Green Energy Industry Revenue Million Forecast, by Country 2019 & 2032
- Table 28: Global North Africa Green Energy Industry Volume Gigawatte Forecast, by Country 2019 & 2032
- Table 29: United States North Africa Green Energy Industry Revenue (Million) Forecast, by Application 2019 & 2032
- Table 30: United States North Africa Green Energy Industry Volume (Gigawatte) Forecast, by Application 2019 & 2032
- Table 31: Canada North Africa Green Energy Industry Revenue (Million) Forecast, by Application 2019 & 2032
- Table 32: Canada North Africa Green Energy Industry Volume (Gigawatte) Forecast, by Application 2019 & 2032
- Table 33: Mexico North Africa Green Energy Industry Revenue (Million) Forecast, by Application 2019 & 2032
- Table 34: Mexico North Africa Green Energy Industry Volume (Gigawatte) Forecast, by Application 2019 & 2032
- Table 35: Global North Africa Green Energy Industry Revenue Million Forecast, by Source 2019 & 2032
- Table 36: Global North Africa Green Energy Industry Volume Gigawatte Forecast, by Source 2019 & 2032
- Table 37: Global North Africa Green Energy Industry Revenue Million Forecast, by Geogrpahy 2019 & 2032
- Table 38: Global North Africa Green Energy Industry Volume Gigawatte Forecast, by Geogrpahy 2019 & 2032
- Table 39: Global North Africa Green Energy Industry Revenue Million Forecast, by Country 2019 & 2032
- Table 40: Global North Africa Green Energy Industry Volume Gigawatte Forecast, by Country 2019 & 2032
- Table 41: Brazil North Africa Green Energy Industry Revenue (Million) Forecast, by Application 2019 & 2032
- Table 42: Brazil North Africa Green Energy Industry Volume (Gigawatte) Forecast, by Application 2019 & 2032
- Table 43: Argentina North Africa Green Energy Industry Revenue (Million) Forecast, by Application 2019 & 2032
- Table 44: Argentina North Africa Green Energy Industry Volume (Gigawatte) Forecast, by Application 2019 & 2032
- Table 45: Rest of South America North Africa Green Energy Industry Revenue (Million) Forecast, by Application 2019 & 2032
- Table 46: Rest of South America North Africa Green Energy Industry Volume (Gigawatte) Forecast, by Application 2019 & 2032
- Table 47: Global North Africa Green Energy Industry Revenue Million Forecast, by Source 2019 & 2032
- Table 48: Global North Africa Green Energy Industry Volume Gigawatte Forecast, by Source 2019 & 2032
- Table 49: Global North Africa Green Energy Industry Revenue Million Forecast, by Geogrpahy 2019 & 2032
- Table 50: Global North Africa Green Energy Industry Volume Gigawatte Forecast, by Geogrpahy 2019 & 2032
- Table 51: Global North Africa Green Energy Industry Revenue Million Forecast, by Country 2019 & 2032
- Table 52: Global North Africa Green Energy Industry Volume Gigawatte Forecast, by Country 2019 & 2032
- Table 53: United Kingdom North Africa Green Energy Industry Revenue (Million) Forecast, by Application 2019 & 2032
- Table 54: United Kingdom North Africa Green Energy Industry Volume (Gigawatte) Forecast, by Application 2019 & 2032
- Table 55: Germany North Africa Green Energy Industry Revenue (Million) Forecast, by Application 2019 & 2032
- Table 56: Germany North Africa Green Energy Industry Volume (Gigawatte) Forecast, by Application 2019 & 2032
- Table 57: France North Africa Green Energy Industry Revenue (Million) Forecast, by Application 2019 & 2032
- Table 58: France North Africa Green Energy Industry Volume (Gigawatte) Forecast, by Application 2019 & 2032
- Table 59: Italy North Africa Green Energy Industry Revenue (Million) Forecast, by Application 2019 & 2032
- Table 60: Italy North Africa Green Energy Industry Volume (Gigawatte) Forecast, by Application 2019 & 2032
- Table 61: Spain North Africa Green Energy Industry Revenue (Million) Forecast, by Application 2019 & 2032
- Table 62: Spain North Africa Green Energy Industry Volume (Gigawatte) Forecast, by Application 2019 & 2032
- Table 63: Russia North Africa Green Energy Industry Revenue (Million) Forecast, by Application 2019 & 2032
- Table 64: Russia North Africa Green Energy Industry Volume (Gigawatte) Forecast, by Application 2019 & 2032
- Table 65: Benelux North Africa Green Energy Industry Revenue (Million) Forecast, by Application 2019 & 2032
- Table 66: Benelux North Africa Green Energy Industry Volume (Gigawatte) Forecast, by Application 2019 & 2032
- Table 67: Nordics North Africa Green Energy Industry Revenue (Million) Forecast, by Application 2019 & 2032
- Table 68: Nordics North Africa Green Energy Industry Volume (Gigawatte) Forecast, by Application 2019 & 2032
- Table 69: Rest of Europe North Africa Green Energy Industry Revenue (Million) Forecast, by Application 2019 & 2032
- Table 70: Rest of Europe North Africa Green Energy Industry Volume (Gigawatte) Forecast, by Application 2019 & 2032
- Table 71: Global North Africa Green Energy Industry Revenue Million Forecast, by Source 2019 & 2032
- Table 72: Global North Africa Green Energy Industry Volume Gigawatte Forecast, by Source 2019 & 2032
- Table 73: Global North Africa Green Energy Industry Revenue Million Forecast, by Geogrpahy 2019 & 2032
- Table 74: Global North Africa Green Energy Industry Volume Gigawatte Forecast, by Geogrpahy 2019 & 2032
- Table 75: Global North Africa Green Energy Industry Revenue Million Forecast, by Country 2019 & 2032
- Table 76: Global North Africa Green Energy Industry Volume Gigawatte Forecast, by Country 2019 & 2032
- Table 77: Turkey North Africa Green Energy Industry Revenue (Million) Forecast, by Application 2019 & 2032
- Table 78: Turkey North Africa Green Energy Industry Volume (Gigawatte) Forecast, by Application 2019 & 2032
- Table 79: Israel North Africa Green Energy Industry Revenue (Million) Forecast, by Application 2019 & 2032
- Table 80: Israel North Africa Green Energy Industry Volume (Gigawatte) Forecast, by Application 2019 & 2032
- Table 81: GCC North Africa Green Energy Industry Revenue (Million) Forecast, by Application 2019 & 2032
- Table 82: GCC North Africa Green Energy Industry Volume (Gigawatte) Forecast, by Application 2019 & 2032
- Table 83: North Africa North Africa Green Energy Industry Revenue (Million) Forecast, by Application 2019 & 2032
- Table 84: North Africa North Africa Green Energy Industry Volume (Gigawatte) Forecast, by Application 2019 & 2032
- Table 85: South Africa North Africa Green Energy Industry Revenue (Million) Forecast, by Application 2019 & 2032
- Table 86: South Africa North Africa Green Energy Industry Volume (Gigawatte) Forecast, by Application 2019 & 2032
- Table 87: Rest of Middle East & Africa North Africa Green Energy Industry Revenue (Million) Forecast, by Application 2019 & 2032
- Table 88: Rest of Middle East & Africa North Africa Green Energy Industry Volume (Gigawatte) Forecast, by Application 2019 & 2032
- Table 89: Global North Africa Green Energy Industry Revenue Million Forecast, by Source 2019 & 2032
- Table 90: Global North Africa Green Energy Industry Volume Gigawatte Forecast, by Source 2019 & 2032
- Table 91: Global North Africa Green Energy Industry Revenue Million Forecast, by Geogrpahy 2019 & 2032
- Table 92: Global North Africa Green Energy Industry Volume Gigawatte Forecast, by Geogrpahy 2019 & 2032
- Table 93: Global North Africa Green Energy Industry Revenue Million Forecast, by Country 2019 & 2032
- Table 94: Global North Africa Green Energy Industry Volume Gigawatte Forecast, by Country 2019 & 2032
- Table 95: China North Africa Green Energy Industry Revenue (Million) Forecast, by Application 2019 & 2032
- Table 96: China North Africa Green Energy Industry Volume (Gigawatte) Forecast, by Application 2019 & 2032
- Table 97: India North Africa Green Energy Industry Revenue (Million) Forecast, by Application 2019 & 2032
- Table 98: India North Africa Green Energy Industry Volume (Gigawatte) Forecast, by Application 2019 & 2032
- Table 99: Japan North Africa Green Energy Industry Revenue (Million) Forecast, by Application 2019 & 2032
- Table 100: Japan North Africa Green Energy Industry Volume (Gigawatte) Forecast, by Application 2019 & 2032
- Table 101: South Korea North Africa Green Energy Industry Revenue (Million) Forecast, by Application 2019 & 2032
- Table 102: South Korea North Africa Green Energy Industry Volume (Gigawatte) Forecast, by Application 2019 & 2032
- Table 103: ASEAN North Africa Green Energy Industry Revenue (Million) Forecast, by Application 2019 & 2032
- Table 104: ASEAN North Africa Green Energy Industry Volume (Gigawatte) Forecast, by Application 2019 & 2032
- Table 105: Oceania North Africa Green Energy Industry Revenue (Million) Forecast, by Application 2019 & 2032
- Table 106: Oceania North Africa Green Energy Industry Volume (Gigawatte) Forecast, by Application 2019 & 2032
- Table 107: Rest of Asia Pacific North Africa Green Energy Industry Revenue (Million) Forecast, by Application 2019 & 2032
- Table 108: Rest of Asia Pacific North Africa Green Energy Industry Volume (Gigawatte) Forecast, by Application 2019 & 2032
Frequently Asked Questions
1. What is the projected Compound Annual Growth Rate (CAGR) of the North Africa Green Energy Industry?
The projected CAGR is approximately > 6.00%.
2. Which companies are prominent players in the North Africa Green Energy Industry?
Key companies in the market include JinkoSolar Holding Co Ltd, First Solar Inc, ACWA Power Barka SAOG, Vestas Wind Systems A/S, Juwi Solar Inc, SkyPower Ltd, Siemens Gamesa Renewable Energy SA, Canadian Solar Inc, Scatec Solar ASA.
3. What are the main segments of the North Africa Green Energy Industry?
The market segments include Source, Geogrpahy.
4. Can you provide details about the market size?
The market size is estimated to be USD XX Million as of 2022.
5. What are some drivers contributing to market growth?
4.; Demand for Solar Photovoltaic Installations4.; Growing Investments.
6. What are the notable trends driving market growth?
Solar Energy is Expected to Dominate the Market.
7. Are there any restraints impacting market growth?
4.; Increasing Wind Energy Installations.
8. Can you provide examples of recent developments in the market?
December 2022: a British company, Xlinks, has announced the installation of a 10.5 GWh solar power plant. Similarly, TuNur, a renewable energy developer, announced its plans to generate 4.5 GWh of electricity from a solar power plant in Tunisia and export it to export to Italy, France, and Malta with an aim to reduce European CO emissions.
9. What pricing options are available for accessing the report?
Pricing options include single-user, multi-user, and enterprise licenses priced at USD 4750, USD 5250, and USD 8750 respectively.
10. Is the market size provided in terms of value or volume?
The market size is provided in terms of value, measured in Million and volume, measured in Gigawatte.
11. Are there any specific market keywords associated with the report?
Yes, the market keyword associated with the report is "North Africa Green Energy Industry," which aids in identifying and referencing the specific market segment covered.
12. How do I determine which pricing option suits my needs best?
The pricing options vary based on user requirements and access needs. Individual users may opt for single-user licenses, while businesses requiring broader access may choose multi-user or enterprise licenses for cost-effective access to the report.
13. Are there any additional resources or data provided in the North Africa Green Energy Industry report?
While the report offers comprehensive insights, it's advisable to review the specific contents or supplementary materials provided to ascertain if additional resources or data are available.
14. How can I stay updated on further developments or reports in the North Africa Green Energy Industry?
To stay informed about further developments, trends, and reports in the North Africa Green Energy Industry, consider subscribing to industry newsletters, following relevant companies and organizations, or regularly checking reputable industry news sources and publications.
Methodology
Step 1 - Identification of Relevant Samples Size from Population Database


Step 2 - Approaches for Defining Global Market Size (Value, Volume* & Price*)

Note*: In applicable scenarios
Step 3 - Data Sources
Primary Research
- Web Analytics
- Survey Reports
- Research Institute
- Latest Research Reports
- Opinion Leaders
Secondary Research
- Annual Reports
- White Paper
- Latest Press Release
- Industry Association
- Paid Database
- Investor Presentations

Step 4 - Data Triangulation
Involves using different sources of information in order to increase the validity of a study
These sources are likely to be stakeholders in a program - participants, other researchers, program staff, other community members, and so on.
Then we put all data in single framework & apply various statistical tools to find out the dynamic on the market.
During the analysis stage, feedback from the stakeholder groups would be compared to determine areas of agreement as well as areas of divergence
