

Key Insights
The West European renewable energy market, including solar, wind, and bioenergy, is poised for substantial expansion. This growth is propelled by stringent environmental regulations, ambitious climate objectives like the European Green Deal, and declining technology costs. The market is projected to grow from its base year size to reach $384.3 billion by 2024, exhibiting a Compound Annual Growth Rate (CAGR) of 15.3%. Key markets such as Germany, France, and the United Kingdom lead this expansion, with Ireland and the Netherlands also demonstrating significant potential driven by increasing adoption and supportive government policies. The wind energy sector currently dominates, supported by advancements in offshore technology and large-scale projects. Solar power remains a crucial contributor, benefiting from ongoing innovation that enhances efficiency and reduces installation expenses. The bioenergy sector, though smaller, focuses on sustainable biomass and advanced biofuels. The market faces intense competition from established energy firms and specialized renewable energy companies. Challenges include managing intermittent supply, necessitating grid infrastructure upgrades, and securing land for project development.
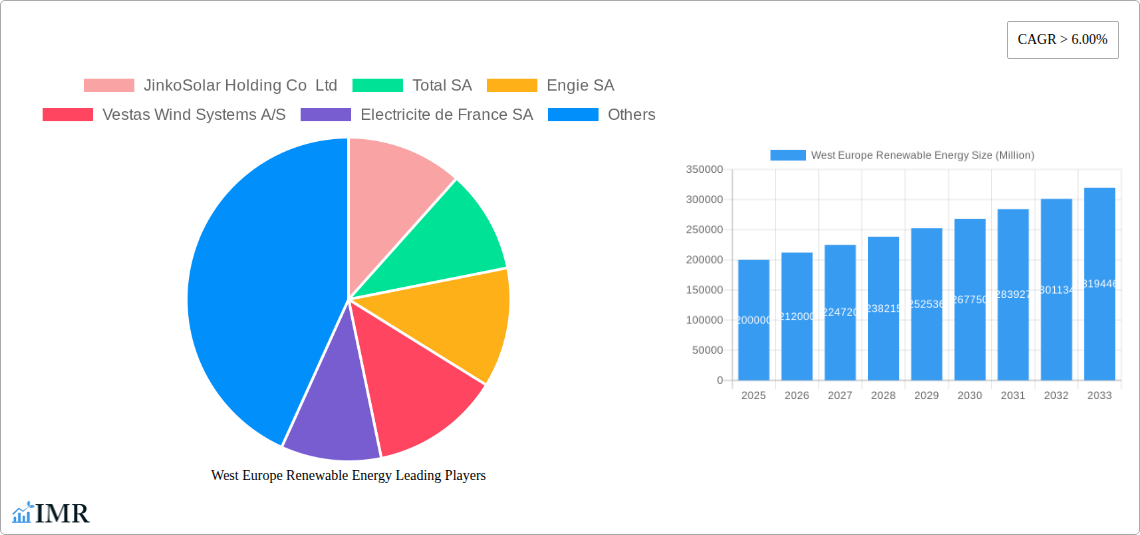
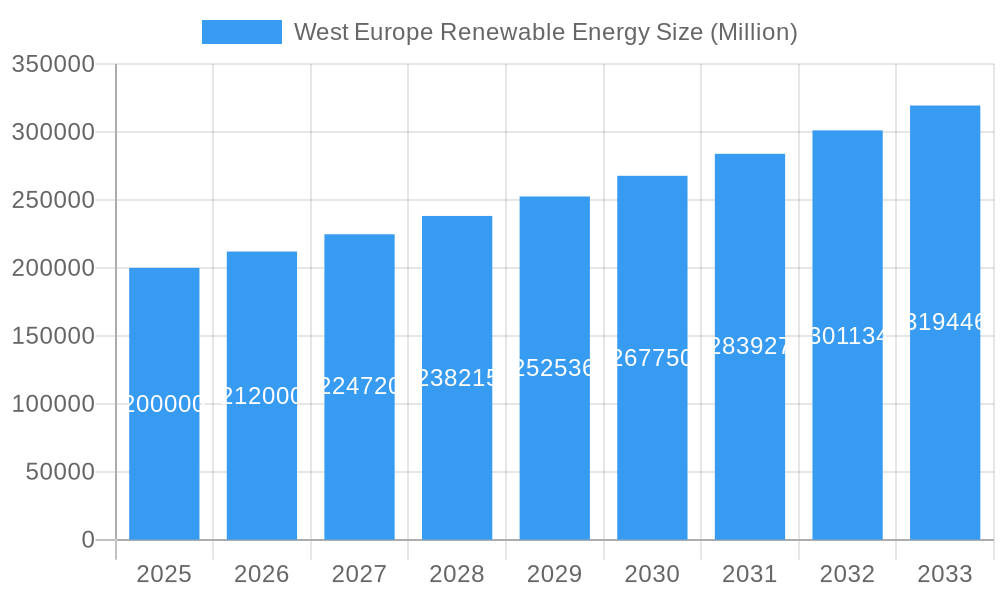
West Europe Renewable Energy Market Size (In Billion)
The forecast period from 2024 to 2033 anticipates significant market expansion in West Europe's renewable energy sector. Driven by the factors mentioned, the market size is expected to reach $384.3 billion by 2024 with a CAGR of 15.3%. This growth is particularly strong in leading nations like Germany and the UK, with further impetus from energy independence initiatives and diversification strategies across West European countries. Increased public and private investment in research and development will accelerate innovation and reduce renewable energy technology costs. However, potential challenges such as volatile energy prices, regulatory uncertainty, and supply chain disruptions require diligent oversight.
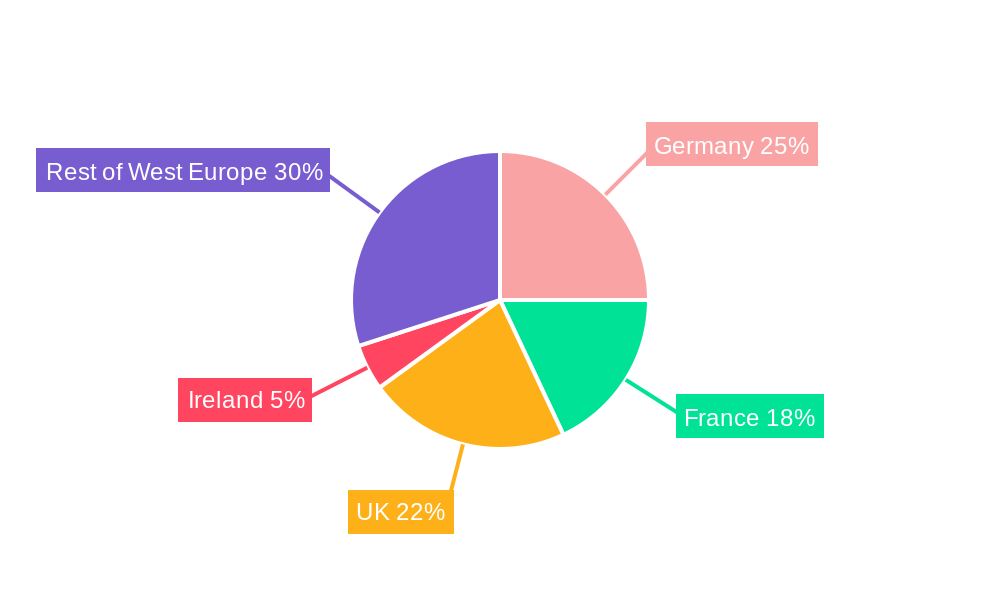
West Europe Renewable Energy Company Market Share
West Europe Renewable Energy Market Report: 2019-2033
This comprehensive report provides a detailed analysis of the West Europe renewable energy market, encompassing market dynamics, growth trends, key players, and future outlook. The study period covers 2019-2033, with 2025 as the base and estimated year. This report is essential for investors, industry professionals, and policymakers seeking a deep understanding of this rapidly evolving sector.
Keywords: West Europe renewable energy, renewable energy market, solar energy, wind energy, bioenergy, UK renewable energy, Germany renewable energy, France renewable energy, Ireland renewable energy, renewable energy investment, renewable energy market analysis, renewable energy forecast, JinkoSolar, Total SA, Engie, Vestas, EDF, Siemens Gamesa.
West Europe Renewable Energy Market Dynamics & Structure
The West European renewable energy market is characterized by increasing market concentration among major players, driven by significant mergers and acquisitions (M&A) activity. Technological innovation, particularly in offshore wind and solar photovoltaic (PV) technologies, is a key driver of growth. Stringent regulatory frameworks and supportive government policies further stimulate market expansion. However, the market faces competition from traditional energy sources and challenges related to grid integration and intermittency.
- Market Concentration: The top 5 players hold approximately xx% of the market share in 2025, indicating a moderately concentrated market. M&A activity has increased significantly, with xx deals valued at xx Million recorded between 2019 and 2024.
- Technological Innovation: Significant advancements in solar PV efficiency and offshore wind turbine capacity are driving cost reductions and improving energy output. However, innovation barriers exist in areas like energy storage and grid modernization.
- Regulatory Framework: The EU's Renewable Energy Directive and national-level policies supporting renewable energy development create a favorable regulatory environment. However, permitting processes and grid connection approvals can pose significant challenges.
- Competitive Landscape: Competition exists between different renewable energy sources (solar vs. wind) and with traditional fossil fuel-based energy sources. The increasing competitiveness of renewable energy technologies is a key driver of market growth.
- End-User Demographics: The primary end-users are electricity utilities, industrial consumers, and residential households. Growing awareness of climate change and the desire for sustainable energy sources is driving demand.
West Europe Renewable Energy Growth Trends & Insights
The West Europe renewable energy market is experiencing robust growth, driven by supportive government policies, decreasing technology costs, and increasing environmental concerns. The market size is projected to expand at a Compound Annual Growth Rate (CAGR) of xx% during the forecast period (2025-2033), reaching xx Million by 2033 from xx Million in 2025. This growth is fueled by increasing adoption rates across various segments, particularly in solar and wind energy. Technological advancements, such as the development of more efficient solar panels and larger wind turbines, are continuously improving cost-effectiveness and driving market penetration. Consumer behavior is shifting towards greener energy options, creating a strong demand for renewable energy products and services. The increasing integration of renewable energy into smart grids is further contributing to this rapid growth.
Dominant Regions, Countries, or Segments in West Europe Renewable Energy
Germany and the UK are the leading markets in West Europe for renewable energy, driven by strong government support and favorable geographical conditions. Within segments, wind energy (both onshore and offshore) dominates, followed by solar.
- Germany: Dominance is attributed to strong policy support, a well-established renewable energy infrastructure, and substantial investments in wind and solar energy. The country boasts significant installed capacity in both onshore and offshore wind, and its solar sector is also robust.
- United Kingdom: The UK benefits from its strong wind resources and a proactive government approach to offshore wind farm development. Significant investments are being made in offshore wind projects, driving significant market growth.
- France: While France lags behind Germany and the UK, its significant offshore wind development plans present substantial growth potential. The recent tender for two new offshore wind farms exemplifies this expansion.
- Wind Energy: Holds the largest market share due to favorable wind resources and economies of scale in wind turbine manufacturing. Offshore wind is a particularly high-growth segment.
- Solar Energy: Growth is primarily driven by decreasing solar PV costs and increasing deployment of rooftop solar systems.
West Europe Renewable Energy Product Landscape
The renewable energy product landscape is characterized by constant innovation, focusing on higher efficiency, lower costs, and improved grid integration capabilities. Developments in solar PV technology, such as perovskite solar cells and advanced bifacial panels, are improving energy conversion efficiency. Similarly, advancements in wind turbine design, including larger rotor diameters and taller towers, are leading to enhanced energy capture. These technological advancements are significantly impacting the performance metrics of renewable energy systems, leading to greater cost-competitiveness. Unique selling propositions include higher energy yields, longer lifespans, and reduced maintenance requirements.
Key Drivers, Barriers & Challenges in West Europe Renewable Energy
Key Drivers:
- Government policies and subsidies: Incentives, feed-in tariffs, and renewable energy targets drive investment and deployment.
- Decreasing technology costs: Cost reductions in solar PV and wind turbines make renewable energy more economically viable.
- Increasing public awareness of climate change: Consumer demand for sustainable energy is growing rapidly.
Key Challenges:
- Grid integration: Intermittency of renewable energy sources poses challenges to grid stability and requires investment in smart grids and energy storage solutions.
- Regulatory hurdles: Permitting processes and grid connection approvals can delay project implementation.
- Supply chain disruptions: Dependence on specific materials and manufacturing regions can create vulnerabilities. The impact is estimated to delay projects by an average of xx months and increase costs by xx Million annually.
Emerging Opportunities in West Europe Renewable Energy
- Offshore wind energy: Significant untapped potential exists in offshore wind, particularly in the North Sea.
- Green hydrogen production: Utilizing renewable energy to produce green hydrogen offers opportunities for decarbonizing various industries.
- Energy storage solutions: Growing demand for energy storage to address the intermittency of renewable energy sources.
Growth Accelerators in the West Europe Renewable Energy Industry
Technological advancements, such as improvements in battery technology and the development of more efficient renewable energy systems, are key growth accelerators. Strategic partnerships between energy companies, technology providers, and governments are accelerating the deployment of renewable energy projects. Expansion into new markets, such as offshore wind, and innovative business models are further enhancing market growth.
Key Players Shaping the West Europe Renewable Energy Market
- JinkoSolar Holding Co Ltd
- Total SA
- Engie SA
- Vestas Wind Systems A/S
- Electricite de France SA
- Siemens Gamesa Renewable Energy SA
- Renewable Energy Systems Ltd
- Ecotricity Group Ltd
- General Electric Company
Notable Milestones in West Europe Renewable Energy Sector
- December 2022: France launched tenders for two new offshore wind farms (2.5 GW total capacity).
- April 2022: Voltalia commenced construction of the 3.7 MW Montclar solar power plant in France.
In-Depth West Europe Renewable Energy Market Outlook
The West Europe renewable energy market is poised for sustained growth, driven by strong policy support, technological advancements, and increasing environmental awareness. Strategic opportunities exist in expanding offshore wind capacity, developing innovative energy storage solutions, and integrating renewable energy into diverse sectors. The market's future potential is substantial, with significant growth expected across all major segments.
West Europe Renewable Energy Segmentation
-
1. Source
- 1.1. Solar
- 1.2. Wind
- 1.3. Bioenergy
- 1.4. Other Sources
-
2. Geogrpahy
- 2.1. The United Kingdom
- 2.2. Germany
- 2.3. France
- 2.4. Ireland
- 2.5. Rest of West Europe
West Europe Renewable Energy Segmentation By Geography
-
1. North America
- 1.1. United States
- 1.2. Canada
- 1.3. Mexico
-
2. South America
- 2.1. Brazil
- 2.2. Argentina
- 2.3. Rest of South America
-
3. Europe
- 3.1. United Kingdom
- 3.2. Germany
- 3.3. France
- 3.4. Italy
- 3.5. Spain
- 3.6. Russia
- 3.7. Benelux
- 3.8. Nordics
- 3.9. Rest of Europe
-
4. Middle East & Africa
- 4.1. Turkey
- 4.2. Israel
- 4.3. GCC
- 4.4. North Africa
- 4.5. South Africa
- 4.6. Rest of Middle East & Africa
-
5. Asia Pacific
- 5.1. China
- 5.2. India
- 5.3. Japan
- 5.4. South Korea
- 5.5. ASEAN
- 5.6. Oceania
- 5.7. Rest of Asia Pacific
West Europe Renewable Energy Regional Market Share
Geographic Coverage of West Europe Renewable Energy
West Europe Renewable Energy REPORT HIGHLIGHTS
| Aspects | Details |
|---|---|
| Study Period | 2020-2034 |
| Base Year | 2025 |
| Estimated Year | 2026 |
| Forecast Period | 2026-2034 |
| Historical Period | 2020-2025 |
| Growth Rate | CAGR of 15.3% from 2020-2034 |
| Segmentation |
|
Table of Contents
- 1. Introduction
- 1.1. Research Scope
- 1.2. Market Segmentation
- 1.3. Research Methodology
- 1.4. Definitions and Assumptions
- 2. Executive Summary
- 2.1. Introduction
- 3. Market Dynamics
- 3.1. Introduction
- 3.2. Market Drivers
- 3.2.1. 4.; Demand for Solar Photovoltaic Installations4.; Growing Investments
- 3.3. Market Restrains
- 3.3.1. 4.; Increasing Wind Energy Installations
- 3.4. Market Trends
- 3.4.1. Wind Energy to Witness Significant Growth
- 4. Market Factor Analysis
- 4.1. Porters Five Forces
- 4.2. Supply/Value Chain
- 4.3. PESTEL analysis
- 4.4. Market Entropy
- 4.5. Patent/Trademark Analysis
- 5. Global West Europe Renewable Energy Analysis, Insights and Forecast, 2020-2032
- 5.1. Market Analysis, Insights and Forecast - by Source
- 5.1.1. Solar
- 5.1.2. Wind
- 5.1.3. Bioenergy
- 5.1.4. Other Sources
- 5.2. Market Analysis, Insights and Forecast - by Geogrpahy
- 5.2.1. The United Kingdom
- 5.2.2. Germany
- 5.2.3. France
- 5.2.4. Ireland
- 5.2.5. Rest of West Europe
- 5.3. Market Analysis, Insights and Forecast - by Region
- 5.3.1. North America
- 5.3.2. South America
- 5.3.3. Europe
- 5.3.4. Middle East & Africa
- 5.3.5. Asia Pacific
- 5.1. Market Analysis, Insights and Forecast - by Source
- 6. North America West Europe Renewable Energy Analysis, Insights and Forecast, 2020-2032
- 6.1. Market Analysis, Insights and Forecast - by Source
- 6.1.1. Solar
- 6.1.2. Wind
- 6.1.3. Bioenergy
- 6.1.4. Other Sources
- 6.2. Market Analysis, Insights and Forecast - by Geogrpahy
- 6.2.1. The United Kingdom
- 6.2.2. Germany
- 6.2.3. France
- 6.2.4. Ireland
- 6.2.5. Rest of West Europe
- 6.1. Market Analysis, Insights and Forecast - by Source
- 7. South America West Europe Renewable Energy Analysis, Insights and Forecast, 2020-2032
- 7.1. Market Analysis, Insights and Forecast - by Source
- 7.1.1. Solar
- 7.1.2. Wind
- 7.1.3. Bioenergy
- 7.1.4. Other Sources
- 7.2. Market Analysis, Insights and Forecast - by Geogrpahy
- 7.2.1. The United Kingdom
- 7.2.2. Germany
- 7.2.3. France
- 7.2.4. Ireland
- 7.2.5. Rest of West Europe
- 7.1. Market Analysis, Insights and Forecast - by Source
- 8. Europe West Europe Renewable Energy Analysis, Insights and Forecast, 2020-2032
- 8.1. Market Analysis, Insights and Forecast - by Source
- 8.1.1. Solar
- 8.1.2. Wind
- 8.1.3. Bioenergy
- 8.1.4. Other Sources
- 8.2. Market Analysis, Insights and Forecast - by Geogrpahy
- 8.2.1. The United Kingdom
- 8.2.2. Germany
- 8.2.3. France
- 8.2.4. Ireland
- 8.2.5. Rest of West Europe
- 8.1. Market Analysis, Insights and Forecast - by Source
- 9. Middle East & Africa West Europe Renewable Energy Analysis, Insights and Forecast, 2020-2032
- 9.1. Market Analysis, Insights and Forecast - by Source
- 9.1.1. Solar
- 9.1.2. Wind
- 9.1.3. Bioenergy
- 9.1.4. Other Sources
- 9.2. Market Analysis, Insights and Forecast - by Geogrpahy
- 9.2.1. The United Kingdom
- 9.2.2. Germany
- 9.2.3. France
- 9.2.4. Ireland
- 9.2.5. Rest of West Europe
- 9.1. Market Analysis, Insights and Forecast - by Source
- 10. Asia Pacific West Europe Renewable Energy Analysis, Insights and Forecast, 2020-2032
- 10.1. Market Analysis, Insights and Forecast - by Source
- 10.1.1. Solar
- 10.1.2. Wind
- 10.1.3. Bioenergy
- 10.1.4. Other Sources
- 10.2. Market Analysis, Insights and Forecast - by Geogrpahy
- 10.2.1. The United Kingdom
- 10.2.2. Germany
- 10.2.3. France
- 10.2.4. Ireland
- 10.2.5. Rest of West Europe
- 10.1. Market Analysis, Insights and Forecast - by Source
- 11. Competitive Analysis
- 11.1. Global Market Share Analysis 2025
- 11.2. Company Profiles
- 11.2.1 JinkoSolar Holding Co Ltd
- 11.2.1.1. Overview
- 11.2.1.2. Products
- 11.2.1.3. SWOT Analysis
- 11.2.1.4. Recent Developments
- 11.2.1.5. Financials (Based on Availability)
- 11.2.2 Total SA
- 11.2.2.1. Overview
- 11.2.2.2. Products
- 11.2.2.3. SWOT Analysis
- 11.2.2.4. Recent Developments
- 11.2.2.5. Financials (Based on Availability)
- 11.2.3 Engie SA
- 11.2.3.1. Overview
- 11.2.3.2. Products
- 11.2.3.3. SWOT Analysis
- 11.2.3.4. Recent Developments
- 11.2.3.5. Financials (Based on Availability)
- 11.2.4 Vestas Wind Systems A/S
- 11.2.4.1. Overview
- 11.2.4.2. Products
- 11.2.4.3. SWOT Analysis
- 11.2.4.4. Recent Developments
- 11.2.4.5. Financials (Based on Availability)
- 11.2.5 Electricite de France SA
- 11.2.5.1. Overview
- 11.2.5.2. Products
- 11.2.5.3. SWOT Analysis
- 11.2.5.4. Recent Developments
- 11.2.5.5. Financials (Based on Availability)
- 11.2.6 Siemens Gamesa Renewable Energy SA
- 11.2.6.1. Overview
- 11.2.6.2. Products
- 11.2.6.3. SWOT Analysis
- 11.2.6.4. Recent Developments
- 11.2.6.5. Financials (Based on Availability)
- 11.2.7 Renewable Energy Systems Ltd
- 11.2.7.1. Overview
- 11.2.7.2. Products
- 11.2.7.3. SWOT Analysis
- 11.2.7.4. Recent Developments
- 11.2.7.5. Financials (Based on Availability)
- 11.2.8 Ecotricity Group Ltd
- 11.2.8.1. Overview
- 11.2.8.2. Products
- 11.2.8.3. SWOT Analysis
- 11.2.8.4. Recent Developments
- 11.2.8.5. Financials (Based on Availability)
- 11.2.9 General Electric Company
- 11.2.9.1. Overview
- 11.2.9.2. Products
- 11.2.9.3. SWOT Analysis
- 11.2.9.4. Recent Developments
- 11.2.9.5. Financials (Based on Availability)
- 11.2.1 JinkoSolar Holding Co Ltd
List of Figures
- Figure 1: Global West Europe Renewable Energy Revenue Breakdown (billion, %) by Region 2025 & 2033
- Figure 2: Global West Europe Renewable Energy Volume Breakdown (Gigawatte, %) by Region 2025 & 2033
- Figure 3: North America West Europe Renewable Energy Revenue (billion), by Source 2025 & 2033
- Figure 4: North America West Europe Renewable Energy Volume (Gigawatte), by Source 2025 & 2033
- Figure 5: North America West Europe Renewable Energy Revenue Share (%), by Source 2025 & 2033
- Figure 6: North America West Europe Renewable Energy Volume Share (%), by Source 2025 & 2033
- Figure 7: North America West Europe Renewable Energy Revenue (billion), by Geogrpahy 2025 & 2033
- Figure 8: North America West Europe Renewable Energy Volume (Gigawatte), by Geogrpahy 2025 & 2033
- Figure 9: North America West Europe Renewable Energy Revenue Share (%), by Geogrpahy 2025 & 2033
- Figure 10: North America West Europe Renewable Energy Volume Share (%), by Geogrpahy 2025 & 2033
- Figure 11: North America West Europe Renewable Energy Revenue (billion), by Country 2025 & 2033
- Figure 12: North America West Europe Renewable Energy Volume (Gigawatte), by Country 2025 & 2033
- Figure 13: North America West Europe Renewable Energy Revenue Share (%), by Country 2025 & 2033
- Figure 14: North America West Europe Renewable Energy Volume Share (%), by Country 2025 & 2033
- Figure 15: South America West Europe Renewable Energy Revenue (billion), by Source 2025 & 2033
- Figure 16: South America West Europe Renewable Energy Volume (Gigawatte), by Source 2025 & 2033
- Figure 17: South America West Europe Renewable Energy Revenue Share (%), by Source 2025 & 2033
- Figure 18: South America West Europe Renewable Energy Volume Share (%), by Source 2025 & 2033
- Figure 19: South America West Europe Renewable Energy Revenue (billion), by Geogrpahy 2025 & 2033
- Figure 20: South America West Europe Renewable Energy Volume (Gigawatte), by Geogrpahy 2025 & 2033
- Figure 21: South America West Europe Renewable Energy Revenue Share (%), by Geogrpahy 2025 & 2033
- Figure 22: South America West Europe Renewable Energy Volume Share (%), by Geogrpahy 2025 & 2033
- Figure 23: South America West Europe Renewable Energy Revenue (billion), by Country 2025 & 2033
- Figure 24: South America West Europe Renewable Energy Volume (Gigawatte), by Country 2025 & 2033
- Figure 25: South America West Europe Renewable Energy Revenue Share (%), by Country 2025 & 2033
- Figure 26: South America West Europe Renewable Energy Volume Share (%), by Country 2025 & 2033
- Figure 27: Europe West Europe Renewable Energy Revenue (billion), by Source 2025 & 2033
- Figure 28: Europe West Europe Renewable Energy Volume (Gigawatte), by Source 2025 & 2033
- Figure 29: Europe West Europe Renewable Energy Revenue Share (%), by Source 2025 & 2033
- Figure 30: Europe West Europe Renewable Energy Volume Share (%), by Source 2025 & 2033
- Figure 31: Europe West Europe Renewable Energy Revenue (billion), by Geogrpahy 2025 & 2033
- Figure 32: Europe West Europe Renewable Energy Volume (Gigawatte), by Geogrpahy 2025 & 2033
- Figure 33: Europe West Europe Renewable Energy Revenue Share (%), by Geogrpahy 2025 & 2033
- Figure 34: Europe West Europe Renewable Energy Volume Share (%), by Geogrpahy 2025 & 2033
- Figure 35: Europe West Europe Renewable Energy Revenue (billion), by Country 2025 & 2033
- Figure 36: Europe West Europe Renewable Energy Volume (Gigawatte), by Country 2025 & 2033
- Figure 37: Europe West Europe Renewable Energy Revenue Share (%), by Country 2025 & 2033
- Figure 38: Europe West Europe Renewable Energy Volume Share (%), by Country 2025 & 2033
- Figure 39: Middle East & Africa West Europe Renewable Energy Revenue (billion), by Source 2025 & 2033
- Figure 40: Middle East & Africa West Europe Renewable Energy Volume (Gigawatte), by Source 2025 & 2033
- Figure 41: Middle East & Africa West Europe Renewable Energy Revenue Share (%), by Source 2025 & 2033
- Figure 42: Middle East & Africa West Europe Renewable Energy Volume Share (%), by Source 2025 & 2033
- Figure 43: Middle East & Africa West Europe Renewable Energy Revenue (billion), by Geogrpahy 2025 & 2033
- Figure 44: Middle East & Africa West Europe Renewable Energy Volume (Gigawatte), by Geogrpahy 2025 & 2033
- Figure 45: Middle East & Africa West Europe Renewable Energy Revenue Share (%), by Geogrpahy 2025 & 2033
- Figure 46: Middle East & Africa West Europe Renewable Energy Volume Share (%), by Geogrpahy 2025 & 2033
- Figure 47: Middle East & Africa West Europe Renewable Energy Revenue (billion), by Country 2025 & 2033
- Figure 48: Middle East & Africa West Europe Renewable Energy Volume (Gigawatte), by Country 2025 & 2033
- Figure 49: Middle East & Africa West Europe Renewable Energy Revenue Share (%), by Country 2025 & 2033
- Figure 50: Middle East & Africa West Europe Renewable Energy Volume Share (%), by Country 2025 & 2033
- Figure 51: Asia Pacific West Europe Renewable Energy Revenue (billion), by Source 2025 & 2033
- Figure 52: Asia Pacific West Europe Renewable Energy Volume (Gigawatte), by Source 2025 & 2033
- Figure 53: Asia Pacific West Europe Renewable Energy Revenue Share (%), by Source 2025 & 2033
- Figure 54: Asia Pacific West Europe Renewable Energy Volume Share (%), by Source 2025 & 2033
- Figure 55: Asia Pacific West Europe Renewable Energy Revenue (billion), by Geogrpahy 2025 & 2033
- Figure 56: Asia Pacific West Europe Renewable Energy Volume (Gigawatte), by Geogrpahy 2025 & 2033
- Figure 57: Asia Pacific West Europe Renewable Energy Revenue Share (%), by Geogrpahy 2025 & 2033
- Figure 58: Asia Pacific West Europe Renewable Energy Volume Share (%), by Geogrpahy 2025 & 2033
- Figure 59: Asia Pacific West Europe Renewable Energy Revenue (billion), by Country 2025 & 2033
- Figure 60: Asia Pacific West Europe Renewable Energy Volume (Gigawatte), by Country 2025 & 2033
- Figure 61: Asia Pacific West Europe Renewable Energy Revenue Share (%), by Country 2025 & 2033
- Figure 62: Asia Pacific West Europe Renewable Energy Volume Share (%), by Country 2025 & 2033
List of Tables
- Table 1: Global West Europe Renewable Energy Revenue billion Forecast, by Source 2020 & 2033
- Table 2: Global West Europe Renewable Energy Volume Gigawatte Forecast, by Source 2020 & 2033
- Table 3: Global West Europe Renewable Energy Revenue billion Forecast, by Geogrpahy 2020 & 2033
- Table 4: Global West Europe Renewable Energy Volume Gigawatte Forecast, by Geogrpahy 2020 & 2033
- Table 5: Global West Europe Renewable Energy Revenue billion Forecast, by Region 2020 & 2033
- Table 6: Global West Europe Renewable Energy Volume Gigawatte Forecast, by Region 2020 & 2033
- Table 7: Global West Europe Renewable Energy Revenue billion Forecast, by Source 2020 & 2033
- Table 8: Global West Europe Renewable Energy Volume Gigawatte Forecast, by Source 2020 & 2033
- Table 9: Global West Europe Renewable Energy Revenue billion Forecast, by Geogrpahy 2020 & 2033
- Table 10: Global West Europe Renewable Energy Volume Gigawatte Forecast, by Geogrpahy 2020 & 2033
- Table 11: Global West Europe Renewable Energy Revenue billion Forecast, by Country 2020 & 2033
- Table 12: Global West Europe Renewable Energy Volume Gigawatte Forecast, by Country 2020 & 2033
- Table 13: United States West Europe Renewable Energy Revenue (billion) Forecast, by Application 2020 & 2033
- Table 14: United States West Europe Renewable Energy Volume (Gigawatte) Forecast, by Application 2020 & 2033
- Table 15: Canada West Europe Renewable Energy Revenue (billion) Forecast, by Application 2020 & 2033
- Table 16: Canada West Europe Renewable Energy Volume (Gigawatte) Forecast, by Application 2020 & 2033
- Table 17: Mexico West Europe Renewable Energy Revenue (billion) Forecast, by Application 2020 & 2033
- Table 18: Mexico West Europe Renewable Energy Volume (Gigawatte) Forecast, by Application 2020 & 2033
- Table 19: Global West Europe Renewable Energy Revenue billion Forecast, by Source 2020 & 2033
- Table 20: Global West Europe Renewable Energy Volume Gigawatte Forecast, by Source 2020 & 2033
- Table 21: Global West Europe Renewable Energy Revenue billion Forecast, by Geogrpahy 2020 & 2033
- Table 22: Global West Europe Renewable Energy Volume Gigawatte Forecast, by Geogrpahy 2020 & 2033
- Table 23: Global West Europe Renewable Energy Revenue billion Forecast, by Country 2020 & 2033
- Table 24: Global West Europe Renewable Energy Volume Gigawatte Forecast, by Country 2020 & 2033
- Table 25: Brazil West Europe Renewable Energy Revenue (billion) Forecast, by Application 2020 & 2033
- Table 26: Brazil West Europe Renewable Energy Volume (Gigawatte) Forecast, by Application 2020 & 2033
- Table 27: Argentina West Europe Renewable Energy Revenue (billion) Forecast, by Application 2020 & 2033
- Table 28: Argentina West Europe Renewable Energy Volume (Gigawatte) Forecast, by Application 2020 & 2033
- Table 29: Rest of South America West Europe Renewable Energy Revenue (billion) Forecast, by Application 2020 & 2033
- Table 30: Rest of South America West Europe Renewable Energy Volume (Gigawatte) Forecast, by Application 2020 & 2033
- Table 31: Global West Europe Renewable Energy Revenue billion Forecast, by Source 2020 & 2033
- Table 32: Global West Europe Renewable Energy Volume Gigawatte Forecast, by Source 2020 & 2033
- Table 33: Global West Europe Renewable Energy Revenue billion Forecast, by Geogrpahy 2020 & 2033
- Table 34: Global West Europe Renewable Energy Volume Gigawatte Forecast, by Geogrpahy 2020 & 2033
- Table 35: Global West Europe Renewable Energy Revenue billion Forecast, by Country 2020 & 2033
- Table 36: Global West Europe Renewable Energy Volume Gigawatte Forecast, by Country 2020 & 2033
- Table 37: United Kingdom West Europe Renewable Energy Revenue (billion) Forecast, by Application 2020 & 2033
- Table 38: United Kingdom West Europe Renewable Energy Volume (Gigawatte) Forecast, by Application 2020 & 2033
- Table 39: Germany West Europe Renewable Energy Revenue (billion) Forecast, by Application 2020 & 2033
- Table 40: Germany West Europe Renewable Energy Volume (Gigawatte) Forecast, by Application 2020 & 2033
- Table 41: France West Europe Renewable Energy Revenue (billion) Forecast, by Application 2020 & 2033
- Table 42: France West Europe Renewable Energy Volume (Gigawatte) Forecast, by Application 2020 & 2033
- Table 43: Italy West Europe Renewable Energy Revenue (billion) Forecast, by Application 2020 & 2033
- Table 44: Italy West Europe Renewable Energy Volume (Gigawatte) Forecast, by Application 2020 & 2033
- Table 45: Spain West Europe Renewable Energy Revenue (billion) Forecast, by Application 2020 & 2033
- Table 46: Spain West Europe Renewable Energy Volume (Gigawatte) Forecast, by Application 2020 & 2033
- Table 47: Russia West Europe Renewable Energy Revenue (billion) Forecast, by Application 2020 & 2033
- Table 48: Russia West Europe Renewable Energy Volume (Gigawatte) Forecast, by Application 2020 & 2033
- Table 49: Benelux West Europe Renewable Energy Revenue (billion) Forecast, by Application 2020 & 2033
- Table 50: Benelux West Europe Renewable Energy Volume (Gigawatte) Forecast, by Application 2020 & 2033
- Table 51: Nordics West Europe Renewable Energy Revenue (billion) Forecast, by Application 2020 & 2033
- Table 52: Nordics West Europe Renewable Energy Volume (Gigawatte) Forecast, by Application 2020 & 2033
- Table 53: Rest of Europe West Europe Renewable Energy Revenue (billion) Forecast, by Application 2020 & 2033
- Table 54: Rest of Europe West Europe Renewable Energy Volume (Gigawatte) Forecast, by Application 2020 & 2033
- Table 55: Global West Europe Renewable Energy Revenue billion Forecast, by Source 2020 & 2033
- Table 56: Global West Europe Renewable Energy Volume Gigawatte Forecast, by Source 2020 & 2033
- Table 57: Global West Europe Renewable Energy Revenue billion Forecast, by Geogrpahy 2020 & 2033
- Table 58: Global West Europe Renewable Energy Volume Gigawatte Forecast, by Geogrpahy 2020 & 2033
- Table 59: Global West Europe Renewable Energy Revenue billion Forecast, by Country 2020 & 2033
- Table 60: Global West Europe Renewable Energy Volume Gigawatte Forecast, by Country 2020 & 2033
- Table 61: Turkey West Europe Renewable Energy Revenue (billion) Forecast, by Application 2020 & 2033
- Table 62: Turkey West Europe Renewable Energy Volume (Gigawatte) Forecast, by Application 2020 & 2033
- Table 63: Israel West Europe Renewable Energy Revenue (billion) Forecast, by Application 2020 & 2033
- Table 64: Israel West Europe Renewable Energy Volume (Gigawatte) Forecast, by Application 2020 & 2033
- Table 65: GCC West Europe Renewable Energy Revenue (billion) Forecast, by Application 2020 & 2033
- Table 66: GCC West Europe Renewable Energy Volume (Gigawatte) Forecast, by Application 2020 & 2033
- Table 67: North Africa West Europe Renewable Energy Revenue (billion) Forecast, by Application 2020 & 2033
- Table 68: North Africa West Europe Renewable Energy Volume (Gigawatte) Forecast, by Application 2020 & 2033
- Table 69: South Africa West Europe Renewable Energy Revenue (billion) Forecast, by Application 2020 & 2033
- Table 70: South Africa West Europe Renewable Energy Volume (Gigawatte) Forecast, by Application 2020 & 2033
- Table 71: Rest of Middle East & Africa West Europe Renewable Energy Revenue (billion) Forecast, by Application 2020 & 2033
- Table 72: Rest of Middle East & Africa West Europe Renewable Energy Volume (Gigawatte) Forecast, by Application 2020 & 2033
- Table 73: Global West Europe Renewable Energy Revenue billion Forecast, by Source 2020 & 2033
- Table 74: Global West Europe Renewable Energy Volume Gigawatte Forecast, by Source 2020 & 2033
- Table 75: Global West Europe Renewable Energy Revenue billion Forecast, by Geogrpahy 2020 & 2033
- Table 76: Global West Europe Renewable Energy Volume Gigawatte Forecast, by Geogrpahy 2020 & 2033
- Table 77: Global West Europe Renewable Energy Revenue billion Forecast, by Country 2020 & 2033
- Table 78: Global West Europe Renewable Energy Volume Gigawatte Forecast, by Country 2020 & 2033
- Table 79: China West Europe Renewable Energy Revenue (billion) Forecast, by Application 2020 & 2033
- Table 80: China West Europe Renewable Energy Volume (Gigawatte) Forecast, by Application 2020 & 2033
- Table 81: India West Europe Renewable Energy Revenue (billion) Forecast, by Application 2020 & 2033
- Table 82: India West Europe Renewable Energy Volume (Gigawatte) Forecast, by Application 2020 & 2033
- Table 83: Japan West Europe Renewable Energy Revenue (billion) Forecast, by Application 2020 & 2033
- Table 84: Japan West Europe Renewable Energy Volume (Gigawatte) Forecast, by Application 2020 & 2033
- Table 85: South Korea West Europe Renewable Energy Revenue (billion) Forecast, by Application 2020 & 2033
- Table 86: South Korea West Europe Renewable Energy Volume (Gigawatte) Forecast, by Application 2020 & 2033
- Table 87: ASEAN West Europe Renewable Energy Revenue (billion) Forecast, by Application 2020 & 2033
- Table 88: ASEAN West Europe Renewable Energy Volume (Gigawatte) Forecast, by Application 2020 & 2033
- Table 89: Oceania West Europe Renewable Energy Revenue (billion) Forecast, by Application 2020 & 2033
- Table 90: Oceania West Europe Renewable Energy Volume (Gigawatte) Forecast, by Application 2020 & 2033
- Table 91: Rest of Asia Pacific West Europe Renewable Energy Revenue (billion) Forecast, by Application 2020 & 2033
- Table 92: Rest of Asia Pacific West Europe Renewable Energy Volume (Gigawatte) Forecast, by Application 2020 & 2033
Frequently Asked Questions
1. What is the projected Compound Annual Growth Rate (CAGR) of the West Europe Renewable Energy?
The projected CAGR is approximately 15.3%.
2. Which companies are prominent players in the West Europe Renewable Energy?
Key companies in the market include JinkoSolar Holding Co Ltd, Total SA, Engie SA, Vestas Wind Systems A/S, Electricite de France SA, Siemens Gamesa Renewable Energy SA, Renewable Energy Systems Ltd, Ecotricity Group Ltd, General Electric Company.
3. What are the main segments of the West Europe Renewable Energy?
The market segments include Source, Geogrpahy.
4. Can you provide details about the market size?
The market size is estimated to be USD 384.3 billion as of 2022.
5. What are some drivers contributing to market growth?
4.; Demand for Solar Photovoltaic Installations4.; Growing Investments.
6. What are the notable trends driving market growth?
Wind Energy to Witness Significant Growth.
7. Are there any restraints impacting market growth?
4.; Increasing Wind Energy Installations.
8. Can you provide examples of recent developments in the market?
December 2022: France launched tenders for two new offshore wind farms, which are bottom-fixed and were expected to have a total capacity of 2.5 GW. The first wind farm was expected to be 35 km off Oléron Island in the Atlantic (Nouvelle-Aquitaine) with a capacity of about 1 GW. The second wind farm was expected to be 38 km off the coast of Normandy, with a capacity of approximately 1.5 GW. The projects were to be awarded at the end of 2023 or early 2024.
9. What pricing options are available for accessing the report?
Pricing options include single-user, multi-user, and enterprise licenses priced at USD 4750, USD 5250, and USD 8750 respectively.
10. Is the market size provided in terms of value or volume?
The market size is provided in terms of value, measured in billion and volume, measured in Gigawatte.
11. Are there any specific market keywords associated with the report?
Yes, the market keyword associated with the report is "West Europe Renewable Energy," which aids in identifying and referencing the specific market segment covered.
12. How do I determine which pricing option suits my needs best?
The pricing options vary based on user requirements and access needs. Individual users may opt for single-user licenses, while businesses requiring broader access may choose multi-user or enterprise licenses for cost-effective access to the report.
13. Are there any additional resources or data provided in the West Europe Renewable Energy report?
While the report offers comprehensive insights, it's advisable to review the specific contents or supplementary materials provided to ascertain if additional resources or data are available.
14. How can I stay updated on further developments or reports in the West Europe Renewable Energy?
To stay informed about further developments, trends, and reports in the West Europe Renewable Energy, consider subscribing to industry newsletters, following relevant companies and organizations, or regularly checking reputable industry news sources and publications.
Methodology
Step 1 - Identification of Relevant Samples Size from Population Database


Step 2 - Approaches for Defining Global Market Size (Value, Volume* & Price*)

Note*: In applicable scenarios
Step 3 - Data Sources
Primary Research
- Web Analytics
- Survey Reports
- Research Institute
- Latest Research Reports
- Opinion Leaders
Secondary Research
- Annual Reports
- White Paper
- Latest Press Release
- Industry Association
- Paid Database
- Investor Presentations

Step 4 - Data Triangulation
Involves using different sources of information in order to increase the validity of a study
These sources are likely to be stakeholders in a program - participants, other researchers, program staff, other community members, and so on.
Then we put all data in single framework & apply various statistical tools to find out the dynamic on the market.
During the analysis stage, feedback from the stakeholder groups would be compared to determine areas of agreement as well as areas of divergence