

Key Insights
The North America proppants market, valued at approximately $4.5 billion in 2025, is projected to experience robust growth, exhibiting a Compound Annual Growth Rate (CAGR) exceeding 7% from 2025 to 2033. This expansion is fueled by several key drivers. The resurgence in North American oil and gas extraction activities, particularly shale gas production through hydraulic fracturing, creates significant demand for proppants. Technological advancements in proppant manufacturing, leading to higher-performance and more efficient products, further stimulate market growth. Increased investment in research and development focused on enhancing proppant properties, like strength and conductivity, is also contributing to market expansion. The growing emphasis on environmentally friendly proppant solutions is creating new opportunities, while the increasing adoption of advanced fracturing techniques is boosting demand for specialized proppant types.
However, the market's growth is not without challenges. Fluctuations in oil and gas prices remain a significant restraint, impacting the overall demand for proppants. Stricter environmental regulations concerning the disposal of spent proppants and their potential environmental impact pose constraints. Furthermore, competition among numerous established players like Badger Mining Corporation, CoorsTek Inc., and others, as well as the emergence of new entrants, creates a dynamic and sometimes volatile market landscape. Despite these challenges, the long-term outlook for the North America proppants market remains positive, driven by the continued reliance on hydraulic fracturing and the ongoing innovation within the sector. The increasing adoption of sustainable practices within the oil and gas industry is likely to further shape market dynamics, favouring companies offering environmentally friendly proppant solutions.

North America Proppants Market: A Comprehensive Report (2019-2033)
This in-depth report provides a comprehensive analysis of the North America proppants market, encompassing market dynamics, growth trends, regional dominance, product landscape, key players, and future outlook. The study period covers 2019-2033, with 2025 as the base and estimated year. This report is essential for industry professionals, investors, and strategists seeking a clear understanding of this dynamic market. The parent market is the North American Oil and Gas industry, while the child market focuses specifically on proppant materials and their applications within hydraulic fracturing and well completion.
North America Proppants Market Dynamics & Structure
The North America proppants market is characterized by a moderately concentrated structure, with several major players holding significant market share. Market concentration is influenced by economies of scale in production and distribution, technological innovation in proppant manufacturing, and the consolidation through mergers and acquisitions (M&A). The report analyzes the competitive landscape, identifying key players and evaluating their market positions. Technological innovations, such as the development of resin-coated proppants and higher-strength proppants, continue to drive market growth. However, innovation barriers include high research and development costs, stringent regulatory frameworks governing proppant usage, and the availability of competitive substitutes. End-user demographics are primarily focused on oil and gas exploration and production companies, with regional variations reflecting the distribution of shale gas and tight oil reserves.
- Market Concentration: Moderately concentrated, with top 5 players holding approximately xx% of market share in 2024 (estimated).
- M&A Activity: Significant M&A activity observed in the historical period, with an estimated xx number of deals completed between 2019 and 2024.
- Technological Innovation: Focus on improving proppant strength, conductivity, and cost-effectiveness through resin-coating and advanced manufacturing processes.
- Regulatory Framework: Stringent environmental regulations impacting proppant production and disposal methods.
- Substitute Products: Limited readily available substitutes, with ceramic proppants representing a niche segment.
North America Proppants Market Growth Trends & Insights
The North America proppants market experienced significant growth during the historical period (2019-2024), driven primarily by the expansion of unconventional oil and gas production. Market size reached xx million units in 2024 (estimated). This growth is projected to continue, although at a moderated pace, during the forecast period (2025-2033). The Compound Annual Growth Rate (CAGR) is estimated at xx% during 2025-2033. Technological disruptions, particularly the adoption of resin-coated proppants and enhanced manufacturing techniques, have contributed to improved proppant performance and efficiency. Fluctuations in oil and gas prices, and shifts in energy policy remain influential factors impacting adoption rates and investment decisions. Technological advancements are also influencing consumer behavior, with a growing preference for higher-performing proppants that enhance well productivity and reduce operational costs. Market penetration of resin-coated proppants is expected to increase from xx% in 2024 to xx% by 2033.

Dominant Regions, Countries, or Segments in North America Proppants Market
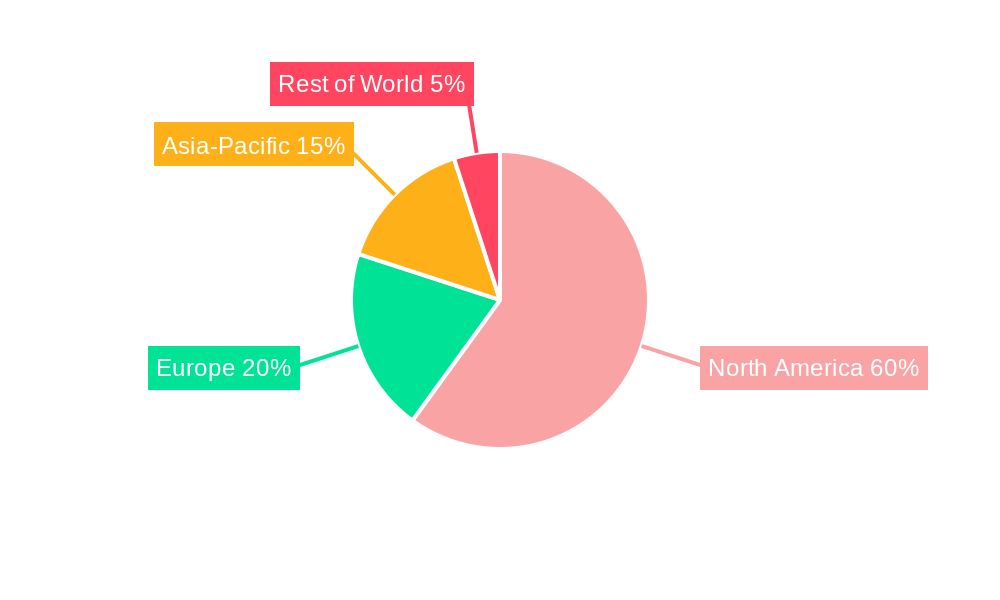
The Permian Basin in the United States remains the dominant region in the North America proppants market, followed by other major shale gas and tight oil plays across the United States and Canada. This dominance is driven by the substantial concentration of unconventional oil and gas reserves, significant investment in exploration and production, and supportive regulatory frameworks. The high concentration of oil and gas production facilities and well completion activities in specific regions translates into increased demand for proppants.
- Key Drivers: High concentration of oil and gas reserves; robust investment in exploration and production; established infrastructure for proppant transportation and logistics; favorable government policies and incentives (variations between states and provinces).
- Dominance Factors: High concentration of oil & gas production activity; established supply chains; proximity to key production areas; significant investment in infrastructure.
North America Proppants Market Product Landscape
The North America proppants market offers a range of products, including ceramic proppants, sand proppants (primarily frac sand), and resin-coated proppants. Resin-coated proppants are gaining traction due to their superior strength and conductivity, enhancing well productivity and extending the lifespan of the well. Ongoing innovation focuses on enhancing the strength, durability, and conductivity of proppants, aiming to further reduce costs and improve efficiency during hydraulic fracturing operations. Unique selling propositions center on improved proppant performance characteristics and reduced operational costs.
Key Drivers, Barriers & Challenges in North America Proppants Market
Key Drivers: Increased unconventional oil and gas production; technological advancements in proppant design and manufacturing; supportive government policies in some regions; growing demand for improved well productivity.
Key Challenges: Fluctuations in oil and gas prices; environmental regulations and their impact on production and disposal; intense competition among proppant producers; supply chain disruptions; transportation costs. Supply chain disruptions, for example, impacted production in 202x, reducing supply by an estimated xx%.
Emerging Opportunities in North America Proppants Market
Emerging opportunities lie in the development of sustainable and environmentally friendly proppants, the expansion into new geographic markets, and the potential for enhanced applications beyond hydraulic fracturing. The development of biodegradable or recyclable proppants offers a significant potential area of growth, in line with growing environmental concerns. Furthermore, the exploration of new applications in other sectors, beyond oil and gas, could also create new market opportunities.
Growth Accelerators in the North America Proppants Market Industry
Long-term growth will be accelerated by technological breakthroughs in proppant design and manufacturing, strategic partnerships among proppant producers and oil & gas companies, and the expansion into new markets, including emerging international markets. Strategic partnerships, such as the one between Hexion and Wayfinder, are enhancing supply chain efficiencies and expanding market reach. Technological improvements focusing on increased proppant performance at lower costs will propel further market expansion.
Key Players Shaping the North America Proppants Market Market
- Badger Mining Corporation
- CoorsTek Inc
- Covia Holdings Corporation
- Eagle Materials Inc
- Fores LTD
- Halliburton
- Hexion
- Hi-Crush
- Imerys
- Preferred Proppants LLC
- Saint-Gobain
- Schlumberger Limited
- Superior Silica Sands (Emerge Energy Services)
- US SILICA
- WAYFINDER
*List Not Exhaustive
Notable Milestones in North America Proppants Market Sector
- September 2022: Hexion Inc. and Wayfinder Corp. partnered to better serve resin-coated proppant users in the Western Canadian Sedimentary Basin.
- October 2021: U.S. Silica announced the exploration of separating its non-oil and gas division.
In-Depth North America Proppants Market Market Outlook
The North America proppants market is poised for continued growth, driven by sustained demand from the oil and gas industry, coupled with technological advancements that improve proppant performance and reduce costs. Strategic partnerships, coupled with increased investment in research and development, will unlock further growth potential. The market's future hinges on the stability of oil and gas prices, effective management of environmental regulations, and the continued development of innovative proppant solutions. Opportunities abound for companies that can effectively navigate these factors and adapt to evolving market demands.
North America Proppants Market Segmentation
-
1. Type
- 1.1. Frac Sand
- 1.2. Resin Coated
- 1.3. Ceramic
-
2. Geography
- 2.1. United States
- 2.2. Canada
- 2.3. Mexico
North America Proppants Market Segmentation By Geography
- 1. United States
- 2. Canada
- 3. Mexico
North America Proppants Market REPORT HIGHLIGHTS
| Aspects | Details |
|---|---|
| Study Period | 2019-2033 |
| Base Year | 2024 |
| Estimated Year | 2025 |
| Forecast Period | 2025-2033 |
| Historical Period | 2019-2024 |
| Growth Rate | CAGR of > 7.00% from 2019-2033 |
| Segmentation |
|
Table of Contents
- 1. Introduction
- 1.1. Research Scope
- 1.2. Market Segmentation
- 1.3. Research Methodology
- 1.4. Definitions and Assumptions
- 2. Executive Summary
- 2.1. Introduction
- 3. Market Dynamics
- 3.1. Introduction
- 3.2. Market Drivers
- 3.2.1. Improvements in Fracking Technology; Increasing Usage of Frac Sand (Quantity per Well); Increasing Shale Gas Production Activities
- 3.3. Market Restrains
- 3.3.1. Improvements in Fracking Technology; Increasing Usage of Frac Sand (Quantity per Well); Increasing Shale Gas Production Activities
- 3.4. Market Trends
- 3.4.1. Frac Sand to Dominate the Market
- 4. Market Factor Analysis
- 4.1. Porters Five Forces
- 4.2. Supply/Value Chain
- 4.3. PESTEL analysis
- 4.4. Market Entropy
- 4.5. Patent/Trademark Analysis
- 5. Global North America Proppants Market Analysis, Insights and Forecast, 2019-2031
- 5.1. Market Analysis, Insights and Forecast - by Type
- 5.1.1. Frac Sand
- 5.1.2. Resin Coated
- 5.1.3. Ceramic
- 5.2. Market Analysis, Insights and Forecast - by Geography
- 5.2.1. United States
- 5.2.2. Canada
- 5.2.3. Mexico
- 5.3. Market Analysis, Insights and Forecast - by Region
- 5.3.1. United States
- 5.3.2. Canada
- 5.3.3. Mexico
- 5.1. Market Analysis, Insights and Forecast - by Type
- 6. United States North America Proppants Market Analysis, Insights and Forecast, 2019-2031
- 6.1. Market Analysis, Insights and Forecast - by Type
- 6.1.1. Frac Sand
- 6.1.2. Resin Coated
- 6.1.3. Ceramic
- 6.2. Market Analysis, Insights and Forecast - by Geography
- 6.2.1. United States
- 6.2.2. Canada
- 6.2.3. Mexico
- 6.1. Market Analysis, Insights and Forecast - by Type
- 7. Canada North America Proppants Market Analysis, Insights and Forecast, 2019-2031
- 7.1. Market Analysis, Insights and Forecast - by Type
- 7.1.1. Frac Sand
- 7.1.2. Resin Coated
- 7.1.3. Ceramic
- 7.2. Market Analysis, Insights and Forecast - by Geography
- 7.2.1. United States
- 7.2.2. Canada
- 7.2.3. Mexico
- 7.1. Market Analysis, Insights and Forecast - by Type
- 8. Mexico North America Proppants Market Analysis, Insights and Forecast, 2019-2031
- 8.1. Market Analysis, Insights and Forecast - by Type
- 8.1.1. Frac Sand
- 8.1.2. Resin Coated
- 8.1.3. Ceramic
- 8.2. Market Analysis, Insights and Forecast - by Geography
- 8.2.1. United States
- 8.2.2. Canada
- 8.2.3. Mexico
- 8.1. Market Analysis, Insights and Forecast - by Type
- 9. Competitive Analysis
- 9.1. Global Market Share Analysis 2024
- 9.2. Company Profiles
- 9.2.1 Badger Mining Corporation
- 9.2.1.1. Overview
- 9.2.1.2. Products
- 9.2.1.3. SWOT Analysis
- 9.2.1.4. Recent Developments
- 9.2.1.5. Financials (Based on Availability)
- 9.2.2 CoorsTek Inc
- 9.2.2.1. Overview
- 9.2.2.2. Products
- 9.2.2.3. SWOT Analysis
- 9.2.2.4. Recent Developments
- 9.2.2.5. Financials (Based on Availability)
- 9.2.3 Covia Holdings Corporation
- 9.2.3.1. Overview
- 9.2.3.2. Products
- 9.2.3.3. SWOT Analysis
- 9.2.3.4. Recent Developments
- 9.2.3.5. Financials (Based on Availability)
- 9.2.4 Eagle Materials Inc
- 9.2.4.1. Overview
- 9.2.4.2. Products
- 9.2.4.3. SWOT Analysis
- 9.2.4.4. Recent Developments
- 9.2.4.5. Financials (Based on Availability)
- 9.2.5 Fores LTD
- 9.2.5.1. Overview
- 9.2.5.2. Products
- 9.2.5.3. SWOT Analysis
- 9.2.5.4. Recent Developments
- 9.2.5.5. Financials (Based on Availability)
- 9.2.6 Halliburton
- 9.2.6.1. Overview
- 9.2.6.2. Products
- 9.2.6.3. SWOT Analysis
- 9.2.6.4. Recent Developments
- 9.2.6.5. Financials (Based on Availability)
- 9.2.7 Hexion
- 9.2.7.1. Overview
- 9.2.7.2. Products
- 9.2.7.3. SWOT Analysis
- 9.2.7.4. Recent Developments
- 9.2.7.5. Financials (Based on Availability)
- 9.2.8 Hi-Crush
- 9.2.8.1. Overview
- 9.2.8.2. Products
- 9.2.8.3. SWOT Analysis
- 9.2.8.4. Recent Developments
- 9.2.8.5. Financials (Based on Availability)
- 9.2.9 Imerys
- 9.2.9.1. Overview
- 9.2.9.2. Products
- 9.2.9.3. SWOT Analysis
- 9.2.9.4. Recent Developments
- 9.2.9.5. Financials (Based on Availability)
- 9.2.10 Preferred Proppants LLC
- 9.2.10.1. Overview
- 9.2.10.2. Products
- 9.2.10.3. SWOT Analysis
- 9.2.10.4. Recent Developments
- 9.2.10.5. Financials (Based on Availability)
- 9.2.11 Saint-Gobain
- 9.2.11.1. Overview
- 9.2.11.2. Products
- 9.2.11.3. SWOT Analysis
- 9.2.11.4. Recent Developments
- 9.2.11.5. Financials (Based on Availability)
- 9.2.12 Schlumberger Limited
- 9.2.12.1. Overview
- 9.2.12.2. Products
- 9.2.12.3. SWOT Analysis
- 9.2.12.4. Recent Developments
- 9.2.12.5. Financials (Based on Availability)
- 9.2.13 Superior Silica Sands (Emerge Energy Services)
- 9.2.13.1. Overview
- 9.2.13.2. Products
- 9.2.13.3. SWOT Analysis
- 9.2.13.4. Recent Developments
- 9.2.13.5. Financials (Based on Availability)
- 9.2.14 US SILICA
- 9.2.14.1. Overview
- 9.2.14.2. Products
- 9.2.14.3. SWOT Analysis
- 9.2.14.4. Recent Developments
- 9.2.14.5. Financials (Based on Availability)
- 9.2.15 WAYFINDER*List Not Exhaustive
- 9.2.15.1. Overview
- 9.2.15.2. Products
- 9.2.15.3. SWOT Analysis
- 9.2.15.4. Recent Developments
- 9.2.15.5. Financials (Based on Availability)
- 9.2.1 Badger Mining Corporation
List of Figures
- Figure 1: Global North America Proppants Market Revenue Breakdown (Million, %) by Region 2024 & 2032
- Figure 2: United States North America Proppants Market Revenue (Million), by Type 2024 & 2032
- Figure 3: United States North America Proppants Market Revenue Share (%), by Type 2024 & 2032
- Figure 4: United States North America Proppants Market Revenue (Million), by Geography 2024 & 2032
- Figure 5: United States North America Proppants Market Revenue Share (%), by Geography 2024 & 2032
- Figure 6: United States North America Proppants Market Revenue (Million), by Country 2024 & 2032
- Figure 7: United States North America Proppants Market Revenue Share (%), by Country 2024 & 2032
- Figure 8: Canada North America Proppants Market Revenue (Million), by Type 2024 & 2032
- Figure 9: Canada North America Proppants Market Revenue Share (%), by Type 2024 & 2032
- Figure 10: Canada North America Proppants Market Revenue (Million), by Geography 2024 & 2032
- Figure 11: Canada North America Proppants Market Revenue Share (%), by Geography 2024 & 2032
- Figure 12: Canada North America Proppants Market Revenue (Million), by Country 2024 & 2032
- Figure 13: Canada North America Proppants Market Revenue Share (%), by Country 2024 & 2032
- Figure 14: Mexico North America Proppants Market Revenue (Million), by Type 2024 & 2032
- Figure 15: Mexico North America Proppants Market Revenue Share (%), by Type 2024 & 2032
- Figure 16: Mexico North America Proppants Market Revenue (Million), by Geography 2024 & 2032
- Figure 17: Mexico North America Proppants Market Revenue Share (%), by Geography 2024 & 2032
- Figure 18: Mexico North America Proppants Market Revenue (Million), by Country 2024 & 2032
- Figure 19: Mexico North America Proppants Market Revenue Share (%), by Country 2024 & 2032
List of Tables
- Table 1: Global North America Proppants Market Revenue Million Forecast, by Region 2019 & 2032
- Table 2: Global North America Proppants Market Revenue Million Forecast, by Type 2019 & 2032
- Table 3: Global North America Proppants Market Revenue Million Forecast, by Geography 2019 & 2032
- Table 4: Global North America Proppants Market Revenue Million Forecast, by Region 2019 & 2032
- Table 5: Global North America Proppants Market Revenue Million Forecast, by Type 2019 & 2032
- Table 6: Global North America Proppants Market Revenue Million Forecast, by Geography 2019 & 2032
- Table 7: Global North America Proppants Market Revenue Million Forecast, by Country 2019 & 2032
- Table 8: Global North America Proppants Market Revenue Million Forecast, by Type 2019 & 2032
- Table 9: Global North America Proppants Market Revenue Million Forecast, by Geography 2019 & 2032
- Table 10: Global North America Proppants Market Revenue Million Forecast, by Country 2019 & 2032
- Table 11: Global North America Proppants Market Revenue Million Forecast, by Type 2019 & 2032
- Table 12: Global North America Proppants Market Revenue Million Forecast, by Geography 2019 & 2032
- Table 13: Global North America Proppants Market Revenue Million Forecast, by Country 2019 & 2032
Frequently Asked Questions
1. What is the projected Compound Annual Growth Rate (CAGR) of the North America Proppants Market?
The projected CAGR is approximately > 7.00%.
2. Which companies are prominent players in the North America Proppants Market?
Key companies in the market include Badger Mining Corporation, CoorsTek Inc, Covia Holdings Corporation, Eagle Materials Inc, Fores LTD, Halliburton, Hexion, Hi-Crush, Imerys, Preferred Proppants LLC, Saint-Gobain, Schlumberger Limited, Superior Silica Sands (Emerge Energy Services), US SILICA, WAYFINDER*List Not Exhaustive.
3. What are the main segments of the North America Proppants Market?
The market segments include Type, Geography.
4. Can you provide details about the market size?
The market size is estimated to be USD XX Million as of 2022.
5. What are some drivers contributing to market growth?
Improvements in Fracking Technology; Increasing Usage of Frac Sand (Quantity per Well); Increasing Shale Gas Production Activities.
6. What are the notable trends driving market growth?
Frac Sand to Dominate the Market.
7. Are there any restraints impacting market growth?
Improvements in Fracking Technology; Increasing Usage of Frac Sand (Quantity per Well); Increasing Shale Gas Production Activities.
8. Can you provide examples of recent developments in the market?
In September 2022, Hexion Inc. and Wayfinder Corp partnered to better serve resin-coated proppant users in the Western Canadian Sedimentary Basin. This strategic partnership joined Hexion's leading resin and chemical expertise with Wayfinder's new state-of-the-art manufacturing facility and logistics network.
9. What pricing options are available for accessing the report?
Pricing options include single-user, multi-user, and enterprise licenses priced at USD 4750, USD 5250, and USD 8750 respectively.
10. Is the market size provided in terms of value or volume?
The market size is provided in terms of value, measured in Million.
11. Are there any specific market keywords associated with the report?
Yes, the market keyword associated with the report is "North America Proppants Market," which aids in identifying and referencing the specific market segment covered.
12. How do I determine which pricing option suits my needs best?
The pricing options vary based on user requirements and access needs. Individual users may opt for single-user licenses, while businesses requiring broader access may choose multi-user or enterprise licenses for cost-effective access to the report.
13. Are there any additional resources or data provided in the North America Proppants Market report?
While the report offers comprehensive insights, it's advisable to review the specific contents or supplementary materials provided to ascertain if additional resources or data are available.
14. How can I stay updated on further developments or reports in the North America Proppants Market?
To stay informed about further developments, trends, and reports in the North America Proppants Market, consider subscribing to industry newsletters, following relevant companies and organizations, or regularly checking reputable industry news sources and publications.
Methodology
Step 1 - Identification of Relevant Samples Size from Population Database


Step 2 - Approaches for Defining Global Market Size (Value, Volume* & Price*)

Note*: In applicable scenarios
Step 3 - Data Sources
Primary Research
- Web Analytics
- Survey Reports
- Research Institute
- Latest Research Reports
- Opinion Leaders
Secondary Research
- Annual Reports
- White Paper
- Latest Press Release
- Industry Association
- Paid Database
- Investor Presentations

Step 4 - Data Triangulation
Involves using different sources of information in order to increase the validity of a study
These sources are likely to be stakeholders in a program - participants, other researchers, program staff, other community members, and so on.
Then we put all data in single framework & apply various statistical tools to find out the dynamic on the market.
During the analysis stage, feedback from the stakeholder groups would be compared to determine areas of agreement as well as areas of divergence
