

Key Insights
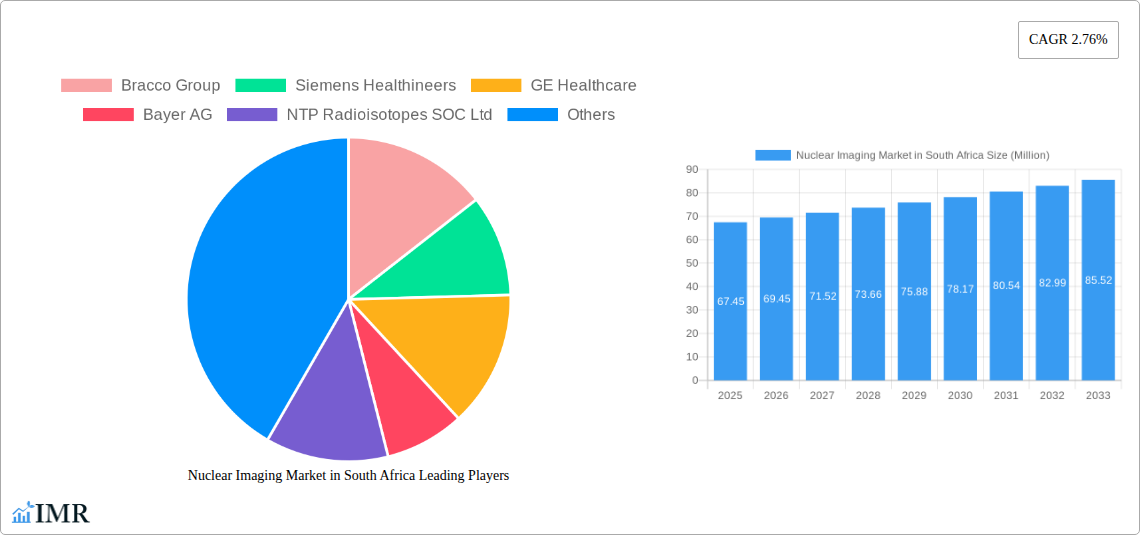
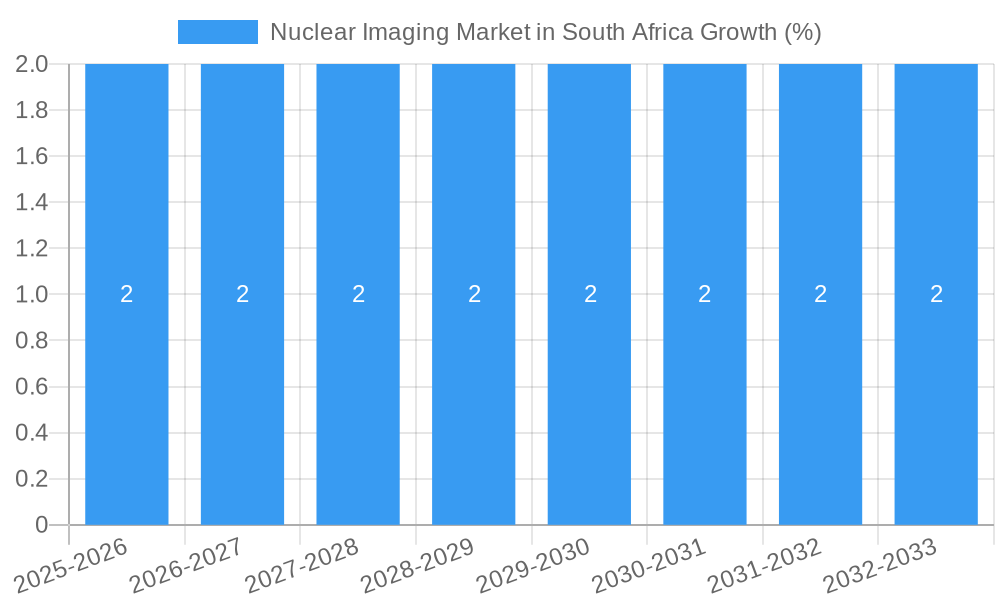
The South African nuclear imaging market, valued at approximately $67.45 million in 2025, exhibits a moderate growth trajectory, projected to expand at a Compound Annual Growth Rate (CAGR) of 2.76% from 2025 to 2033. This growth is fueled by several key factors. Increased prevalence of chronic diseases like cancer, cardiovascular diseases, and neurological disorders necessitates advanced diagnostic tools, driving demand for nuclear imaging techniques such as SPECT and PET scans. Furthermore, ongoing investments in healthcare infrastructure and technological advancements in imaging equipment, including improved resolution and faster scan times, contribute significantly to market expansion. Government initiatives promoting early disease detection and improved healthcare access in South Africa also positively impact market growth. However, challenges such as high equipment costs, limited skilled personnel, and the need for specialized infrastructure could restrain market expansion to some extent. The market segmentation reveals that equipment sales will likely comprise a significant portion of the total market value, followed by diagnostic radioisotopes. Within applications, PET and SPECT scans dominate due to their efficacy in detecting and characterizing various diseases. Key players such as Bracco Group, Siemens Healthineers, and GE Healthcare hold substantial market shares, leveraging their established presence and advanced technology offerings.
Considering the African context and the South African market's relatively developed healthcare infrastructure compared to other African nations, specific growth projections for this segment within South Africa are crucial. Growth projections for the next decade are optimistic, given the ongoing investments in healthcare improvement and the increasing prevalence of diseases requiring nuclear imaging for diagnosis and management. The potential for increased government funding for healthcare improvements and potential expansions into private sector healthcare further bolster this prediction. However, careful consideration must be given to potential economic fluctuations and the ongoing need for skilled personnel and adequate infrastructure. A robust regulatory framework ensuring safety and quality control within the sector remains vital for sustaining market growth and maintaining patient trust.
Nuclear Imaging Market in South Africa: A Comprehensive Market Report (2019-2033)
This in-depth report provides a comprehensive analysis of the Nuclear Imaging Market in South Africa, covering market dynamics, growth trends, key players, and future outlook. The study period spans from 2019 to 2033, with 2025 as the base and estimated year. This report is invaluable for industry professionals, investors, and strategic decision-makers seeking to understand and capitalize on opportunities within this dynamic market. The report segments the market by Product (Equipment, Diagnostic Radioisotopes) and Application (SPECT Applications, PET Applications, Other SPECT Applications), providing granular insights into each segment's performance and growth trajectory.
The total market size is projected to reach xx Million by 2033.
Nuclear Imaging Market in South Africa Market Dynamics & Structure
This section analyzes the South African nuclear imaging market's structure, competitive landscape, and influencing factors. Market concentration is currently moderate, with several key players vying for market share. Technological innovation, primarily driven by advancements in imaging equipment and radioisotopes, is a significant growth driver. Stringent regulatory frameworks, particularly concerning radiation safety and quality control, shape market operations. The market experiences limited competitive substitution due to the specialized nature of nuclear imaging technologies. End-user demographics are crucial, with a significant proportion of demand driven by the growing prevalence of chronic diseases requiring diagnostic imaging. The market has witnessed limited M&A activity in recent years, with a total of xx deals recorded between 2019 and 2024.
- Market Concentration: Moderate, with no single dominant player.
- Technological Innovation: Continuous advancements in SPECT and PET technologies are driving market expansion.
- Regulatory Framework: Stringent regulations ensure safety and quality, potentially impacting market entry.
- Competitive Substitutes: Limited due to the specialized nature of the technology.
- End-User Demographics: Growth linked to increasing prevalence of cancer and cardiovascular diseases.
- M&A Activity: xx deals between 2019 and 2024, indicating moderate consolidation.
Nuclear Imaging Market in South Africa Growth Trends & Insights
The South African nuclear imaging market has witnessed consistent growth over the historical period (2019-2024). The market size has grown from xx Million in 2019 to xx Million in 2024, registering a CAGR of xx%. This growth can be attributed to several factors including increased healthcare expenditure, rising prevalence of chronic diseases necessitating nuclear imaging procedures, and government initiatives to improve healthcare infrastructure. Technological advancements in PET and SPECT scanners have enhanced diagnostic capabilities, thereby augmenting market demand. Furthermore, increasing awareness among patients and physicians about the benefits of nuclear imaging is contributing to the growth of the market. The market penetration rate is estimated at xx% in 2025, and is expected to reach xx% by 2033.
Dominant Regions, Countries, or Segments in Nuclear Imaging Market in South Africa
The Gauteng province holds the largest market share in the South African nuclear imaging market, owing to its concentration of major hospitals and medical centers. This is further driven by the high concentration of specialists in major cities such as Johannesburg and Pretoria. The Equipment segment dominates the product landscape, accounting for approximately xx% of the market in 2025. Within applications, PET applications are projected to exhibit the fastest growth rate due to increasing demand for precise cancer diagnostics.
- Gauteng Province: Highest market share due to concentrated healthcare infrastructure and specialists.
- Equipment Segment: Dominant product segment due to high capital expenditure.
- PET Applications: Fastest-growing application due to increasing demand for accurate cancer diagnosis.
- Key Drivers: Expanding healthcare infrastructure, rising prevalence of chronic diseases, and government initiatives.
Nuclear Imaging Market in South Africa Product Landscape
The South African nuclear imaging market showcases a diverse range of products, including advanced SPECT and PET scanners offering superior image quality and faster scan times. These innovations enhance diagnostic capabilities, enabling early disease detection and improved treatment outcomes. Manufacturers are constantly introducing products with improved functionalities, such as higher resolution imaging, reduced radiation exposure, and enhanced software for image analysis. These advancements contribute to better patient care and increased adoption.
Key Drivers, Barriers & Challenges in Nuclear Imaging Market in South Africa
Key Drivers:
- Increasing prevalence of cancer and cardiovascular diseases.
- Government investments in healthcare infrastructure.
- Technological advancements in imaging equipment.
Challenges:
- High cost of equipment and radioisotopes.
- Limited skilled professionals.
- Stringent regulatory requirements.
Emerging Opportunities in Nuclear Imaging Market in South Africa
- Growing demand for personalized medicine.
- Development of new radiopharmaceuticals.
- Expansion into rural and underserved areas.
Growth Accelerators in the Nuclear Imaging Market in South Africa Industry
The South African nuclear imaging market's long-term growth is underpinned by continuous technological advancements, strategic partnerships to enhance infrastructure, and government initiatives to expand access to quality healthcare. These combined efforts are expected to propel the market to achieve significant growth in the coming years.
Key Players Shaping the Nuclear Imaging Market in South Africa Market
- Bracco Group
- Siemens Healthineers
- GE Healthcare
- Bayer AG
- NTP Radioisotopes SOC Ltd
- Koninklijke Philips NV
- Klydon
- Canon Medical Systems Corporation
- Curium
- Fujifilm Holdings Corporation
Notable Milestones in Nuclear Imaging Market in South Africa Sector
- November 2021: Life Healthcare Group and AXIM Group formed a joint venture to establish a cyclotron-based radiopharmacy business. This signifies a significant investment in expanding access to nuclear medicine services.
- May 2021: GE Healthcare's partnership with NSIA, Banque Côte d'Ivoire, and IFC to provide medical equipment, indirectly benefits the nuclear imaging sector by improving overall healthcare infrastructure.
In-Depth Nuclear Imaging Market in South Africa Market Outlook
The future of the South African nuclear imaging market appears promising, driven by technological advancements, increasing healthcare spending, and growing prevalence of chronic diseases. Strategic collaborations among key players will further expand market access and affordability. The market is poised for substantial growth over the forecast period (2025-2033), presenting lucrative opportunities for investors and industry participants.
Nuclear Imaging Market in South Africa Segmentation
-
1. Product
- 1.1. Equipment
-
1.2. Diagnostic Radioisotope
- 1.2.1. SPECT Radioisotopes
- 1.2.2. PET Radioisotopes
-
2. Application
-
2.1. SPECT Applications
- 2.1.1. Cardiology
- 2.1.2. Neurology
- 2.1.3. Thyroid
- 2.1.4. Other SPECT Applications
-
2.2. PET Applications
- 2.2.1. Oncology
- 2.2.2. Other PET Applications
-
2.1. SPECT Applications
Nuclear Imaging Market in South Africa Segmentation By Geography
-
1. North America
- 1.1. United States
- 1.2. Canada
- 1.3. Mexico
-
2. South America
- 2.1. Brazil
- 2.2. Argentina
- 2.3. Rest of South America
-
3. Europe
- 3.1. United Kingdom
- 3.2. Germany
- 3.3. France
- 3.4. Italy
- 3.5. Spain
- 3.6. Russia
- 3.7. Benelux
- 3.8. Nordics
- 3.9. Rest of Europe
-
4. Middle East & Africa
- 4.1. Turkey
- 4.2. Israel
- 4.3. GCC
- 4.4. North Africa
- 4.5. South Africa
- 4.6. Rest of Middle East & Africa
-
5. Asia Pacific
- 5.1. China
- 5.2. India
- 5.3. Japan
- 5.4. South Korea
- 5.5. ASEAN
- 5.6. Oceania
- 5.7. Rest of Asia Pacific
Nuclear Imaging Market in South Africa REPORT HIGHLIGHTS
| Aspects | Details |
|---|---|
| Study Period | 2019-2033 |
| Base Year | 2024 |
| Estimated Year | 2025 |
| Forecast Period | 2025-2033 |
| Historical Period | 2019-2024 |
| Growth Rate | CAGR of 2.76% from 2019-2033 |
| Segmentation |
|
Table of Contents
- 1. Introduction
- 1.1. Research Scope
- 1.2. Market Segmentation
- 1.3. Research Methodology
- 1.4. Definitions and Assumptions
- 2. Executive Summary
- 2.1. Introduction
- 3. Market Dynamics
- 3.1. Introduction
- 3.2. Market Drivers
- 3.2.1. Increasing Prevalence of Cancer and Cardiac Disorders; Technological Advancements in Nuclear Imaging
- 3.3. Market Restrains
- 3.3.1. Stringent Regulations
- 3.4. Market Trends
- 3.4.1. SPECT Radioisotopes are Expected to Witness Strong Growth Over the Forecast Period
- 4. Market Factor Analysis
- 4.1. Porters Five Forces
- 4.2. Supply/Value Chain
- 4.3. PESTEL analysis
- 4.4. Market Entropy
- 4.5. Patent/Trademark Analysis
- 5. Global Nuclear Imaging Market in South Africa Analysis, Insights and Forecast, 2019-2031
- 5.1. Market Analysis, Insights and Forecast - by Product
- 5.1.1. Equipment
- 5.1.2. Diagnostic Radioisotope
- 5.1.2.1. SPECT Radioisotopes
- 5.1.2.2. PET Radioisotopes
- 5.2. Market Analysis, Insights and Forecast - by Application
- 5.2.1. SPECT Applications
- 5.2.1.1. Cardiology
- 5.2.1.2. Neurology
- 5.2.1.3. Thyroid
- 5.2.1.4. Other SPECT Applications
- 5.2.2. PET Applications
- 5.2.2.1. Oncology
- 5.2.2.2. Other PET Applications
- 5.2.1. SPECT Applications
- 5.3. Market Analysis, Insights and Forecast - by Region
- 5.3.1. North America
- 5.3.2. South America
- 5.3.3. Europe
- 5.3.4. Middle East & Africa
- 5.3.5. Asia Pacific
- 5.1. Market Analysis, Insights and Forecast - by Product
- 6. North America Nuclear Imaging Market in South Africa Analysis, Insights and Forecast, 2019-2031
- 6.1. Market Analysis, Insights and Forecast - by Product
- 6.1.1. Equipment
- 6.1.2. Diagnostic Radioisotope
- 6.1.2.1. SPECT Radioisotopes
- 6.1.2.2. PET Radioisotopes
- 6.2. Market Analysis, Insights and Forecast - by Application
- 6.2.1. SPECT Applications
- 6.2.1.1. Cardiology
- 6.2.1.2. Neurology
- 6.2.1.3. Thyroid
- 6.2.1.4. Other SPECT Applications
- 6.2.2. PET Applications
- 6.2.2.1. Oncology
- 6.2.2.2. Other PET Applications
- 6.2.1. SPECT Applications
- 6.1. Market Analysis, Insights and Forecast - by Product
- 7. South America Nuclear Imaging Market in South Africa Analysis, Insights and Forecast, 2019-2031
- 7.1. Market Analysis, Insights and Forecast - by Product
- 7.1.1. Equipment
- 7.1.2. Diagnostic Radioisotope
- 7.1.2.1. SPECT Radioisotopes
- 7.1.2.2. PET Radioisotopes
- 7.2. Market Analysis, Insights and Forecast - by Application
- 7.2.1. SPECT Applications
- 7.2.1.1. Cardiology
- 7.2.1.2. Neurology
- 7.2.1.3. Thyroid
- 7.2.1.4. Other SPECT Applications
- 7.2.2. PET Applications
- 7.2.2.1. Oncology
- 7.2.2.2. Other PET Applications
- 7.2.1. SPECT Applications
- 7.1. Market Analysis, Insights and Forecast - by Product
- 8. Europe Nuclear Imaging Market in South Africa Analysis, Insights and Forecast, 2019-2031
- 8.1. Market Analysis, Insights and Forecast - by Product
- 8.1.1. Equipment
- 8.1.2. Diagnostic Radioisotope
- 8.1.2.1. SPECT Radioisotopes
- 8.1.2.2. PET Radioisotopes
- 8.2. Market Analysis, Insights and Forecast - by Application
- 8.2.1. SPECT Applications
- 8.2.1.1. Cardiology
- 8.2.1.2. Neurology
- 8.2.1.3. Thyroid
- 8.2.1.4. Other SPECT Applications
- 8.2.2. PET Applications
- 8.2.2.1. Oncology
- 8.2.2.2. Other PET Applications
- 8.2.1. SPECT Applications
- 8.1. Market Analysis, Insights and Forecast - by Product
- 9. Middle East & Africa Nuclear Imaging Market in South Africa Analysis, Insights and Forecast, 2019-2031
- 9.1. Market Analysis, Insights and Forecast - by Product
- 9.1.1. Equipment
- 9.1.2. Diagnostic Radioisotope
- 9.1.2.1. SPECT Radioisotopes
- 9.1.2.2. PET Radioisotopes
- 9.2. Market Analysis, Insights and Forecast - by Application
- 9.2.1. SPECT Applications
- 9.2.1.1. Cardiology
- 9.2.1.2. Neurology
- 9.2.1.3. Thyroid
- 9.2.1.4. Other SPECT Applications
- 9.2.2. PET Applications
- 9.2.2.1. Oncology
- 9.2.2.2. Other PET Applications
- 9.2.1. SPECT Applications
- 9.1. Market Analysis, Insights and Forecast - by Product
- 10. Asia Pacific Nuclear Imaging Market in South Africa Analysis, Insights and Forecast, 2019-2031
- 10.1. Market Analysis, Insights and Forecast - by Product
- 10.1.1. Equipment
- 10.1.2. Diagnostic Radioisotope
- 10.1.2.1. SPECT Radioisotopes
- 10.1.2.2. PET Radioisotopes
- 10.2. Market Analysis, Insights and Forecast - by Application
- 10.2.1. SPECT Applications
- 10.2.1.1. Cardiology
- 10.2.1.2. Neurology
- 10.2.1.3. Thyroid
- 10.2.1.4. Other SPECT Applications
- 10.2.2. PET Applications
- 10.2.2.1. Oncology
- 10.2.2.2. Other PET Applications
- 10.2.1. SPECT Applications
- 10.1. Market Analysis, Insights and Forecast - by Product
- 11. South Africa Nuclear Imaging Market in South Africa Analysis, Insights and Forecast, 2019-2031
- 12. Sudan Nuclear Imaging Market in South Africa Analysis, Insights and Forecast, 2019-2031
- 13. Uganda Nuclear Imaging Market in South Africa Analysis, Insights and Forecast, 2019-2031
- 14. Tanzania Nuclear Imaging Market in South Africa Analysis, Insights and Forecast, 2019-2031
- 15. Kenya Nuclear Imaging Market in South Africa Analysis, Insights and Forecast, 2019-2031
- 16. Rest of Africa Nuclear Imaging Market in South Africa Analysis, Insights and Forecast, 2019-2031
- 17. Competitive Analysis
- 17.1. Global Market Share Analysis 2024
- 17.2. Company Profiles
- 17.2.1 Bracco Group
- 17.2.1.1. Overview
- 17.2.1.2. Products
- 17.2.1.3. SWOT Analysis
- 17.2.1.4. Recent Developments
- 17.2.1.5. Financials (Based on Availability)
- 17.2.2 Siemens Healthineers
- 17.2.2.1. Overview
- 17.2.2.2. Products
- 17.2.2.3. SWOT Analysis
- 17.2.2.4. Recent Developments
- 17.2.2.5. Financials (Based on Availability)
- 17.2.3 GE Healthcare
- 17.2.3.1. Overview
- 17.2.3.2. Products
- 17.2.3.3. SWOT Analysis
- 17.2.3.4. Recent Developments
- 17.2.3.5. Financials (Based on Availability)
- 17.2.4 Bayer AG
- 17.2.4.1. Overview
- 17.2.4.2. Products
- 17.2.4.3. SWOT Analysis
- 17.2.4.4. Recent Developments
- 17.2.4.5. Financials (Based on Availability)
- 17.2.5 NTP Radioisotopes SOC Ltd
- 17.2.5.1. Overview
- 17.2.5.2. Products
- 17.2.5.3. SWOT Analysis
- 17.2.5.4. Recent Developments
- 17.2.5.5. Financials (Based on Availability)
- 17.2.6 Koninklijke Philips NV
- 17.2.6.1. Overview
- 17.2.6.2. Products
- 17.2.6.3. SWOT Analysis
- 17.2.6.4. Recent Developments
- 17.2.6.5. Financials (Based on Availability)
- 17.2.7 Klydon
- 17.2.7.1. Overview
- 17.2.7.2. Products
- 17.2.7.3. SWOT Analysis
- 17.2.7.4. Recent Developments
- 17.2.7.5. Financials (Based on Availability)
- 17.2.8 Canon Medical Systems Corporation
- 17.2.8.1. Overview
- 17.2.8.2. Products
- 17.2.8.3. SWOT Analysis
- 17.2.8.4. Recent Developments
- 17.2.8.5. Financials (Based on Availability)
- 17.2.9 Curium
- 17.2.9.1. Overview
- 17.2.9.2. Products
- 17.2.9.3. SWOT Analysis
- 17.2.9.4. Recent Developments
- 17.2.9.5. Financials (Based on Availability)
- 17.2.10 Fujifilm Holdings Corporation
- 17.2.10.1. Overview
- 17.2.10.2. Products
- 17.2.10.3. SWOT Analysis
- 17.2.10.4. Recent Developments
- 17.2.10.5. Financials (Based on Availability)
- 17.2.1 Bracco Group
List of Figures
- Figure 1: Global Nuclear Imaging Market in South Africa Revenue Breakdown (Million, %) by Region 2024 & 2032
- Figure 2: Africa Nuclear Imaging Market in South Africa Revenue (Million), by Country 2024 & 2032
- Figure 3: Africa Nuclear Imaging Market in South Africa Revenue Share (%), by Country 2024 & 2032
- Figure 4: North America Nuclear Imaging Market in South Africa Revenue (Million), by Product 2024 & 2032
- Figure 5: North America Nuclear Imaging Market in South Africa Revenue Share (%), by Product 2024 & 2032
- Figure 6: North America Nuclear Imaging Market in South Africa Revenue (Million), by Application 2024 & 2032
- Figure 7: North America Nuclear Imaging Market in South Africa Revenue Share (%), by Application 2024 & 2032
- Figure 8: North America Nuclear Imaging Market in South Africa Revenue (Million), by Country 2024 & 2032
- Figure 9: North America Nuclear Imaging Market in South Africa Revenue Share (%), by Country 2024 & 2032
- Figure 10: South America Nuclear Imaging Market in South Africa Revenue (Million), by Product 2024 & 2032
- Figure 11: South America Nuclear Imaging Market in South Africa Revenue Share (%), by Product 2024 & 2032
- Figure 12: South America Nuclear Imaging Market in South Africa Revenue (Million), by Application 2024 & 2032
- Figure 13: South America Nuclear Imaging Market in South Africa Revenue Share (%), by Application 2024 & 2032
- Figure 14: South America Nuclear Imaging Market in South Africa Revenue (Million), by Country 2024 & 2032
- Figure 15: South America Nuclear Imaging Market in South Africa Revenue Share (%), by Country 2024 & 2032
- Figure 16: Europe Nuclear Imaging Market in South Africa Revenue (Million), by Product 2024 & 2032
- Figure 17: Europe Nuclear Imaging Market in South Africa Revenue Share (%), by Product 2024 & 2032
- Figure 18: Europe Nuclear Imaging Market in South Africa Revenue (Million), by Application 2024 & 2032
- Figure 19: Europe Nuclear Imaging Market in South Africa Revenue Share (%), by Application 2024 & 2032
- Figure 20: Europe Nuclear Imaging Market in South Africa Revenue (Million), by Country 2024 & 2032
- Figure 21: Europe Nuclear Imaging Market in South Africa Revenue Share (%), by Country 2024 & 2032
- Figure 22: Middle East & Africa Nuclear Imaging Market in South Africa Revenue (Million), by Product 2024 & 2032
- Figure 23: Middle East & Africa Nuclear Imaging Market in South Africa Revenue Share (%), by Product 2024 & 2032
- Figure 24: Middle East & Africa Nuclear Imaging Market in South Africa Revenue (Million), by Application 2024 & 2032
- Figure 25: Middle East & Africa Nuclear Imaging Market in South Africa Revenue Share (%), by Application 2024 & 2032
- Figure 26: Middle East & Africa Nuclear Imaging Market in South Africa Revenue (Million), by Country 2024 & 2032
- Figure 27: Middle East & Africa Nuclear Imaging Market in South Africa Revenue Share (%), by Country 2024 & 2032
- Figure 28: Asia Pacific Nuclear Imaging Market in South Africa Revenue (Million), by Product 2024 & 2032
- Figure 29: Asia Pacific Nuclear Imaging Market in South Africa Revenue Share (%), by Product 2024 & 2032
- Figure 30: Asia Pacific Nuclear Imaging Market in South Africa Revenue (Million), by Application 2024 & 2032
- Figure 31: Asia Pacific Nuclear Imaging Market in South Africa Revenue Share (%), by Application 2024 & 2032
- Figure 32: Asia Pacific Nuclear Imaging Market in South Africa Revenue (Million), by Country 2024 & 2032
- Figure 33: Asia Pacific Nuclear Imaging Market in South Africa Revenue Share (%), by Country 2024 & 2032
List of Tables
- Table 1: Global Nuclear Imaging Market in South Africa Revenue Million Forecast, by Region 2019 & 2032
- Table 2: Global Nuclear Imaging Market in South Africa Revenue Million Forecast, by Product 2019 & 2032
- Table 3: Global Nuclear Imaging Market in South Africa Revenue Million Forecast, by Application 2019 & 2032
- Table 4: Global Nuclear Imaging Market in South Africa Revenue Million Forecast, by Region 2019 & 2032
- Table 5: Global Nuclear Imaging Market in South Africa Revenue Million Forecast, by Country 2019 & 2032
- Table 6: South Africa Nuclear Imaging Market in South Africa Revenue (Million) Forecast, by Application 2019 & 2032
- Table 7: Sudan Nuclear Imaging Market in South Africa Revenue (Million) Forecast, by Application 2019 & 2032
- Table 8: Uganda Nuclear Imaging Market in South Africa Revenue (Million) Forecast, by Application 2019 & 2032
- Table 9: Tanzania Nuclear Imaging Market in South Africa Revenue (Million) Forecast, by Application 2019 & 2032
- Table 10: Kenya Nuclear Imaging Market in South Africa Revenue (Million) Forecast, by Application 2019 & 2032
- Table 11: Rest of Africa Nuclear Imaging Market in South Africa Revenue (Million) Forecast, by Application 2019 & 2032
- Table 12: Global Nuclear Imaging Market in South Africa Revenue Million Forecast, by Product 2019 & 2032
- Table 13: Global Nuclear Imaging Market in South Africa Revenue Million Forecast, by Application 2019 & 2032
- Table 14: Global Nuclear Imaging Market in South Africa Revenue Million Forecast, by Country 2019 & 2032
- Table 15: United States Nuclear Imaging Market in South Africa Revenue (Million) Forecast, by Application 2019 & 2032
- Table 16: Canada Nuclear Imaging Market in South Africa Revenue (Million) Forecast, by Application 2019 & 2032
- Table 17: Mexico Nuclear Imaging Market in South Africa Revenue (Million) Forecast, by Application 2019 & 2032
- Table 18: Global Nuclear Imaging Market in South Africa Revenue Million Forecast, by Product 2019 & 2032
- Table 19: Global Nuclear Imaging Market in South Africa Revenue Million Forecast, by Application 2019 & 2032
- Table 20: Global Nuclear Imaging Market in South Africa Revenue Million Forecast, by Country 2019 & 2032
- Table 21: Brazil Nuclear Imaging Market in South Africa Revenue (Million) Forecast, by Application 2019 & 2032
- Table 22: Argentina Nuclear Imaging Market in South Africa Revenue (Million) Forecast, by Application 2019 & 2032
- Table 23: Rest of South America Nuclear Imaging Market in South Africa Revenue (Million) Forecast, by Application 2019 & 2032
- Table 24: Global Nuclear Imaging Market in South Africa Revenue Million Forecast, by Product 2019 & 2032
- Table 25: Global Nuclear Imaging Market in South Africa Revenue Million Forecast, by Application 2019 & 2032
- Table 26: Global Nuclear Imaging Market in South Africa Revenue Million Forecast, by Country 2019 & 2032
- Table 27: United Kingdom Nuclear Imaging Market in South Africa Revenue (Million) Forecast, by Application 2019 & 2032
- Table 28: Germany Nuclear Imaging Market in South Africa Revenue (Million) Forecast, by Application 2019 & 2032
- Table 29: France Nuclear Imaging Market in South Africa Revenue (Million) Forecast, by Application 2019 & 2032
- Table 30: Italy Nuclear Imaging Market in South Africa Revenue (Million) Forecast, by Application 2019 & 2032
- Table 31: Spain Nuclear Imaging Market in South Africa Revenue (Million) Forecast, by Application 2019 & 2032
- Table 32: Russia Nuclear Imaging Market in South Africa Revenue (Million) Forecast, by Application 2019 & 2032
- Table 33: Benelux Nuclear Imaging Market in South Africa Revenue (Million) Forecast, by Application 2019 & 2032
- Table 34: Nordics Nuclear Imaging Market in South Africa Revenue (Million) Forecast, by Application 2019 & 2032
- Table 35: Rest of Europe Nuclear Imaging Market in South Africa Revenue (Million) Forecast, by Application 2019 & 2032
- Table 36: Global Nuclear Imaging Market in South Africa Revenue Million Forecast, by Product 2019 & 2032
- Table 37: Global Nuclear Imaging Market in South Africa Revenue Million Forecast, by Application 2019 & 2032
- Table 38: Global Nuclear Imaging Market in South Africa Revenue Million Forecast, by Country 2019 & 2032
- Table 39: Turkey Nuclear Imaging Market in South Africa Revenue (Million) Forecast, by Application 2019 & 2032
- Table 40: Israel Nuclear Imaging Market in South Africa Revenue (Million) Forecast, by Application 2019 & 2032
- Table 41: GCC Nuclear Imaging Market in South Africa Revenue (Million) Forecast, by Application 2019 & 2032
- Table 42: North Africa Nuclear Imaging Market in South Africa Revenue (Million) Forecast, by Application 2019 & 2032
- Table 43: South Africa Nuclear Imaging Market in South Africa Revenue (Million) Forecast, by Application 2019 & 2032
- Table 44: Rest of Middle East & Africa Nuclear Imaging Market in South Africa Revenue (Million) Forecast, by Application 2019 & 2032
- Table 45: Global Nuclear Imaging Market in South Africa Revenue Million Forecast, by Product 2019 & 2032
- Table 46: Global Nuclear Imaging Market in South Africa Revenue Million Forecast, by Application 2019 & 2032
- Table 47: Global Nuclear Imaging Market in South Africa Revenue Million Forecast, by Country 2019 & 2032
- Table 48: China Nuclear Imaging Market in South Africa Revenue (Million) Forecast, by Application 2019 & 2032
- Table 49: India Nuclear Imaging Market in South Africa Revenue (Million) Forecast, by Application 2019 & 2032
- Table 50: Japan Nuclear Imaging Market in South Africa Revenue (Million) Forecast, by Application 2019 & 2032
- Table 51: South Korea Nuclear Imaging Market in South Africa Revenue (Million) Forecast, by Application 2019 & 2032
- Table 52: ASEAN Nuclear Imaging Market in South Africa Revenue (Million) Forecast, by Application 2019 & 2032
- Table 53: Oceania Nuclear Imaging Market in South Africa Revenue (Million) Forecast, by Application 2019 & 2032
- Table 54: Rest of Asia Pacific Nuclear Imaging Market in South Africa Revenue (Million) Forecast, by Application 2019 & 2032
Frequently Asked Questions
1. What is the projected Compound Annual Growth Rate (CAGR) of the Nuclear Imaging Market in South Africa?
The projected CAGR is approximately 2.76%.
2. Which companies are prominent players in the Nuclear Imaging Market in South Africa?
Key companies in the market include Bracco Group, Siemens Healthineers, GE Healthcare, Bayer AG, NTP Radioisotopes SOC Ltd, Koninklijke Philips NV, Klydon, Canon Medical Systems Corporation, Curium, Fujifilm Holdings Corporation.
3. What are the main segments of the Nuclear Imaging Market in South Africa?
The market segments include Product, Application.
4. Can you provide details about the market size?
The market size is estimated to be USD 67.45 Million as of 2022.
5. What are some drivers contributing to market growth?
Increasing Prevalence of Cancer and Cardiac Disorders; Technological Advancements in Nuclear Imaging.
6. What are the notable trends driving market growth?
SPECT Radioisotopes are Expected to Witness Strong Growth Over the Forecast Period.
7. Are there any restraints impacting market growth?
Stringent Regulations.
8. Can you provide examples of recent developments in the market?
In November 2021, Life Healthcare Group, a healthcare organization in South Africa, and the AXIM Group of Companies, Sub-Saharan Africa's medical equipment, device, and consumable distributor, have signed a head of terms agreement to form a joint venture to establish a cyclotron based radiopharmacy business across South and Southern Africa.
9. What pricing options are available for accessing the report?
Pricing options include single-user, multi-user, and enterprise licenses priced at USD 3800, USD 4500, and USD 5800 respectively.
10. Is the market size provided in terms of value or volume?
The market size is provided in terms of value, measured in Million.
11. Are there any specific market keywords associated with the report?
Yes, the market keyword associated with the report is "Nuclear Imaging Market in South Africa," which aids in identifying and referencing the specific market segment covered.
12. How do I determine which pricing option suits my needs best?
The pricing options vary based on user requirements and access needs. Individual users may opt for single-user licenses, while businesses requiring broader access may choose multi-user or enterprise licenses for cost-effective access to the report.
13. Are there any additional resources or data provided in the Nuclear Imaging Market in South Africa report?
While the report offers comprehensive insights, it's advisable to review the specific contents or supplementary materials provided to ascertain if additional resources or data are available.
14. How can I stay updated on further developments or reports in the Nuclear Imaging Market in South Africa?
To stay informed about further developments, trends, and reports in the Nuclear Imaging Market in South Africa, consider subscribing to industry newsletters, following relevant companies and organizations, or regularly checking reputable industry news sources and publications.
Methodology
Step 1 - Identification of Relevant Samples Size from Population Database


Step 2 - Approaches for Defining Global Market Size (Value, Volume* & Price*)

Note*: In applicable scenarios
Step 3 - Data Sources
Primary Research
- Web Analytics
- Survey Reports
- Research Institute
- Latest Research Reports
- Opinion Leaders
Secondary Research
- Annual Reports
- White Paper
- Latest Press Release
- Industry Association
- Paid Database
- Investor Presentations

Step 4 - Data Triangulation
Involves using different sources of information in order to increase the validity of a study
These sources are likely to be stakeholders in a program - participants, other researchers, program staff, other community members, and so on.
Then we put all data in single framework & apply various statistical tools to find out the dynamic on the market.
During the analysis stage, feedback from the stakeholder groups would be compared to determine areas of agreement as well as areas of divergence
