

Key Insights
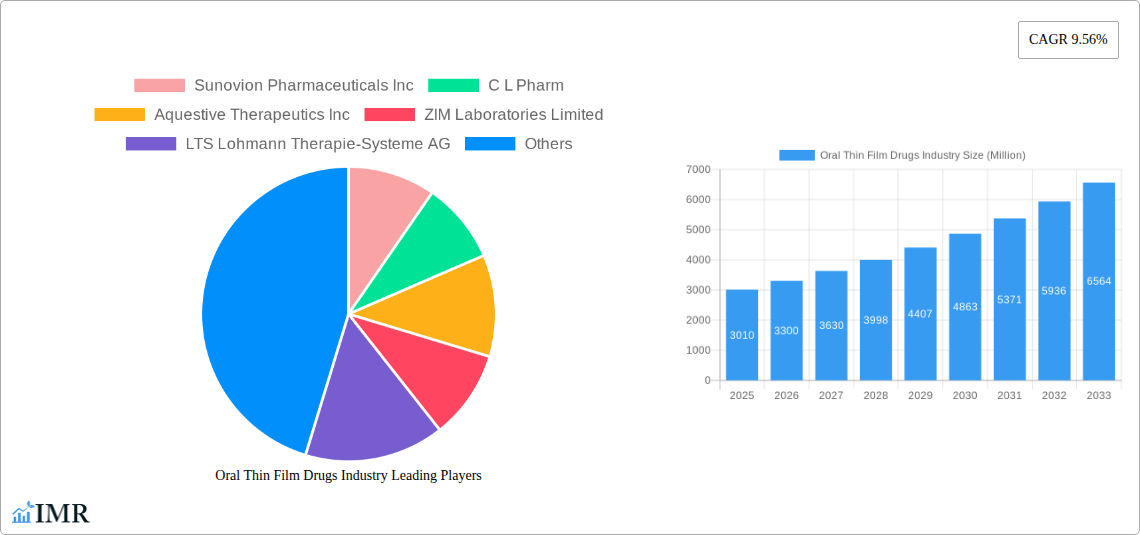
The oral thin film drug market, valued at $3.01 billion in 2025, is projected to experience robust growth, driven by a compound annual growth rate (CAGR) of 9.56% from 2025 to 2033. This expansion is fueled by several key factors. The increasing prevalence of chronic conditions like opioid dependence and nausea & vomiting, necessitating convenient and effective drug delivery, significantly boosts market demand. Furthermore, the rising preference for patient-friendly dosage forms, such as sublingual films, which offer rapid absorption and improved bioavailability compared to traditional oral tablets, is a major driver. Technological advancements in film formulation and manufacturing processes are also contributing to market growth, enabling the development of more sophisticated and effective oral thin film drugs. The market segmentation reveals a strong demand for sublingual films, particularly within hospital and retail pharmacy distribution channels. Growth is anticipated across all geographical regions, with North America and Europe likely to maintain significant market share due to established healthcare infrastructure and high drug adoption rates. However, emerging markets in Asia Pacific are expected to show substantial growth potential over the forecast period driven by increasing healthcare expenditure and rising awareness of advanced drug delivery systems. Competition within the market is intensifying, with established pharmaceutical companies alongside emerging biotech firms vying for market share through research and development of innovative products and strategic partnerships.
The sustained growth of the oral thin film drug market is also influenced by factors like increasing geriatric population requiring easier drug administration and a growing focus on personalized medicine. However, challenges such as stringent regulatory approvals, high research and development costs, and potential side effects associated with some formulations could slightly temper the overall growth. Nevertheless, the overall outlook for the oral thin film drug market remains positive, with continued innovation and expanding applications likely to drive substantial market expansion throughout the forecast period. The market is poised for substantial growth, with opportunities for players who can effectively navigate the regulatory landscape, leverage technological advancements, and cater to the evolving needs of patients and healthcare professionals.
Oral Thin Film Drugs Industry Market Report: 2019-2033
This comprehensive report provides a detailed analysis of the Oral Thin Film Drugs industry, encompassing market dynamics, growth trends, competitive landscape, and future outlook. Focusing on key segments like Opioid Dependence, Nausea and Vomiting, and Other Disease Indications, and distribution channels including Hospital Pharmacies, Retail Pharmacies, and others, this report offers invaluable insights for industry professionals, investors, and strategic decision-makers. The study period covers 2019-2033, with a base year of 2025 and a forecast period of 2025-2033. The market is segmented by product type (Sublingual Film, Other Products) and major players including Sunovion Pharmaceuticals Inc, C L Pharm, Aquestive Therapeutics Inc, ZIM Laboratories Limited, LTS Lohmann Therapie-Systeme AG, Viatris, Cure Pharmaceutical, IntelGenx Corp, and NAL Pharma. The report projects a market size of xx million units by 2033.
Oral Thin Film Drugs Industry Market Dynamics & Structure
The oral thin film drug market is characterized by moderate concentration, with several key players vying for market share. Technological innovation, particularly in formulation and delivery systems, is a primary driver, while regulatory frameworks (e.g., FDA approvals) significantly influence market entry and product lifecycle. Competitive substitutes, such as oral tablets and capsules, pose a challenge. End-user demographics, primarily patients with chronic conditions requiring convenient medication administration, are a major factor. M&A activity, though not extremely high, has played a role in shaping the landscape.
- Market Concentration: Moderately concentrated, with top 5 players holding approximately xx% market share in 2024.
- Technological Innovation: Focus on improved bioavailability, patient compliance, and ease of administration.
- Regulatory Frameworks: Stringent approval processes impact time-to-market and overall costs.
- Competitive Substitutes: Oral tablets and capsules remain major competitors.
- End-User Demographics: Growing elderly population and patients with swallowing difficulties drive demand.
- M&A Trends: A moderate number of M&A deals (xx in the last 5 years) focused on expanding product portfolios and geographic reach.
Oral Thin Film Drugs Industry Growth Trends & Insights
The oral thin film drug market experienced significant growth during the historical period (2019-2024), driven by increasing demand for convenient and patient-friendly drug delivery systems. This trend is expected to continue throughout the forecast period (2025-2033), with a projected Compound Annual Growth Rate (CAGR) of xx% during this period. Market penetration is expected to increase from xx% in 2024 to xx% by 2033, fueled by technological advancements, rising healthcare expenditure, and a growing preference for non-invasive drug administration. Technological disruptions, such as the development of novel formulations with enhanced bioavailability and stability, are further accelerating market growth. Consumer behavior shifts towards personalized medicine and self-medication are also influencing market adoption. The market size is projected to reach xx million units by 2033.

Dominant Regions, Countries, or Segments in Oral Thin Film Drugs Industry
North America currently dominates the oral thin film drug market, driven by high healthcare expenditure, robust regulatory frameworks, and a significant patient population. Within disease indications, Opioid Dependence holds a substantial market share, followed by Nausea and Vomiting and Other Disease Indications. Hospital pharmacies represent a major distribution channel, though retail pharmacies are gaining traction. Sublingual films dominate the product landscape.
- North America Dominance: Driven by high healthcare spending, strong regulatory support, and a large patient population.
- Opioid Dependence: Largest disease indication segment due to high prevalence and unmet needs.
- Hospital Pharmacies: Major distribution channel, although Retail Pharmacies are showing strong growth.
- Sublingual Films: Predominant product type due to ease of administration and rapid absorption.
- Growth Potential in Emerging Markets: Asia-Pacific and Latin America show significant growth potential due to rising healthcare infrastructure and increasing disposable income.
Oral Thin Film Drugs Industry Product Landscape
Oral thin film drug products offer several advantages, including rapid onset of action, improved patient compliance, and enhanced bioavailability compared to conventional oral dosage forms. Recent innovations have focused on developing formulations with improved taste masking, enhanced stability, and targeted drug delivery. Unique selling propositions often center on convenience, ease of administration, and patient-centric design. Technological advancements are geared toward personalized therapies and improved patient outcomes.
Key Drivers, Barriers & Challenges in Oral Thin Film Drugs Industry
Key Drivers:
- Growing demand for convenient drug delivery systems.
- Increasing prevalence of chronic diseases.
- Technological advancements leading to improved product efficacy and safety.
- Favorable regulatory environment in developed markets.
Challenges and Restraints:
- High research and development costs associated with formulating and testing these complex products.
- Stringent regulatory approval processes, potentially delaying product launches.
- Intense competition from established oral dosage forms.
- Potential supply chain disruptions impacting raw material availability and product manufacturing.
Emerging Opportunities in Oral Thin Film Drugs Industry
- Expanding into untapped markets in developing countries.
- Developing innovative formulations for new therapeutic areas.
- Exploring personalized medicine approaches to tailor drug delivery to individual patient needs.
- Leveraging digital technologies for enhanced patient engagement and medication adherence.
Growth Accelerators in the Oral Thin Film Drugs Industry
Technological breakthroughs in formulation, manufacturing, and delivery systems are key growth accelerators. Strategic partnerships between pharmaceutical companies and technology providers are also driving innovation. Expansion into new therapeutic areas and emerging markets, along with increased focus on personalized medicine, will propel long-term growth.
Key Players Shaping the Oral Thin Film Drugs Industry Market
- Sunovion Pharmaceuticals Inc
- C L Pharm
- Aquestive Therapeutics Inc
- ZIM Laboratories Limited
- LTS Lohmann Therapie-Systeme AG
- Viatris
- Cure Pharmaceutical
- IntelGenx Corp
- NAL Pharma
Notable Milestones in Oral Thin Film Drugs Industry Sector
- October 2022: IntelGenx Corp. received a U.S. FDA GDUFA for its Buprenorphine Buccal Film.
- August 2022: Aquestive Therapeutics received FDA grant for Libervant (diazepam) Buccal Film.
In-Depth Oral Thin Film Drugs Industry Market Outlook
The oral thin film drug market is poised for robust growth driven by technological innovation, expanding applications, and rising healthcare expenditure. Strategic partnerships, focused research and development, and expansion into emerging markets present significant opportunities for players in this dynamic sector. The market is expected to witness a substantial increase in market size and penetration over the next decade, creating a favorable landscape for investment and growth.
Oral Thin Film Drugs Industry Segmentation
-
1. Product
- 1.1. Sublingual Film
- 1.2. Other Products
-
2. Disease Indication
- 2.1. Opioid Dependence
- 2.2. Nausea and Vomiting
- 2.3. Other Disease Indications
-
3. Distribution Channel
- 3.1. Hospital Pharmacies
- 3.2. Retail Pharmacies
- 3.3. Other Distribution Channels
Oral Thin Film Drugs Industry Segmentation By Geography
-
1. North America
- 1.1. United States
- 1.2. Canada
- 1.3. Mexico
-
2. Europe
- 2.1. Germany
- 2.2. United Kingdom
- 2.3. France
- 2.4. Italy
- 2.5. Spain
- 2.6. Rest of Europe
-
3. Asia Pacific
- 3.1. China
- 3.2. Japan
- 3.3. India
- 3.4. Australia
- 3.5. South Korea
- 3.6. Rest of Asia Pacific
-
4. Middle East and Africa
- 4.1. GCC
- 4.2. South Africa
- 4.3. Rest of Middle East and Africa
-
5. South America
- 5.1. Brazil
- 5.2. Argentina
- 5.3. Rest of South America

Oral Thin Film Drugs Industry REPORT HIGHLIGHTS
| Aspects | Details |
|---|---|
| Study Period | 2019-2033 |
| Base Year | 2024 |
| Estimated Year | 2025 |
| Forecast Period | 2025-2033 |
| Historical Period | 2019-2024 |
| Growth Rate | CAGR of 9.56% from 2019-2033 |
| Segmentation |
|
Table of Contents
- 1. Introduction
- 1.1. Research Scope
- 1.2. Market Segmentation
- 1.3. Research Methodology
- 1.4. Definitions and Assumptions
- 2. Executive Summary
- 2.1. Introduction
- 3. Market Dynamics
- 3.1. Introduction
- 3.2. Market Drivers
- 3.2.1. Growing Burden of Target Diseases; Advantages Associated with the Thin Films
- 3.3. Market Restrains
- 3.3.1. Technical Limitations of Oral Thin Films
- 3.4. Market Trends
- 3.4.1. The Sublingual Film Segment is Expected to Witness Considerable Growth Over the Forecast Period
- 4. Market Factor Analysis
- 4.1. Porters Five Forces
- 4.2. Supply/Value Chain
- 4.3. PESTEL analysis
- 4.4. Market Entropy
- 4.5. Patent/Trademark Analysis
- 5. Global Oral Thin Film Drugs Industry Analysis, Insights and Forecast, 2019-2031
- 5.1. Market Analysis, Insights and Forecast - by Product
- 5.1.1. Sublingual Film
- 5.1.2. Other Products
- 5.2. Market Analysis, Insights and Forecast - by Disease Indication
- 5.2.1. Opioid Dependence
- 5.2.2. Nausea and Vomiting
- 5.2.3. Other Disease Indications
- 5.3. Market Analysis, Insights and Forecast - by Distribution Channel
- 5.3.1. Hospital Pharmacies
- 5.3.2. Retail Pharmacies
- 5.3.3. Other Distribution Channels
- 5.4. Market Analysis, Insights and Forecast - by Region
- 5.4.1. North America
- 5.4.2. Europe
- 5.4.3. Asia Pacific
- 5.4.4. Middle East and Africa
- 5.4.5. South America
- 5.1. Market Analysis, Insights and Forecast - by Product
- 6. North America Oral Thin Film Drugs Industry Analysis, Insights and Forecast, 2019-2031
- 6.1. Market Analysis, Insights and Forecast - by Product
- 6.1.1. Sublingual Film
- 6.1.2. Other Products
- 6.2. Market Analysis, Insights and Forecast - by Disease Indication
- 6.2.1. Opioid Dependence
- 6.2.2. Nausea and Vomiting
- 6.2.3. Other Disease Indications
- 6.3. Market Analysis, Insights and Forecast - by Distribution Channel
- 6.3.1. Hospital Pharmacies
- 6.3.2. Retail Pharmacies
- 6.3.3. Other Distribution Channels
- 6.1. Market Analysis, Insights and Forecast - by Product
- 7. Europe Oral Thin Film Drugs Industry Analysis, Insights and Forecast, 2019-2031
- 7.1. Market Analysis, Insights and Forecast - by Product
- 7.1.1. Sublingual Film
- 7.1.2. Other Products
- 7.2. Market Analysis, Insights and Forecast - by Disease Indication
- 7.2.1. Opioid Dependence
- 7.2.2. Nausea and Vomiting
- 7.2.3. Other Disease Indications
- 7.3. Market Analysis, Insights and Forecast - by Distribution Channel
- 7.3.1. Hospital Pharmacies
- 7.3.2. Retail Pharmacies
- 7.3.3. Other Distribution Channels
- 7.1. Market Analysis, Insights and Forecast - by Product
- 8. Asia Pacific Oral Thin Film Drugs Industry Analysis, Insights and Forecast, 2019-2031
- 8.1. Market Analysis, Insights and Forecast - by Product
- 8.1.1. Sublingual Film
- 8.1.2. Other Products
- 8.2. Market Analysis, Insights and Forecast - by Disease Indication
- 8.2.1. Opioid Dependence
- 8.2.2. Nausea and Vomiting
- 8.2.3. Other Disease Indications
- 8.3. Market Analysis, Insights and Forecast - by Distribution Channel
- 8.3.1. Hospital Pharmacies
- 8.3.2. Retail Pharmacies
- 8.3.3. Other Distribution Channels
- 8.1. Market Analysis, Insights and Forecast - by Product
- 9. Middle East and Africa Oral Thin Film Drugs Industry Analysis, Insights and Forecast, 2019-2031
- 9.1. Market Analysis, Insights and Forecast - by Product
- 9.1.1. Sublingual Film
- 9.1.2. Other Products
- 9.2. Market Analysis, Insights and Forecast - by Disease Indication
- 9.2.1. Opioid Dependence
- 9.2.2. Nausea and Vomiting
- 9.2.3. Other Disease Indications
- 9.3. Market Analysis, Insights and Forecast - by Distribution Channel
- 9.3.1. Hospital Pharmacies
- 9.3.2. Retail Pharmacies
- 9.3.3. Other Distribution Channels
- 9.1. Market Analysis, Insights and Forecast - by Product
- 10. South America Oral Thin Film Drugs Industry Analysis, Insights and Forecast, 2019-2031
- 10.1. Market Analysis, Insights and Forecast - by Product
- 10.1.1. Sublingual Film
- 10.1.2. Other Products
- 10.2. Market Analysis, Insights and Forecast - by Disease Indication
- 10.2.1. Opioid Dependence
- 10.2.2. Nausea and Vomiting
- 10.2.3. Other Disease Indications
- 10.3. Market Analysis, Insights and Forecast - by Distribution Channel
- 10.3.1. Hospital Pharmacies
- 10.3.2. Retail Pharmacies
- 10.3.3. Other Distribution Channels
- 10.1. Market Analysis, Insights and Forecast - by Product
- 11. North America Oral Thin Film Drugs Industry Analysis, Insights and Forecast, 2019-2031
- 11.1. Market Analysis, Insights and Forecast - By Country/Sub-region
- 11.1.1 United States
- 11.1.2 Canada
- 11.1.3 Mexico
- 12. Europe Oral Thin Film Drugs Industry Analysis, Insights and Forecast, 2019-2031
- 12.1. Market Analysis, Insights and Forecast - By Country/Sub-region
- 12.1.1 Germany
- 12.1.2 United Kingdom
- 12.1.3 France
- 12.1.4 Italy
- 12.1.5 Spain
- 12.1.6 Rest of Europe
- 13. Asia Pacific Oral Thin Film Drugs Industry Analysis, Insights and Forecast, 2019-2031
- 13.1. Market Analysis, Insights and Forecast - By Country/Sub-region
- 13.1.1 China
- 13.1.2 Japan
- 13.1.3 India
- 13.1.4 Australia
- 13.1.5 South Korea
- 13.1.6 Rest of Asia Pacific
- 14. Middle East Oral Thin Film Drugs Industry Analysis, Insights and Forecast, 2019-2031
- 14.1. Market Analysis, Insights and Forecast - By Country/Sub-region
- 14.1.1.
- 15. GCC Oral Thin Film Drugs Industry Analysis, Insights and Forecast, 2019-2031
- 15.1. Market Analysis, Insights and Forecast - By Country/Sub-region
- 15.1.1 South Africa
- 15.1.2 Rest of Middle East
- 16. South America Oral Thin Film Drugs Industry Analysis, Insights and Forecast, 2019-2031
- 16.1. Market Analysis, Insights and Forecast - By Country/Sub-region
- 16.1.1 Brazil
- 16.1.2 Argentina
- 16.1.3 Rest of South America
- 17. Competitive Analysis
- 17.1. Global Market Share Analysis 2024
- 17.2. Company Profiles
- 17.2.1 Sunovion Pharmaceuticals Inc
- 17.2.1.1. Overview
- 17.2.1.2. Products
- 17.2.1.3. SWOT Analysis
- 17.2.1.4. Recent Developments
- 17.2.1.5. Financials (Based on Availability)
- 17.2.2 C L Pharm
- 17.2.2.1. Overview
- 17.2.2.2. Products
- 17.2.2.3. SWOT Analysis
- 17.2.2.4. Recent Developments
- 17.2.2.5. Financials (Based on Availability)
- 17.2.3 Aquestive Therapeutics Inc
- 17.2.3.1. Overview
- 17.2.3.2. Products
- 17.2.3.3. SWOT Analysis
- 17.2.3.4. Recent Developments
- 17.2.3.5. Financials (Based on Availability)
- 17.2.4 ZIM Laboratories Limited
- 17.2.4.1. Overview
- 17.2.4.2. Products
- 17.2.4.3. SWOT Analysis
- 17.2.4.4. Recent Developments
- 17.2.4.5. Financials (Based on Availability)
- 17.2.5 LTS Lohmann Therapie-Systeme AG
- 17.2.5.1. Overview
- 17.2.5.2. Products
- 17.2.5.3. SWOT Analysis
- 17.2.5.4. Recent Developments
- 17.2.5.5. Financials (Based on Availability)
- 17.2.6 Viatris
- 17.2.6.1. Overview
- 17.2.6.2. Products
- 17.2.6.3. SWOT Analysis
- 17.2.6.4. Recent Developments
- 17.2.6.5. Financials (Based on Availability)
- 17.2.7 Cure Pharmaceutical
- 17.2.7.1. Overview
- 17.2.7.2. Products
- 17.2.7.3. SWOT Analysis
- 17.2.7.4. Recent Developments
- 17.2.7.5. Financials (Based on Availability)
- 17.2.8 IntelGenx Corp
- 17.2.8.1. Overview
- 17.2.8.2. Products
- 17.2.8.3. SWOT Analysis
- 17.2.8.4. Recent Developments
- 17.2.8.5. Financials (Based on Availability)
- 17.2.9 NAL Pharma
- 17.2.9.1. Overview
- 17.2.9.2. Products
- 17.2.9.3. SWOT Analysis
- 17.2.9.4. Recent Developments
- 17.2.9.5. Financials (Based on Availability)
- 17.2.1 Sunovion Pharmaceuticals Inc
List of Figures
- Figure 1: Global Oral Thin Film Drugs Industry Revenue Breakdown (Million, %) by Region 2024 & 2032
- Figure 2: Global Oral Thin Film Drugs Industry Volume Breakdown (K Unit, %) by Region 2024 & 2032
- Figure 3: North America Oral Thin Film Drugs Industry Revenue (Million), by Country 2024 & 2032
- Figure 4: North America Oral Thin Film Drugs Industry Volume (K Unit), by Country 2024 & 2032
- Figure 5: North America Oral Thin Film Drugs Industry Revenue Share (%), by Country 2024 & 2032
- Figure 6: North America Oral Thin Film Drugs Industry Volume Share (%), by Country 2024 & 2032
- Figure 7: Europe Oral Thin Film Drugs Industry Revenue (Million), by Country 2024 & 2032
- Figure 8: Europe Oral Thin Film Drugs Industry Volume (K Unit), by Country 2024 & 2032
- Figure 9: Europe Oral Thin Film Drugs Industry Revenue Share (%), by Country 2024 & 2032
- Figure 10: Europe Oral Thin Film Drugs Industry Volume Share (%), by Country 2024 & 2032
- Figure 11: Asia Pacific Oral Thin Film Drugs Industry Revenue (Million), by Country 2024 & 2032
- Figure 12: Asia Pacific Oral Thin Film Drugs Industry Volume (K Unit), by Country 2024 & 2032
- Figure 13: Asia Pacific Oral Thin Film Drugs Industry Revenue Share (%), by Country 2024 & 2032
- Figure 14: Asia Pacific Oral Thin Film Drugs Industry Volume Share (%), by Country 2024 & 2032
- Figure 15: Middle East Oral Thin Film Drugs Industry Revenue (Million), by Country 2024 & 2032
- Figure 16: Middle East Oral Thin Film Drugs Industry Volume (K Unit), by Country 2024 & 2032
- Figure 17: Middle East Oral Thin Film Drugs Industry Revenue Share (%), by Country 2024 & 2032
- Figure 18: Middle East Oral Thin Film Drugs Industry Volume Share (%), by Country 2024 & 2032
- Figure 19: GCC Oral Thin Film Drugs Industry Revenue (Million), by Country 2024 & 2032
- Figure 20: GCC Oral Thin Film Drugs Industry Volume (K Unit), by Country 2024 & 2032
- Figure 21: GCC Oral Thin Film Drugs Industry Revenue Share (%), by Country 2024 & 2032
- Figure 22: GCC Oral Thin Film Drugs Industry Volume Share (%), by Country 2024 & 2032
- Figure 23: South America Oral Thin Film Drugs Industry Revenue (Million), by Country 2024 & 2032
- Figure 24: South America Oral Thin Film Drugs Industry Volume (K Unit), by Country 2024 & 2032
- Figure 25: South America Oral Thin Film Drugs Industry Revenue Share (%), by Country 2024 & 2032
- Figure 26: South America Oral Thin Film Drugs Industry Volume Share (%), by Country 2024 & 2032
- Figure 27: North America Oral Thin Film Drugs Industry Revenue (Million), by Product 2024 & 2032
- Figure 28: North America Oral Thin Film Drugs Industry Volume (K Unit), by Product 2024 & 2032
- Figure 29: North America Oral Thin Film Drugs Industry Revenue Share (%), by Product 2024 & 2032
- Figure 30: North America Oral Thin Film Drugs Industry Volume Share (%), by Product 2024 & 2032
- Figure 31: North America Oral Thin Film Drugs Industry Revenue (Million), by Disease Indication 2024 & 2032
- Figure 32: North America Oral Thin Film Drugs Industry Volume (K Unit), by Disease Indication 2024 & 2032
- Figure 33: North America Oral Thin Film Drugs Industry Revenue Share (%), by Disease Indication 2024 & 2032
- Figure 34: North America Oral Thin Film Drugs Industry Volume Share (%), by Disease Indication 2024 & 2032
- Figure 35: North America Oral Thin Film Drugs Industry Revenue (Million), by Distribution Channel 2024 & 2032
- Figure 36: North America Oral Thin Film Drugs Industry Volume (K Unit), by Distribution Channel 2024 & 2032
- Figure 37: North America Oral Thin Film Drugs Industry Revenue Share (%), by Distribution Channel 2024 & 2032
- Figure 38: North America Oral Thin Film Drugs Industry Volume Share (%), by Distribution Channel 2024 & 2032
- Figure 39: North America Oral Thin Film Drugs Industry Revenue (Million), by Country 2024 & 2032
- Figure 40: North America Oral Thin Film Drugs Industry Volume (K Unit), by Country 2024 & 2032
- Figure 41: North America Oral Thin Film Drugs Industry Revenue Share (%), by Country 2024 & 2032
- Figure 42: North America Oral Thin Film Drugs Industry Volume Share (%), by Country 2024 & 2032
- Figure 43: Europe Oral Thin Film Drugs Industry Revenue (Million), by Product 2024 & 2032
- Figure 44: Europe Oral Thin Film Drugs Industry Volume (K Unit), by Product 2024 & 2032
- Figure 45: Europe Oral Thin Film Drugs Industry Revenue Share (%), by Product 2024 & 2032
- Figure 46: Europe Oral Thin Film Drugs Industry Volume Share (%), by Product 2024 & 2032
- Figure 47: Europe Oral Thin Film Drugs Industry Revenue (Million), by Disease Indication 2024 & 2032
- Figure 48: Europe Oral Thin Film Drugs Industry Volume (K Unit), by Disease Indication 2024 & 2032
- Figure 49: Europe Oral Thin Film Drugs Industry Revenue Share (%), by Disease Indication 2024 & 2032
- Figure 50: Europe Oral Thin Film Drugs Industry Volume Share (%), by Disease Indication 2024 & 2032
- Figure 51: Europe Oral Thin Film Drugs Industry Revenue (Million), by Distribution Channel 2024 & 2032
- Figure 52: Europe Oral Thin Film Drugs Industry Volume (K Unit), by Distribution Channel 2024 & 2032
- Figure 53: Europe Oral Thin Film Drugs Industry Revenue Share (%), by Distribution Channel 2024 & 2032
- Figure 54: Europe Oral Thin Film Drugs Industry Volume Share (%), by Distribution Channel 2024 & 2032
- Figure 55: Europe Oral Thin Film Drugs Industry Revenue (Million), by Country 2024 & 2032
- Figure 56: Europe Oral Thin Film Drugs Industry Volume (K Unit), by Country 2024 & 2032
- Figure 57: Europe Oral Thin Film Drugs Industry Revenue Share (%), by Country 2024 & 2032
- Figure 58: Europe Oral Thin Film Drugs Industry Volume Share (%), by Country 2024 & 2032
- Figure 59: Asia Pacific Oral Thin Film Drugs Industry Revenue (Million), by Product 2024 & 2032
- Figure 60: Asia Pacific Oral Thin Film Drugs Industry Volume (K Unit), by Product 2024 & 2032
- Figure 61: Asia Pacific Oral Thin Film Drugs Industry Revenue Share (%), by Product 2024 & 2032
- Figure 62: Asia Pacific Oral Thin Film Drugs Industry Volume Share (%), by Product 2024 & 2032
- Figure 63: Asia Pacific Oral Thin Film Drugs Industry Revenue (Million), by Disease Indication 2024 & 2032
- Figure 64: Asia Pacific Oral Thin Film Drugs Industry Volume (K Unit), by Disease Indication 2024 & 2032
- Figure 65: Asia Pacific Oral Thin Film Drugs Industry Revenue Share (%), by Disease Indication 2024 & 2032
- Figure 66: Asia Pacific Oral Thin Film Drugs Industry Volume Share (%), by Disease Indication 2024 & 2032
- Figure 67: Asia Pacific Oral Thin Film Drugs Industry Revenue (Million), by Distribution Channel 2024 & 2032
- Figure 68: Asia Pacific Oral Thin Film Drugs Industry Volume (K Unit), by Distribution Channel 2024 & 2032
- Figure 69: Asia Pacific Oral Thin Film Drugs Industry Revenue Share (%), by Distribution Channel 2024 & 2032
- Figure 70: Asia Pacific Oral Thin Film Drugs Industry Volume Share (%), by Distribution Channel 2024 & 2032
- Figure 71: Asia Pacific Oral Thin Film Drugs Industry Revenue (Million), by Country 2024 & 2032
- Figure 72: Asia Pacific Oral Thin Film Drugs Industry Volume (K Unit), by Country 2024 & 2032
- Figure 73: Asia Pacific Oral Thin Film Drugs Industry Revenue Share (%), by Country 2024 & 2032
- Figure 74: Asia Pacific Oral Thin Film Drugs Industry Volume Share (%), by Country 2024 & 2032
- Figure 75: Middle East and Africa Oral Thin Film Drugs Industry Revenue (Million), by Product 2024 & 2032
- Figure 76: Middle East and Africa Oral Thin Film Drugs Industry Volume (K Unit), by Product 2024 & 2032
- Figure 77: Middle East and Africa Oral Thin Film Drugs Industry Revenue Share (%), by Product 2024 & 2032
- Figure 78: Middle East and Africa Oral Thin Film Drugs Industry Volume Share (%), by Product 2024 & 2032
- Figure 79: Middle East and Africa Oral Thin Film Drugs Industry Revenue (Million), by Disease Indication 2024 & 2032
- Figure 80: Middle East and Africa Oral Thin Film Drugs Industry Volume (K Unit), by Disease Indication 2024 & 2032
- Figure 81: Middle East and Africa Oral Thin Film Drugs Industry Revenue Share (%), by Disease Indication 2024 & 2032
- Figure 82: Middle East and Africa Oral Thin Film Drugs Industry Volume Share (%), by Disease Indication 2024 & 2032
- Figure 83: Middle East and Africa Oral Thin Film Drugs Industry Revenue (Million), by Distribution Channel 2024 & 2032
- Figure 84: Middle East and Africa Oral Thin Film Drugs Industry Volume (K Unit), by Distribution Channel 2024 & 2032
- Figure 85: Middle East and Africa Oral Thin Film Drugs Industry Revenue Share (%), by Distribution Channel 2024 & 2032
- Figure 86: Middle East and Africa Oral Thin Film Drugs Industry Volume Share (%), by Distribution Channel 2024 & 2032
- Figure 87: Middle East and Africa Oral Thin Film Drugs Industry Revenue (Million), by Country 2024 & 2032
- Figure 88: Middle East and Africa Oral Thin Film Drugs Industry Volume (K Unit), by Country 2024 & 2032
- Figure 89: Middle East and Africa Oral Thin Film Drugs Industry Revenue Share (%), by Country 2024 & 2032
- Figure 90: Middle East and Africa Oral Thin Film Drugs Industry Volume Share (%), by Country 2024 & 2032
- Figure 91: South America Oral Thin Film Drugs Industry Revenue (Million), by Product 2024 & 2032
- Figure 92: South America Oral Thin Film Drugs Industry Volume (K Unit), by Product 2024 & 2032
- Figure 93: South America Oral Thin Film Drugs Industry Revenue Share (%), by Product 2024 & 2032
- Figure 94: South America Oral Thin Film Drugs Industry Volume Share (%), by Product 2024 & 2032
- Figure 95: South America Oral Thin Film Drugs Industry Revenue (Million), by Disease Indication 2024 & 2032
- Figure 96: South America Oral Thin Film Drugs Industry Volume (K Unit), by Disease Indication 2024 & 2032
- Figure 97: South America Oral Thin Film Drugs Industry Revenue Share (%), by Disease Indication 2024 & 2032
- Figure 98: South America Oral Thin Film Drugs Industry Volume Share (%), by Disease Indication 2024 & 2032
- Figure 99: South America Oral Thin Film Drugs Industry Revenue (Million), by Distribution Channel 2024 & 2032
- Figure 100: South America Oral Thin Film Drugs Industry Volume (K Unit), by Distribution Channel 2024 & 2032
- Figure 101: South America Oral Thin Film Drugs Industry Revenue Share (%), by Distribution Channel 2024 & 2032
- Figure 102: South America Oral Thin Film Drugs Industry Volume Share (%), by Distribution Channel 2024 & 2032
- Figure 103: South America Oral Thin Film Drugs Industry Revenue (Million), by Country 2024 & 2032
- Figure 104: South America Oral Thin Film Drugs Industry Volume (K Unit), by Country 2024 & 2032
- Figure 105: South America Oral Thin Film Drugs Industry Revenue Share (%), by Country 2024 & 2032
- Figure 106: South America Oral Thin Film Drugs Industry Volume Share (%), by Country 2024 & 2032
List of Tables
- Table 1: Global Oral Thin Film Drugs Industry Revenue Million Forecast, by Region 2019 & 2032
- Table 2: Global Oral Thin Film Drugs Industry Volume K Unit Forecast, by Region 2019 & 2032
- Table 3: Global Oral Thin Film Drugs Industry Revenue Million Forecast, by Product 2019 & 2032
- Table 4: Global Oral Thin Film Drugs Industry Volume K Unit Forecast, by Product 2019 & 2032
- Table 5: Global Oral Thin Film Drugs Industry Revenue Million Forecast, by Disease Indication 2019 & 2032
- Table 6: Global Oral Thin Film Drugs Industry Volume K Unit Forecast, by Disease Indication 2019 & 2032
- Table 7: Global Oral Thin Film Drugs Industry Revenue Million Forecast, by Distribution Channel 2019 & 2032
- Table 8: Global Oral Thin Film Drugs Industry Volume K Unit Forecast, by Distribution Channel 2019 & 2032
- Table 9: Global Oral Thin Film Drugs Industry Revenue Million Forecast, by Region 2019 & 2032
- Table 10: Global Oral Thin Film Drugs Industry Volume K Unit Forecast, by Region 2019 & 2032
- Table 11: Global Oral Thin Film Drugs Industry Revenue Million Forecast, by Country 2019 & 2032
- Table 12: Global Oral Thin Film Drugs Industry Volume K Unit Forecast, by Country 2019 & 2032
- Table 13: United States Oral Thin Film Drugs Industry Revenue (Million) Forecast, by Application 2019 & 2032
- Table 14: United States Oral Thin Film Drugs Industry Volume (K Unit) Forecast, by Application 2019 & 2032
- Table 15: Canada Oral Thin Film Drugs Industry Revenue (Million) Forecast, by Application 2019 & 2032
- Table 16: Canada Oral Thin Film Drugs Industry Volume (K Unit) Forecast, by Application 2019 & 2032
- Table 17: Mexico Oral Thin Film Drugs Industry Revenue (Million) Forecast, by Application 2019 & 2032
- Table 18: Mexico Oral Thin Film Drugs Industry Volume (K Unit) Forecast, by Application 2019 & 2032
- Table 19: Global Oral Thin Film Drugs Industry Revenue Million Forecast, by Country 2019 & 2032
- Table 20: Global Oral Thin Film Drugs Industry Volume K Unit Forecast, by Country 2019 & 2032
- Table 21: Germany Oral Thin Film Drugs Industry Revenue (Million) Forecast, by Application 2019 & 2032
- Table 22: Germany Oral Thin Film Drugs Industry Volume (K Unit) Forecast, by Application 2019 & 2032
- Table 23: United Kingdom Oral Thin Film Drugs Industry Revenue (Million) Forecast, by Application 2019 & 2032
- Table 24: United Kingdom Oral Thin Film Drugs Industry Volume (K Unit) Forecast, by Application 2019 & 2032
- Table 25: France Oral Thin Film Drugs Industry Revenue (Million) Forecast, by Application 2019 & 2032
- Table 26: France Oral Thin Film Drugs Industry Volume (K Unit) Forecast, by Application 2019 & 2032
- Table 27: Italy Oral Thin Film Drugs Industry Revenue (Million) Forecast, by Application 2019 & 2032
- Table 28: Italy Oral Thin Film Drugs Industry Volume (K Unit) Forecast, by Application 2019 & 2032
- Table 29: Spain Oral Thin Film Drugs Industry Revenue (Million) Forecast, by Application 2019 & 2032
- Table 30: Spain Oral Thin Film Drugs Industry Volume (K Unit) Forecast, by Application 2019 & 2032
- Table 31: Rest of Europe Oral Thin Film Drugs Industry Revenue (Million) Forecast, by Application 2019 & 2032
- Table 32: Rest of Europe Oral Thin Film Drugs Industry Volume (K Unit) Forecast, by Application 2019 & 2032
- Table 33: Global Oral Thin Film Drugs Industry Revenue Million Forecast, by Country 2019 & 2032
- Table 34: Global Oral Thin Film Drugs Industry Volume K Unit Forecast, by Country 2019 & 2032
- Table 35: China Oral Thin Film Drugs Industry Revenue (Million) Forecast, by Application 2019 & 2032
- Table 36: China Oral Thin Film Drugs Industry Volume (K Unit) Forecast, by Application 2019 & 2032
- Table 37: Japan Oral Thin Film Drugs Industry Revenue (Million) Forecast, by Application 2019 & 2032
- Table 38: Japan Oral Thin Film Drugs Industry Volume (K Unit) Forecast, by Application 2019 & 2032
- Table 39: India Oral Thin Film Drugs Industry Revenue (Million) Forecast, by Application 2019 & 2032
- Table 40: India Oral Thin Film Drugs Industry Volume (K Unit) Forecast, by Application 2019 & 2032
- Table 41: Australia Oral Thin Film Drugs Industry Revenue (Million) Forecast, by Application 2019 & 2032
- Table 42: Australia Oral Thin Film Drugs Industry Volume (K Unit) Forecast, by Application 2019 & 2032
- Table 43: South Korea Oral Thin Film Drugs Industry Revenue (Million) Forecast, by Application 2019 & 2032
- Table 44: South Korea Oral Thin Film Drugs Industry Volume (K Unit) Forecast, by Application 2019 & 2032
- Table 45: Rest of Asia Pacific Oral Thin Film Drugs Industry Revenue (Million) Forecast, by Application 2019 & 2032
- Table 46: Rest of Asia Pacific Oral Thin Film Drugs Industry Volume (K Unit) Forecast, by Application 2019 & 2032
- Table 47: Global Oral Thin Film Drugs Industry Revenue Million Forecast, by Country 2019 & 2032
- Table 48: Global Oral Thin Film Drugs Industry Volume K Unit Forecast, by Country 2019 & 2032
- Table 49: Oral Thin Film Drugs Industry Revenue (Million) Forecast, by Application 2019 & 2032
- Table 50: Oral Thin Film Drugs Industry Volume (K Unit) Forecast, by Application 2019 & 2032
- Table 51: Global Oral Thin Film Drugs Industry Revenue Million Forecast, by Country 2019 & 2032
- Table 52: Global Oral Thin Film Drugs Industry Volume K Unit Forecast, by Country 2019 & 2032
- Table 53: South Africa Oral Thin Film Drugs Industry Revenue (Million) Forecast, by Application 2019 & 2032
- Table 54: South Africa Oral Thin Film Drugs Industry Volume (K Unit) Forecast, by Application 2019 & 2032
- Table 55: Rest of Middle East Oral Thin Film Drugs Industry Revenue (Million) Forecast, by Application 2019 & 2032
- Table 56: Rest of Middle East Oral Thin Film Drugs Industry Volume (K Unit) Forecast, by Application 2019 & 2032
- Table 57: Global Oral Thin Film Drugs Industry Revenue Million Forecast, by Country 2019 & 2032
- Table 58: Global Oral Thin Film Drugs Industry Volume K Unit Forecast, by Country 2019 & 2032
- Table 59: Brazil Oral Thin Film Drugs Industry Revenue (Million) Forecast, by Application 2019 & 2032
- Table 60: Brazil Oral Thin Film Drugs Industry Volume (K Unit) Forecast, by Application 2019 & 2032
- Table 61: Argentina Oral Thin Film Drugs Industry Revenue (Million) Forecast, by Application 2019 & 2032
- Table 62: Argentina Oral Thin Film Drugs Industry Volume (K Unit) Forecast, by Application 2019 & 2032
- Table 63: Rest of South America Oral Thin Film Drugs Industry Revenue (Million) Forecast, by Application 2019 & 2032
- Table 64: Rest of South America Oral Thin Film Drugs Industry Volume (K Unit) Forecast, by Application 2019 & 2032
- Table 65: Global Oral Thin Film Drugs Industry Revenue Million Forecast, by Product 2019 & 2032
- Table 66: Global Oral Thin Film Drugs Industry Volume K Unit Forecast, by Product 2019 & 2032
- Table 67: Global Oral Thin Film Drugs Industry Revenue Million Forecast, by Disease Indication 2019 & 2032
- Table 68: Global Oral Thin Film Drugs Industry Volume K Unit Forecast, by Disease Indication 2019 & 2032
- Table 69: Global Oral Thin Film Drugs Industry Revenue Million Forecast, by Distribution Channel 2019 & 2032
- Table 70: Global Oral Thin Film Drugs Industry Volume K Unit Forecast, by Distribution Channel 2019 & 2032
- Table 71: Global Oral Thin Film Drugs Industry Revenue Million Forecast, by Country 2019 & 2032
- Table 72: Global Oral Thin Film Drugs Industry Volume K Unit Forecast, by Country 2019 & 2032
- Table 73: United States Oral Thin Film Drugs Industry Revenue (Million) Forecast, by Application 2019 & 2032
- Table 74: United States Oral Thin Film Drugs Industry Volume (K Unit) Forecast, by Application 2019 & 2032
- Table 75: Canada Oral Thin Film Drugs Industry Revenue (Million) Forecast, by Application 2019 & 2032
- Table 76: Canada Oral Thin Film Drugs Industry Volume (K Unit) Forecast, by Application 2019 & 2032
- Table 77: Mexico Oral Thin Film Drugs Industry Revenue (Million) Forecast, by Application 2019 & 2032
- Table 78: Mexico Oral Thin Film Drugs Industry Volume (K Unit) Forecast, by Application 2019 & 2032
- Table 79: Global Oral Thin Film Drugs Industry Revenue Million Forecast, by Product 2019 & 2032
- Table 80: Global Oral Thin Film Drugs Industry Volume K Unit Forecast, by Product 2019 & 2032
- Table 81: Global Oral Thin Film Drugs Industry Revenue Million Forecast, by Disease Indication 2019 & 2032
- Table 82: Global Oral Thin Film Drugs Industry Volume K Unit Forecast, by Disease Indication 2019 & 2032
- Table 83: Global Oral Thin Film Drugs Industry Revenue Million Forecast, by Distribution Channel 2019 & 2032
- Table 84: Global Oral Thin Film Drugs Industry Volume K Unit Forecast, by Distribution Channel 2019 & 2032
- Table 85: Global Oral Thin Film Drugs Industry Revenue Million Forecast, by Country 2019 & 2032
- Table 86: Global Oral Thin Film Drugs Industry Volume K Unit Forecast, by Country 2019 & 2032
- Table 87: Germany Oral Thin Film Drugs Industry Revenue (Million) Forecast, by Application 2019 & 2032
- Table 88: Germany Oral Thin Film Drugs Industry Volume (K Unit) Forecast, by Application 2019 & 2032
- Table 89: United Kingdom Oral Thin Film Drugs Industry Revenue (Million) Forecast, by Application 2019 & 2032
- Table 90: United Kingdom Oral Thin Film Drugs Industry Volume (K Unit) Forecast, by Application 2019 & 2032
- Table 91: France Oral Thin Film Drugs Industry Revenue (Million) Forecast, by Application 2019 & 2032
- Table 92: France Oral Thin Film Drugs Industry Volume (K Unit) Forecast, by Application 2019 & 2032
- Table 93: Italy Oral Thin Film Drugs Industry Revenue (Million) Forecast, by Application 2019 & 2032
- Table 94: Italy Oral Thin Film Drugs Industry Volume (K Unit) Forecast, by Application 2019 & 2032
- Table 95: Spain Oral Thin Film Drugs Industry Revenue (Million) Forecast, by Application 2019 & 2032
- Table 96: Spain Oral Thin Film Drugs Industry Volume (K Unit) Forecast, by Application 2019 & 2032
- Table 97: Rest of Europe Oral Thin Film Drugs Industry Revenue (Million) Forecast, by Application 2019 & 2032
- Table 98: Rest of Europe Oral Thin Film Drugs Industry Volume (K Unit) Forecast, by Application 2019 & 2032
- Table 99: Global Oral Thin Film Drugs Industry Revenue Million Forecast, by Product 2019 & 2032
- Table 100: Global Oral Thin Film Drugs Industry Volume K Unit Forecast, by Product 2019 & 2032
- Table 101: Global Oral Thin Film Drugs Industry Revenue Million Forecast, by Disease Indication 2019 & 2032
- Table 102: Global Oral Thin Film Drugs Industry Volume K Unit Forecast, by Disease Indication 2019 & 2032
- Table 103: Global Oral Thin Film Drugs Industry Revenue Million Forecast, by Distribution Channel 2019 & 2032
- Table 104: Global Oral Thin Film Drugs Industry Volume K Unit Forecast, by Distribution Channel 2019 & 2032
- Table 105: Global Oral Thin Film Drugs Industry Revenue Million Forecast, by Country 2019 & 2032
- Table 106: Global Oral Thin Film Drugs Industry Volume K Unit Forecast, by Country 2019 & 2032
- Table 107: China Oral Thin Film Drugs Industry Revenue (Million) Forecast, by Application 2019 & 2032
- Table 108: China Oral Thin Film Drugs Industry Volume (K Unit) Forecast, by Application 2019 & 2032
- Table 109: Japan Oral Thin Film Drugs Industry Revenue (Million) Forecast, by Application 2019 & 2032
- Table 110: Japan Oral Thin Film Drugs Industry Volume (K Unit) Forecast, by Application 2019 & 2032
- Table 111: India Oral Thin Film Drugs Industry Revenue (Million) Forecast, by Application 2019 & 2032
- Table 112: India Oral Thin Film Drugs Industry Volume (K Unit) Forecast, by Application 2019 & 2032
- Table 113: Australia Oral Thin Film Drugs Industry Revenue (Million) Forecast, by Application 2019 & 2032
- Table 114: Australia Oral Thin Film Drugs Industry Volume (K Unit) Forecast, by Application 2019 & 2032
- Table 115: South Korea Oral Thin Film Drugs Industry Revenue (Million) Forecast, by Application 2019 & 2032
- Table 116: South Korea Oral Thin Film Drugs Industry Volume (K Unit) Forecast, by Application 2019 & 2032
- Table 117: Rest of Asia Pacific Oral Thin Film Drugs Industry Revenue (Million) Forecast, by Application 2019 & 2032
- Table 118: Rest of Asia Pacific Oral Thin Film Drugs Industry Volume (K Unit) Forecast, by Application 2019 & 2032
- Table 119: Global Oral Thin Film Drugs Industry Revenue Million Forecast, by Product 2019 & 2032
- Table 120: Global Oral Thin Film Drugs Industry Volume K Unit Forecast, by Product 2019 & 2032
- Table 121: Global Oral Thin Film Drugs Industry Revenue Million Forecast, by Disease Indication 2019 & 2032
- Table 122: Global Oral Thin Film Drugs Industry Volume K Unit Forecast, by Disease Indication 2019 & 2032
- Table 123: Global Oral Thin Film Drugs Industry Revenue Million Forecast, by Distribution Channel 2019 & 2032
- Table 124: Global Oral Thin Film Drugs Industry Volume K Unit Forecast, by Distribution Channel 2019 & 2032
- Table 125: Global Oral Thin Film Drugs Industry Revenue Million Forecast, by Country 2019 & 2032
- Table 126: Global Oral Thin Film Drugs Industry Volume K Unit Forecast, by Country 2019 & 2032
- Table 127: GCC Oral Thin Film Drugs Industry Revenue (Million) Forecast, by Application 2019 & 2032
- Table 128: GCC Oral Thin Film Drugs Industry Volume (K Unit) Forecast, by Application 2019 & 2032
- Table 129: South Africa Oral Thin Film Drugs Industry Revenue (Million) Forecast, by Application 2019 & 2032
- Table 130: South Africa Oral Thin Film Drugs Industry Volume (K Unit) Forecast, by Application 2019 & 2032
- Table 131: Rest of Middle East and Africa Oral Thin Film Drugs Industry Revenue (Million) Forecast, by Application 2019 & 2032
- Table 132: Rest of Middle East and Africa Oral Thin Film Drugs Industry Volume (K Unit) Forecast, by Application 2019 & 2032
- Table 133: Global Oral Thin Film Drugs Industry Revenue Million Forecast, by Product 2019 & 2032
- Table 134: Global Oral Thin Film Drugs Industry Volume K Unit Forecast, by Product 2019 & 2032
- Table 135: Global Oral Thin Film Drugs Industry Revenue Million Forecast, by Disease Indication 2019 & 2032
- Table 136: Global Oral Thin Film Drugs Industry Volume K Unit Forecast, by Disease Indication 2019 & 2032
- Table 137: Global Oral Thin Film Drugs Industry Revenue Million Forecast, by Distribution Channel 2019 & 2032
- Table 138: Global Oral Thin Film Drugs Industry Volume K Unit Forecast, by Distribution Channel 2019 & 2032
- Table 139: Global Oral Thin Film Drugs Industry Revenue Million Forecast, by Country 2019 & 2032
- Table 140: Global Oral Thin Film Drugs Industry Volume K Unit Forecast, by Country 2019 & 2032
- Table 141: Brazil Oral Thin Film Drugs Industry Revenue (Million) Forecast, by Application 2019 & 2032
- Table 142: Brazil Oral Thin Film Drugs Industry Volume (K Unit) Forecast, by Application 2019 & 2032
- Table 143: Argentina Oral Thin Film Drugs Industry Revenue (Million) Forecast, by Application 2019 & 2032
- Table 144: Argentina Oral Thin Film Drugs Industry Volume (K Unit) Forecast, by Application 2019 & 2032
- Table 145: Rest of South America Oral Thin Film Drugs Industry Revenue (Million) Forecast, by Application 2019 & 2032
- Table 146: Rest of South America Oral Thin Film Drugs Industry Volume (K Unit) Forecast, by Application 2019 & 2032
Frequently Asked Questions
1. What is the projected Compound Annual Growth Rate (CAGR) of the Oral Thin Film Drugs Industry?
The projected CAGR is approximately 9.56%.
2. Which companies are prominent players in the Oral Thin Film Drugs Industry?
Key companies in the market include Sunovion Pharmaceuticals Inc, C L Pharm, Aquestive Therapeutics Inc, ZIM Laboratories Limited, LTS Lohmann Therapie-Systeme AG, Viatris, Cure Pharmaceutical, IntelGenx Corp, NAL Pharma.
3. What are the main segments of the Oral Thin Film Drugs Industry?
The market segments include Product, Disease Indication, Distribution Channel.
4. Can you provide details about the market size?
The market size is estimated to be USD 3.01 Million as of 2022.
5. What are some drivers contributing to market growth?
Growing Burden of Target Diseases; Advantages Associated with the Thin Films.
6. What are the notable trends driving market growth?
The Sublingual Film Segment is Expected to Witness Considerable Growth Over the Forecast Period.
7. Are there any restraints impacting market growth?
Technical Limitations of Oral Thin Films.
8. Can you provide examples of recent developments in the market?
In October 2022, IntelGenxCorp. announced that it had received a U.S. FDA Generic Drug User Fee Act ("GDUFA") for its Buprenorphine Buccal Film. Buprenorphine Buccal Film is a generic version of Belbuca, an opioid used to manage severe continuous pain and can be used for long-term treatment.
9. What pricing options are available for accessing the report?
Pricing options include single-user, multi-user, and enterprise licenses priced at USD 4750, USD 5250, and USD 8750 respectively.
10. Is the market size provided in terms of value or volume?
The market size is provided in terms of value, measured in Million and volume, measured in K Unit.
11. Are there any specific market keywords associated with the report?
Yes, the market keyword associated with the report is "Oral Thin Film Drugs Industry," which aids in identifying and referencing the specific market segment covered.
12. How do I determine which pricing option suits my needs best?
The pricing options vary based on user requirements and access needs. Individual users may opt for single-user licenses, while businesses requiring broader access may choose multi-user or enterprise licenses for cost-effective access to the report.
13. Are there any additional resources or data provided in the Oral Thin Film Drugs Industry report?
While the report offers comprehensive insights, it's advisable to review the specific contents or supplementary materials provided to ascertain if additional resources or data are available.
14. How can I stay updated on further developments or reports in the Oral Thin Film Drugs Industry?
To stay informed about further developments, trends, and reports in the Oral Thin Film Drugs Industry, consider subscribing to industry newsletters, following relevant companies and organizations, or regularly checking reputable industry news sources and publications.
Methodology
Step 1 - Identification of Relevant Samples Size from Population Database


Step 2 - Approaches for Defining Global Market Size (Value, Volume* & Price*)

Note*: In applicable scenarios
Step 3 - Data Sources
Primary Research
- Web Analytics
- Survey Reports
- Research Institute
- Latest Research Reports
- Opinion Leaders
Secondary Research
- Annual Reports
- White Paper
- Latest Press Release
- Industry Association
- Paid Database
- Investor Presentations

Step 4 - Data Triangulation
Involves using different sources of information in order to increase the validity of a study
These sources are likely to be stakeholders in a program - participants, other researchers, program staff, other community members, and so on.
Then we put all data in single framework & apply various statistical tools to find out the dynamic on the market.
During the analysis stage, feedback from the stakeholder groups would be compared to determine areas of agreement as well as areas of divergence
