

Key Insights
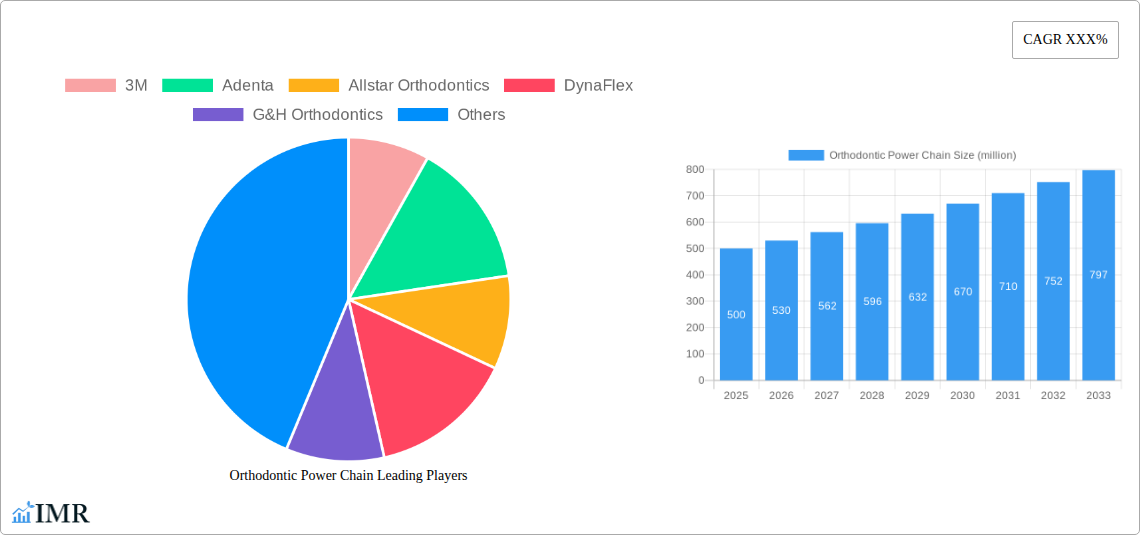
The global orthodontic power chain market is experiencing robust growth, driven by the increasing prevalence of malocclusion and the rising demand for aesthetically pleasing orthodontic treatments. The market's expansion is further fueled by advancements in power chain materials, leading to improved comfort and treatment efficacy. Technological innovations, such as the development of self-ligating brackets and improved power chain designs that require fewer adjustments, contribute to shorter treatment times and increased patient satisfaction. This, in turn, drives market demand as orthodontists and patients alike benefit from these efficiency improvements. We estimate the market size in 2025 to be approximately $500 million, based on industry reports and considering the growth trajectory of related orthodontic products. A compound annual growth rate (CAGR) of 6% is projected for the period 2025-2033, indicating a significant market expansion during this forecast horizon. This growth is anticipated despite some restraints like the high cost of orthodontic treatment and the availability of alternative treatment options.
However, several factors are expected to positively influence the market's continued growth. The increasing affordability of orthodontic treatments due to expanding insurance coverage and financing options will make treatment accessible to a broader patient population. Furthermore, the growing awareness of the aesthetic and functional benefits of straight teeth is driving demand, particularly among young adults and millennials. The presence of established players like 3M, Ormco, and others, along with several emerging players, signifies a competitive landscape that fosters innovation and further market expansion. Market segmentation based on material type (e.g., nickel-titanium, stainless steel), bracket type, and geographic region will provide a deeper understanding of growth patterns within the sector. The market’s growth will be further shaped by the adoption of new technologies and materials in orthodontic treatment.
Orthodontic Power Chain Market Report: 2019-2033
This comprehensive report provides a detailed analysis of the global Orthodontic Power Chain market, offering invaluable insights for industry professionals, investors, and strategic decision-makers. The study period covers 2019-2033, with a base year of 2025 and a forecast period of 2025-2033. The report segments the market by key players, including 3M, Adenta, Allstar Orthodontics, DynaFlex, G&H Orthodontics, LEONE, Jiscop Co., Ltd, and Ormco, and analyzes various industry developments impacting market growth.
Orthodontic Power Chain Market Dynamics & Structure
This section delves into the competitive landscape, technological advancements, and regulatory influences shaping the Orthodontic Power Chain market. The analysis considers market concentration, identifying the leading players and their respective market share percentages. For example, in 2025, 3M held an estimated xx% market share, while Ormco held xx%. We also analyze M&A activity within the industry, with an estimated xx million USD worth of deals in the historical period (2019-2024).
- Market Concentration: Highly fragmented, with top 5 players holding a combined xx% market share in 2025.
- Technological Innovation: Focus on improved materials (e.g., biocompatible polymers) and customizable designs driving innovation.
- Regulatory Landscape: Stringent regulatory approvals impacting product launches and market entry.
- Competitive Substitutes: Traditional orthodontic techniques and other power chain alternatives present competitive pressure.
- End-User Demographics: Growing prevalence of malocclusion and increasing demand for aesthetic orthodontic treatments are key drivers.
- M&A Trends: Strategic acquisitions focusing on expanding product portfolios and market reach.
Orthodontic Power Chain Growth Trends & Insights
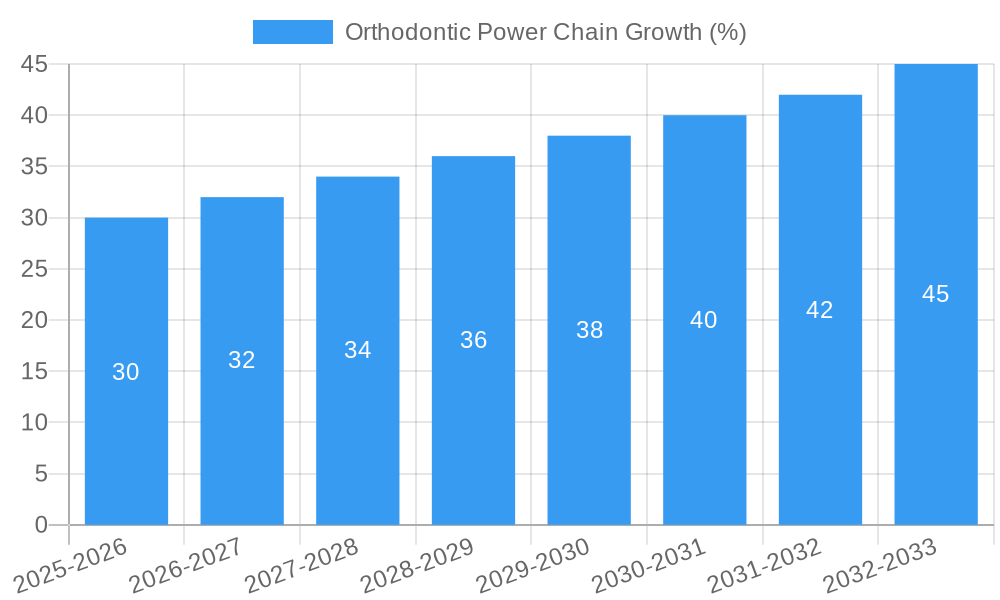
This section utilizes quantitative and qualitative data to illustrate the evolution of the Orthodontic Power Chain market. The market experienced a CAGR of xx% during the historical period (2019-2024), reaching an estimated market size of xx million units in 2025. This growth is attributed to rising consumer awareness, technological advancements, and increasing affordability of orthodontic treatments. We project a CAGR of xx% during the forecast period (2025-2033), with the market size potentially reaching xx million units by 2033. Market penetration rates in key regions are also analyzed, highlighting variations in adoption across different demographics. The report further details the influence of technological disruptions, such as the introduction of 3D-printed power chains, and how shifts in consumer preferences towards minimally invasive procedures are influencing market growth.
Dominant Regions, Countries, or Segments in Orthodontic Power Chain
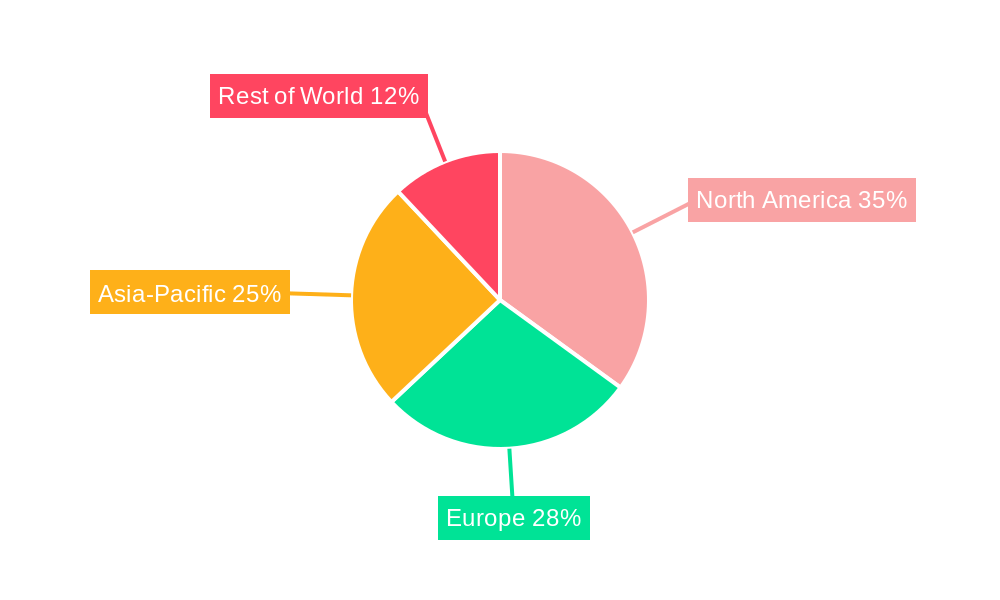
North America currently dominates the global Orthodontic Power Chain market, holding an estimated xx% market share in 2025, driven by high per capita healthcare spending and advanced healthcare infrastructure. Asia-Pacific is projected to witness the fastest growth during the forecast period, fueled by a burgeoning middle class and rising awareness of orthodontic treatments.
- North America: High adoption rates, advanced healthcare infrastructure, and high disposable incomes are key drivers.
- Europe: Moderate growth driven by government healthcare initiatives and an aging population.
- Asia-Pacific: Fastest-growing region, driven by rising disposable incomes and increasing awareness.
- Rest of the World: Steady growth driven by expanding healthcare infrastructure and increasing demand.
Orthodontic Power Chain Product Landscape
The Orthodontic Power Chain market offers a range of products varying in material composition, design, and functionalities. Innovations focus on enhanced strength, flexibility, and biocompatibility to improve patient comfort and treatment outcomes. Product differentiation is based on unique selling propositions, such as specialized coatings for reduced friction or customized designs for specific orthodontic cases. The advancements in material science and manufacturing techniques allow for the production of more durable, comfortable, and aesthetically pleasing power chains.
Key Drivers, Barriers & Challenges in Orthodontic Power Chain
Key Drivers:
- Increasing prevalence of malocclusion globally.
- Rising consumer awareness and demand for aesthetic orthodontic treatments.
- Technological advancements leading to improved product features and functionalities.
- Favorable regulatory environments in key markets.
Challenges & Restraints:
- High initial investment costs for orthodontic treatment can limit market access for certain demographics.
- Stringent regulatory approvals and compliance requirements can hinder product launches.
- Intense competition among established players and emerging market entrants.
- Supply chain disruptions and material price fluctuations can impact profitability.
Emerging Opportunities in Orthodontic Power Chain
- Expanding into untapped markets, particularly in developing economies.
- Development of innovative applications, such as self-ligating power chains.
- Customization of power chains to cater to individual patient needs.
- Leveraging digital technologies to improve treatment planning and monitoring.
Growth Accelerators in the Orthodontic Power Chain Industry
Long-term growth will be propelled by technological innovations leading to more efficient and comfortable treatment options, the emergence of strategic partnerships between manufacturers and orthodontic clinics, and continued market expansion into developing countries with growing populations and increasing disposable incomes. The development of novel biocompatible materials and the integration of smart technologies will further contribute to the market's growth trajectory.
Key Players Shaping the Orthodontic Power Chain Market
Notable Milestones in Orthodontic Power Chain Sector
- 2020: 3M launched a new line of biocompatible power chains.
- 2022: Ormco acquired a smaller competitor, expanding its product portfolio.
- 2023: Several key players invested heavily in R&D to improve power chain durability and aesthetics. (Further details of specific milestones can be added here)
In-Depth Orthodontic Power Chain Market Outlook
The Orthodontic Power Chain market is poised for sustained growth, driven by technological advancements, increased consumer demand, and favorable regulatory environments. Strategic partnerships and expansion into new markets will further propel market expansion. The forecast period promises significant opportunities for market players who can capitalize on these trends by investing in research and development, building strong distribution networks, and offering innovative and patient-centric solutions.
Orthodontic Power Chain Segmentation
-
1. Application
- 1.1. Misalignments
- 1.2. Malocclusions
- 1.3. Crooked Teeth
-
2. Type
- 2.1. Short Type
- 2.2. Medium Type
- 2.3. Long Type
Orthodontic Power Chain Segmentation By Geography
-
1. North America
- 1.1. United States
- 1.2. Canada
- 1.3. Mexico
-
2. South America
- 2.1. Brazil
- 2.2. Argentina
- 2.3. Rest of South America
-
3. Europe
- 3.1. United Kingdom
- 3.2. Germany
- 3.3. France
- 3.4. Italy
- 3.5. Spain
- 3.6. Russia
- 3.7. Benelux
- 3.8. Nordics
- 3.9. Rest of Europe
-
4. Middle East & Africa
- 4.1. Turkey
- 4.2. Israel
- 4.3. GCC
- 4.4. North Africa
- 4.5. South Africa
- 4.6. Rest of Middle East & Africa
-
5. Asia Pacific
- 5.1. China
- 5.2. India
- 5.3. Japan
- 5.4. South Korea
- 5.5. ASEAN
- 5.6. Oceania
- 5.7. Rest of Asia Pacific
Orthodontic Power Chain REPORT HIGHLIGHTS
| Aspects | Details |
|---|---|
| Study Period | 2019-2033 |
| Base Year | 2024 |
| Estimated Year | 2025 |
| Forecast Period | 2025-2033 |
| Historical Period | 2019-2024 |
| Growth Rate | CAGR of XXX% from 2019-2033 |
| Segmentation |
|
Table of Contents
- 1. Introduction
- 1.1. Research Scope
- 1.2. Market Segmentation
- 1.3. Research Methodology
- 1.4. Definitions and Assumptions
- 2. Executive Summary
- 2.1. Introduction
- 3. Market Dynamics
- 3.1. Introduction
- 3.2. Market Drivers
- 3.3. Market Restrains
- 3.4. Market Trends
- 4. Market Factor Analysis
- 4.1. Porters Five Forces
- 4.2. Supply/Value Chain
- 4.3. PESTEL analysis
- 4.4. Market Entropy
- 4.5. Patent/Trademark Analysis
- 5. Global Orthodontic Power Chain Analysis, Insights and Forecast, 2019-2031
- 5.1. Market Analysis, Insights and Forecast - by Application
- 5.1.1. Misalignments
- 5.1.2. Malocclusions
- 5.1.3. Crooked Teeth
- 5.2. Market Analysis, Insights and Forecast - by Type
- 5.2.1. Short Type
- 5.2.2. Medium Type
- 5.2.3. Long Type
- 5.3. Market Analysis, Insights and Forecast - by Region
- 5.3.1. North America
- 5.3.2. South America
- 5.3.3. Europe
- 5.3.4. Middle East & Africa
- 5.3.5. Asia Pacific
- 5.1. Market Analysis, Insights and Forecast - by Application
- 6. North America Orthodontic Power Chain Analysis, Insights and Forecast, 2019-2031
- 6.1. Market Analysis, Insights and Forecast - by Application
- 6.1.1. Misalignments
- 6.1.2. Malocclusions
- 6.1.3. Crooked Teeth
- 6.2. Market Analysis, Insights and Forecast - by Type
- 6.2.1. Short Type
- 6.2.2. Medium Type
- 6.2.3. Long Type
- 6.1. Market Analysis, Insights and Forecast - by Application
- 7. South America Orthodontic Power Chain Analysis, Insights and Forecast, 2019-2031
- 7.1. Market Analysis, Insights and Forecast - by Application
- 7.1.1. Misalignments
- 7.1.2. Malocclusions
- 7.1.3. Crooked Teeth
- 7.2. Market Analysis, Insights and Forecast - by Type
- 7.2.1. Short Type
- 7.2.2. Medium Type
- 7.2.3. Long Type
- 7.1. Market Analysis, Insights and Forecast - by Application
- 8. Europe Orthodontic Power Chain Analysis, Insights and Forecast, 2019-2031
- 8.1. Market Analysis, Insights and Forecast - by Application
- 8.1.1. Misalignments
- 8.1.2. Malocclusions
- 8.1.3. Crooked Teeth
- 8.2. Market Analysis, Insights and Forecast - by Type
- 8.2.1. Short Type
- 8.2.2. Medium Type
- 8.2.3. Long Type
- 8.1. Market Analysis, Insights and Forecast - by Application
- 9. Middle East & Africa Orthodontic Power Chain Analysis, Insights and Forecast, 2019-2031
- 9.1. Market Analysis, Insights and Forecast - by Application
- 9.1.1. Misalignments
- 9.1.2. Malocclusions
- 9.1.3. Crooked Teeth
- 9.2. Market Analysis, Insights and Forecast - by Type
- 9.2.1. Short Type
- 9.2.2. Medium Type
- 9.2.3. Long Type
- 9.1. Market Analysis, Insights and Forecast - by Application
- 10. Asia Pacific Orthodontic Power Chain Analysis, Insights and Forecast, 2019-2031
- 10.1. Market Analysis, Insights and Forecast - by Application
- 10.1.1. Misalignments
- 10.1.2. Malocclusions
- 10.1.3. Crooked Teeth
- 10.2. Market Analysis, Insights and Forecast - by Type
- 10.2.1. Short Type
- 10.2.2. Medium Type
- 10.2.3. Long Type
- 10.1. Market Analysis, Insights and Forecast - by Application
- 11. Competitive Analysis
- 11.1. Global Market Share Analysis 2024
- 11.2. Company Profiles
- 11.2.1 3M
- 11.2.1.1. Overview
- 11.2.1.2. Products
- 11.2.1.3. SWOT Analysis
- 11.2.1.4. Recent Developments
- 11.2.1.5. Financials (Based on Availability)
- 11.2.2 Adenta
- 11.2.2.1. Overview
- 11.2.2.2. Products
- 11.2.2.3. SWOT Analysis
- 11.2.2.4. Recent Developments
- 11.2.2.5. Financials (Based on Availability)
- 11.2.3 Allstar Orthodontics
- 11.2.3.1. Overview
- 11.2.3.2. Products
- 11.2.3.3. SWOT Analysis
- 11.2.3.4. Recent Developments
- 11.2.3.5. Financials (Based on Availability)
- 11.2.4 DynaFlex
- 11.2.4.1. Overview
- 11.2.4.2. Products
- 11.2.4.3. SWOT Analysis
- 11.2.4.4. Recent Developments
- 11.2.4.5. Financials (Based on Availability)
- 11.2.5 G&H Orthodontics
- 11.2.5.1. Overview
- 11.2.5.2. Products
- 11.2.5.3. SWOT Analysis
- 11.2.5.4. Recent Developments
- 11.2.5.5. Financials (Based on Availability)
- 11.2.6 LEONE
- 11.2.6.1. Overview
- 11.2.6.2. Products
- 11.2.6.3. SWOT Analysis
- 11.2.6.4. Recent Developments
- 11.2.6.5. Financials (Based on Availability)
- 11.2.7 Jiscop Co. Ltd
- 11.2.7.1. Overview
- 11.2.7.2. Products
- 11.2.7.3. SWOT Analysis
- 11.2.7.4. Recent Developments
- 11.2.7.5. Financials (Based on Availability)
- 11.2.8 Ormco
- 11.2.8.1. Overview
- 11.2.8.2. Products
- 11.2.8.3. SWOT Analysis
- 11.2.8.4. Recent Developments
- 11.2.8.5. Financials (Based on Availability)
- 11.2.1 3M
List of Figures
- Figure 1: Global Orthodontic Power Chain Revenue Breakdown (million, %) by Region 2024 & 2032
- Figure 2: Global Orthodontic Power Chain Volume Breakdown (K, %) by Region 2024 & 2032
- Figure 3: North America Orthodontic Power Chain Revenue (million), by Application 2024 & 2032
- Figure 4: North America Orthodontic Power Chain Volume (K), by Application 2024 & 2032
- Figure 5: North America Orthodontic Power Chain Revenue Share (%), by Application 2024 & 2032
- Figure 6: North America Orthodontic Power Chain Volume Share (%), by Application 2024 & 2032
- Figure 7: North America Orthodontic Power Chain Revenue (million), by Type 2024 & 2032
- Figure 8: North America Orthodontic Power Chain Volume (K), by Type 2024 & 2032
- Figure 9: North America Orthodontic Power Chain Revenue Share (%), by Type 2024 & 2032
- Figure 10: North America Orthodontic Power Chain Volume Share (%), by Type 2024 & 2032
- Figure 11: North America Orthodontic Power Chain Revenue (million), by Country 2024 & 2032
- Figure 12: North America Orthodontic Power Chain Volume (K), by Country 2024 & 2032
- Figure 13: North America Orthodontic Power Chain Revenue Share (%), by Country 2024 & 2032
- Figure 14: North America Orthodontic Power Chain Volume Share (%), by Country 2024 & 2032
- Figure 15: South America Orthodontic Power Chain Revenue (million), by Application 2024 & 2032
- Figure 16: South America Orthodontic Power Chain Volume (K), by Application 2024 & 2032
- Figure 17: South America Orthodontic Power Chain Revenue Share (%), by Application 2024 & 2032
- Figure 18: South America Orthodontic Power Chain Volume Share (%), by Application 2024 & 2032
- Figure 19: South America Orthodontic Power Chain Revenue (million), by Type 2024 & 2032
- Figure 20: South America Orthodontic Power Chain Volume (K), by Type 2024 & 2032
- Figure 21: South America Orthodontic Power Chain Revenue Share (%), by Type 2024 & 2032
- Figure 22: South America Orthodontic Power Chain Volume Share (%), by Type 2024 & 2032
- Figure 23: South America Orthodontic Power Chain Revenue (million), by Country 2024 & 2032
- Figure 24: South America Orthodontic Power Chain Volume (K), by Country 2024 & 2032
- Figure 25: South America Orthodontic Power Chain Revenue Share (%), by Country 2024 & 2032
- Figure 26: South America Orthodontic Power Chain Volume Share (%), by Country 2024 & 2032
- Figure 27: Europe Orthodontic Power Chain Revenue (million), by Application 2024 & 2032
- Figure 28: Europe Orthodontic Power Chain Volume (K), by Application 2024 & 2032
- Figure 29: Europe Orthodontic Power Chain Revenue Share (%), by Application 2024 & 2032
- Figure 30: Europe Orthodontic Power Chain Volume Share (%), by Application 2024 & 2032
- Figure 31: Europe Orthodontic Power Chain Revenue (million), by Type 2024 & 2032
- Figure 32: Europe Orthodontic Power Chain Volume (K), by Type 2024 & 2032
- Figure 33: Europe Orthodontic Power Chain Revenue Share (%), by Type 2024 & 2032
- Figure 34: Europe Orthodontic Power Chain Volume Share (%), by Type 2024 & 2032
- Figure 35: Europe Orthodontic Power Chain Revenue (million), by Country 2024 & 2032
- Figure 36: Europe Orthodontic Power Chain Volume (K), by Country 2024 & 2032
- Figure 37: Europe Orthodontic Power Chain Revenue Share (%), by Country 2024 & 2032
- Figure 38: Europe Orthodontic Power Chain Volume Share (%), by Country 2024 & 2032
- Figure 39: Middle East & Africa Orthodontic Power Chain Revenue (million), by Application 2024 & 2032
- Figure 40: Middle East & Africa Orthodontic Power Chain Volume (K), by Application 2024 & 2032
- Figure 41: Middle East & Africa Orthodontic Power Chain Revenue Share (%), by Application 2024 & 2032
- Figure 42: Middle East & Africa Orthodontic Power Chain Volume Share (%), by Application 2024 & 2032
- Figure 43: Middle East & Africa Orthodontic Power Chain Revenue (million), by Type 2024 & 2032
- Figure 44: Middle East & Africa Orthodontic Power Chain Volume (K), by Type 2024 & 2032
- Figure 45: Middle East & Africa Orthodontic Power Chain Revenue Share (%), by Type 2024 & 2032
- Figure 46: Middle East & Africa Orthodontic Power Chain Volume Share (%), by Type 2024 & 2032
- Figure 47: Middle East & Africa Orthodontic Power Chain Revenue (million), by Country 2024 & 2032
- Figure 48: Middle East & Africa Orthodontic Power Chain Volume (K), by Country 2024 & 2032
- Figure 49: Middle East & Africa Orthodontic Power Chain Revenue Share (%), by Country 2024 & 2032
- Figure 50: Middle East & Africa Orthodontic Power Chain Volume Share (%), by Country 2024 & 2032
- Figure 51: Asia Pacific Orthodontic Power Chain Revenue (million), by Application 2024 & 2032
- Figure 52: Asia Pacific Orthodontic Power Chain Volume (K), by Application 2024 & 2032
- Figure 53: Asia Pacific Orthodontic Power Chain Revenue Share (%), by Application 2024 & 2032
- Figure 54: Asia Pacific Orthodontic Power Chain Volume Share (%), by Application 2024 & 2032
- Figure 55: Asia Pacific Orthodontic Power Chain Revenue (million), by Type 2024 & 2032
- Figure 56: Asia Pacific Orthodontic Power Chain Volume (K), by Type 2024 & 2032
- Figure 57: Asia Pacific Orthodontic Power Chain Revenue Share (%), by Type 2024 & 2032
- Figure 58: Asia Pacific Orthodontic Power Chain Volume Share (%), by Type 2024 & 2032
- Figure 59: Asia Pacific Orthodontic Power Chain Revenue (million), by Country 2024 & 2032
- Figure 60: Asia Pacific Orthodontic Power Chain Volume (K), by Country 2024 & 2032
- Figure 61: Asia Pacific Orthodontic Power Chain Revenue Share (%), by Country 2024 & 2032
- Figure 62: Asia Pacific Orthodontic Power Chain Volume Share (%), by Country 2024 & 2032
List of Tables
- Table 1: Global Orthodontic Power Chain Revenue million Forecast, by Region 2019 & 2032
- Table 2: Global Orthodontic Power Chain Volume K Forecast, by Region 2019 & 2032
- Table 3: Global Orthodontic Power Chain Revenue million Forecast, by Application 2019 & 2032
- Table 4: Global Orthodontic Power Chain Volume K Forecast, by Application 2019 & 2032
- Table 5: Global Orthodontic Power Chain Revenue million Forecast, by Type 2019 & 2032
- Table 6: Global Orthodontic Power Chain Volume K Forecast, by Type 2019 & 2032
- Table 7: Global Orthodontic Power Chain Revenue million Forecast, by Region 2019 & 2032
- Table 8: Global Orthodontic Power Chain Volume K Forecast, by Region 2019 & 2032
- Table 9: Global Orthodontic Power Chain Revenue million Forecast, by Application 2019 & 2032
- Table 10: Global Orthodontic Power Chain Volume K Forecast, by Application 2019 & 2032
- Table 11: Global Orthodontic Power Chain Revenue million Forecast, by Type 2019 & 2032
- Table 12: Global Orthodontic Power Chain Volume K Forecast, by Type 2019 & 2032
- Table 13: Global Orthodontic Power Chain Revenue million Forecast, by Country 2019 & 2032
- Table 14: Global Orthodontic Power Chain Volume K Forecast, by Country 2019 & 2032
- Table 15: United States Orthodontic Power Chain Revenue (million) Forecast, by Application 2019 & 2032
- Table 16: United States Orthodontic Power Chain Volume (K) Forecast, by Application 2019 & 2032
- Table 17: Canada Orthodontic Power Chain Revenue (million) Forecast, by Application 2019 & 2032
- Table 18: Canada Orthodontic Power Chain Volume (K) Forecast, by Application 2019 & 2032
- Table 19: Mexico Orthodontic Power Chain Revenue (million) Forecast, by Application 2019 & 2032
- Table 20: Mexico Orthodontic Power Chain Volume (K) Forecast, by Application 2019 & 2032
- Table 21: Global Orthodontic Power Chain Revenue million Forecast, by Application 2019 & 2032
- Table 22: Global Orthodontic Power Chain Volume K Forecast, by Application 2019 & 2032
- Table 23: Global Orthodontic Power Chain Revenue million Forecast, by Type 2019 & 2032
- Table 24: Global Orthodontic Power Chain Volume K Forecast, by Type 2019 & 2032
- Table 25: Global Orthodontic Power Chain Revenue million Forecast, by Country 2019 & 2032
- Table 26: Global Orthodontic Power Chain Volume K Forecast, by Country 2019 & 2032
- Table 27: Brazil Orthodontic Power Chain Revenue (million) Forecast, by Application 2019 & 2032
- Table 28: Brazil Orthodontic Power Chain Volume (K) Forecast, by Application 2019 & 2032
- Table 29: Argentina Orthodontic Power Chain Revenue (million) Forecast, by Application 2019 & 2032
- Table 30: Argentina Orthodontic Power Chain Volume (K) Forecast, by Application 2019 & 2032
- Table 31: Rest of South America Orthodontic Power Chain Revenue (million) Forecast, by Application 2019 & 2032
- Table 32: Rest of South America Orthodontic Power Chain Volume (K) Forecast, by Application 2019 & 2032
- Table 33: Global Orthodontic Power Chain Revenue million Forecast, by Application 2019 & 2032
- Table 34: Global Orthodontic Power Chain Volume K Forecast, by Application 2019 & 2032
- Table 35: Global Orthodontic Power Chain Revenue million Forecast, by Type 2019 & 2032
- Table 36: Global Orthodontic Power Chain Volume K Forecast, by Type 2019 & 2032
- Table 37: Global Orthodontic Power Chain Revenue million Forecast, by Country 2019 & 2032
- Table 38: Global Orthodontic Power Chain Volume K Forecast, by Country 2019 & 2032
- Table 39: United Kingdom Orthodontic Power Chain Revenue (million) Forecast, by Application 2019 & 2032
- Table 40: United Kingdom Orthodontic Power Chain Volume (K) Forecast, by Application 2019 & 2032
- Table 41: Germany Orthodontic Power Chain Revenue (million) Forecast, by Application 2019 & 2032
- Table 42: Germany Orthodontic Power Chain Volume (K) Forecast, by Application 2019 & 2032
- Table 43: France Orthodontic Power Chain Revenue (million) Forecast, by Application 2019 & 2032
- Table 44: France Orthodontic Power Chain Volume (K) Forecast, by Application 2019 & 2032
- Table 45: Italy Orthodontic Power Chain Revenue (million) Forecast, by Application 2019 & 2032
- Table 46: Italy Orthodontic Power Chain Volume (K) Forecast, by Application 2019 & 2032
- Table 47: Spain Orthodontic Power Chain Revenue (million) Forecast, by Application 2019 & 2032
- Table 48: Spain Orthodontic Power Chain Volume (K) Forecast, by Application 2019 & 2032
- Table 49: Russia Orthodontic Power Chain Revenue (million) Forecast, by Application 2019 & 2032
- Table 50: Russia Orthodontic Power Chain Volume (K) Forecast, by Application 2019 & 2032
- Table 51: Benelux Orthodontic Power Chain Revenue (million) Forecast, by Application 2019 & 2032
- Table 52: Benelux Orthodontic Power Chain Volume (K) Forecast, by Application 2019 & 2032
- Table 53: Nordics Orthodontic Power Chain Revenue (million) Forecast, by Application 2019 & 2032
- Table 54: Nordics Orthodontic Power Chain Volume (K) Forecast, by Application 2019 & 2032
- Table 55: Rest of Europe Orthodontic Power Chain Revenue (million) Forecast, by Application 2019 & 2032
- Table 56: Rest of Europe Orthodontic Power Chain Volume (K) Forecast, by Application 2019 & 2032
- Table 57: Global Orthodontic Power Chain Revenue million Forecast, by Application 2019 & 2032
- Table 58: Global Orthodontic Power Chain Volume K Forecast, by Application 2019 & 2032
- Table 59: Global Orthodontic Power Chain Revenue million Forecast, by Type 2019 & 2032
- Table 60: Global Orthodontic Power Chain Volume K Forecast, by Type 2019 & 2032
- Table 61: Global Orthodontic Power Chain Revenue million Forecast, by Country 2019 & 2032
- Table 62: Global Orthodontic Power Chain Volume K Forecast, by Country 2019 & 2032
- Table 63: Turkey Orthodontic Power Chain Revenue (million) Forecast, by Application 2019 & 2032
- Table 64: Turkey Orthodontic Power Chain Volume (K) Forecast, by Application 2019 & 2032
- Table 65: Israel Orthodontic Power Chain Revenue (million) Forecast, by Application 2019 & 2032
- Table 66: Israel Orthodontic Power Chain Volume (K) Forecast, by Application 2019 & 2032
- Table 67: GCC Orthodontic Power Chain Revenue (million) Forecast, by Application 2019 & 2032
- Table 68: GCC Orthodontic Power Chain Volume (K) Forecast, by Application 2019 & 2032
- Table 69: North Africa Orthodontic Power Chain Revenue (million) Forecast, by Application 2019 & 2032
- Table 70: North Africa Orthodontic Power Chain Volume (K) Forecast, by Application 2019 & 2032
- Table 71: South Africa Orthodontic Power Chain Revenue (million) Forecast, by Application 2019 & 2032
- Table 72: South Africa Orthodontic Power Chain Volume (K) Forecast, by Application 2019 & 2032
- Table 73: Rest of Middle East & Africa Orthodontic Power Chain Revenue (million) Forecast, by Application 2019 & 2032
- Table 74: Rest of Middle East & Africa Orthodontic Power Chain Volume (K) Forecast, by Application 2019 & 2032
- Table 75: Global Orthodontic Power Chain Revenue million Forecast, by Application 2019 & 2032
- Table 76: Global Orthodontic Power Chain Volume K Forecast, by Application 2019 & 2032
- Table 77: Global Orthodontic Power Chain Revenue million Forecast, by Type 2019 & 2032
- Table 78: Global Orthodontic Power Chain Volume K Forecast, by Type 2019 & 2032
- Table 79: Global Orthodontic Power Chain Revenue million Forecast, by Country 2019 & 2032
- Table 80: Global Orthodontic Power Chain Volume K Forecast, by Country 2019 & 2032
- Table 81: China Orthodontic Power Chain Revenue (million) Forecast, by Application 2019 & 2032
- Table 82: China Orthodontic Power Chain Volume (K) Forecast, by Application 2019 & 2032
- Table 83: India Orthodontic Power Chain Revenue (million) Forecast, by Application 2019 & 2032
- Table 84: India Orthodontic Power Chain Volume (K) Forecast, by Application 2019 & 2032
- Table 85: Japan Orthodontic Power Chain Revenue (million) Forecast, by Application 2019 & 2032
- Table 86: Japan Orthodontic Power Chain Volume (K) Forecast, by Application 2019 & 2032
- Table 87: South Korea Orthodontic Power Chain Revenue (million) Forecast, by Application 2019 & 2032
- Table 88: South Korea Orthodontic Power Chain Volume (K) Forecast, by Application 2019 & 2032
- Table 89: ASEAN Orthodontic Power Chain Revenue (million) Forecast, by Application 2019 & 2032
- Table 90: ASEAN Orthodontic Power Chain Volume (K) Forecast, by Application 2019 & 2032
- Table 91: Oceania Orthodontic Power Chain Revenue (million) Forecast, by Application 2019 & 2032
- Table 92: Oceania Orthodontic Power Chain Volume (K) Forecast, by Application 2019 & 2032
- Table 93: Rest of Asia Pacific Orthodontic Power Chain Revenue (million) Forecast, by Application 2019 & 2032
- Table 94: Rest of Asia Pacific Orthodontic Power Chain Volume (K) Forecast, by Application 2019 & 2032
Frequently Asked Questions
1. What is the projected Compound Annual Growth Rate (CAGR) of the Orthodontic Power Chain?
The projected CAGR is approximately XXX%.
2. Which companies are prominent players in the Orthodontic Power Chain?
Key companies in the market include 3M, Adenta, Allstar Orthodontics, DynaFlex, G&H Orthodontics, LEONE, Jiscop Co., Ltd, Ormco.
3. What are the main segments of the Orthodontic Power Chain?
The market segments include Application, Type.
4. Can you provide details about the market size?
The market size is estimated to be USD XXX million as of 2022.
5. What are some drivers contributing to market growth?
N/A
6. What are the notable trends driving market growth?
N/A
7. Are there any restraints impacting market growth?
N/A
8. Can you provide examples of recent developments in the market?
N/A
9. What pricing options are available for accessing the report?
Pricing options include single-user, multi-user, and enterprise licenses priced at USD 3950.00, USD 5925.00, and USD 7900.00 respectively.
10. Is the market size provided in terms of value or volume?
The market size is provided in terms of value, measured in million and volume, measured in K.
11. Are there any specific market keywords associated with the report?
Yes, the market keyword associated with the report is "Orthodontic Power Chain," which aids in identifying and referencing the specific market segment covered.
12. How do I determine which pricing option suits my needs best?
The pricing options vary based on user requirements and access needs. Individual users may opt for single-user licenses, while businesses requiring broader access may choose multi-user or enterprise licenses for cost-effective access to the report.
13. Are there any additional resources or data provided in the Orthodontic Power Chain report?
While the report offers comprehensive insights, it's advisable to review the specific contents or supplementary materials provided to ascertain if additional resources or data are available.
14. How can I stay updated on further developments or reports in the Orthodontic Power Chain?
To stay informed about further developments, trends, and reports in the Orthodontic Power Chain, consider subscribing to industry newsletters, following relevant companies and organizations, or regularly checking reputable industry news sources and publications.
Methodology
Step 1 - Identification of Relevant Samples Size from Population Database


Step 2 - Approaches for Defining Global Market Size (Value, Volume* & Price*)

Note*: In applicable scenarios
Step 3 - Data Sources
Primary Research
- Web Analytics
- Survey Reports
- Research Institute
- Latest Research Reports
- Opinion Leaders
Secondary Research
- Annual Reports
- White Paper
- Latest Press Release
- Industry Association
- Paid Database
- Investor Presentations

Step 4 - Data Triangulation
Involves using different sources of information in order to increase the validity of a study
These sources are likely to be stakeholders in a program - participants, other researchers, program staff, other community members, and so on.
Then we put all data in single framework & apply various statistical tools to find out the dynamic on the market.
During the analysis stage, feedback from the stakeholder groups would be compared to determine areas of agreement as well as areas of divergence
