

Key Insights
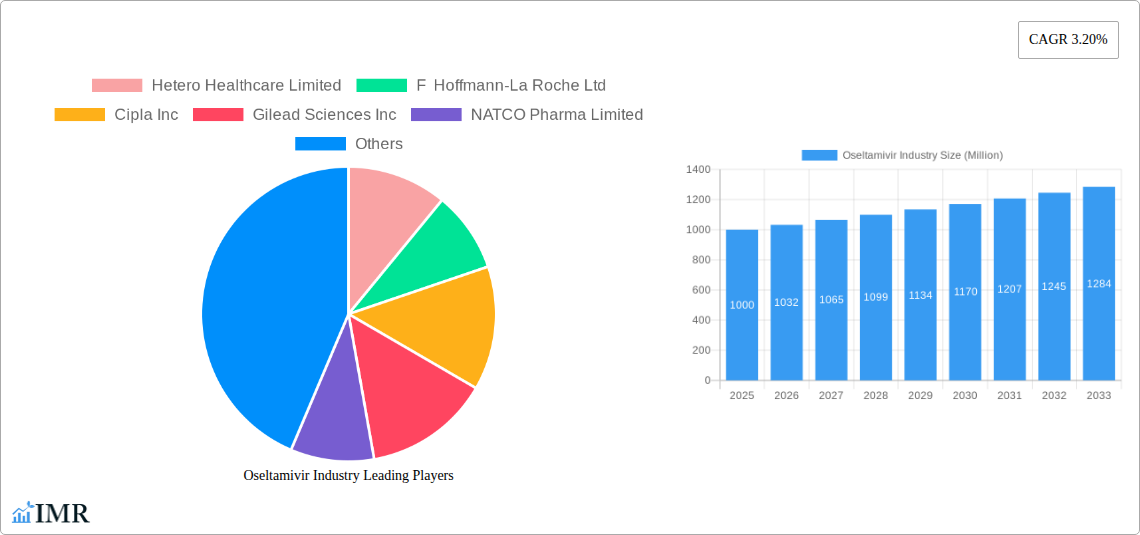
The global Oseltamivir market, valued at approximately $XX million in 2025, is projected to experience steady growth, driven by a Compound Annual Growth Rate (CAGR) of 3.20% from 2025 to 2033. This growth is primarily fueled by the persistent threat of influenza outbreaks, particularly during seasonal flu epidemics and potential pandemics. Increased awareness of influenza prevention and treatment, coupled with the efficacy of Oseltamivir in reducing the severity and duration of influenza symptoms, contributes significantly to market expansion. The market segmentation reveals a strong preference for capsule formulations, indicating convenience and ease of administration play a crucial role in patient acceptance. Influenza A remains the dominant application segment, reflecting its higher prevalence compared to Influenza B. Major pharmaceutical companies such as Hetero Healthcare Limited, Roche, Cipla, and Gilead Sciences are key players, engaging in competitive strategies including pricing, formulation innovation, and geographical expansion to capture market share. While potential restraints, such as the emergence of antiviral-resistant strains and the availability of alternative treatments, need to be considered, the overall market outlook remains positive. The expanding geriatric population, representing a vulnerable group highly susceptible to influenza complications, is expected to further boost demand for Oseltamivir throughout the forecast period.
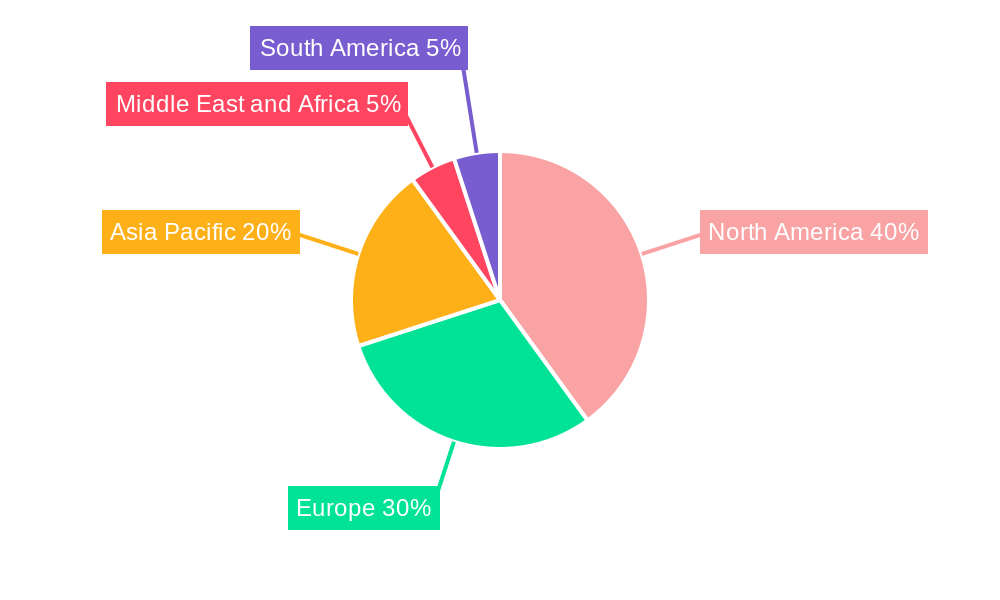
Geographical distribution indicates a significant market presence across North America and Europe, driven by high healthcare expenditure and robust healthcare infrastructure. However, the Asia-Pacific region presents substantial growth potential, fueled by rising healthcare awareness, expanding middle class, and increasing incidence of influenza infections. The market's growth trajectory suggests continuous investment in research and development to address antiviral resistance and optimize treatment strategies, which will, in turn, shape the competitive landscape and future market dynamics. This continued innovation, together with effective public health measures, will be vital in managing the impact of seasonal and pandemic influenza, thereby contributing to the long-term growth of the Oseltamivir market.
Oseltamivir Industry Market Report: 2019-2033
This comprehensive report provides a detailed analysis of the Oseltamivir industry, encompassing market dynamics, growth trends, competitive landscape, and future outlook. Covering the period 2019-2033, with a focus on 2025, this report is an essential resource for industry professionals, investors, and researchers seeking to understand and capitalize on opportunities within this dynamic sector. The report segments the market by product type (Capsule, Suspension, Other Product Types) and application (Influenza A, Influenza B, Other Applications), providing granular insights into each segment's performance and future trajectory. The report analyzes the parent market of antiviral drugs and the child market of influenza treatments, offering a holistic view of the industry's position and potential. Market values are presented in Million units.
Oseltamivir Industry Market Dynamics & Structure
The Oseltamivir market is characterized by moderate concentration, with key players holding significant market share. Technological innovation, primarily focused on improving formulation and delivery, plays a crucial role. Stringent regulatory frameworks govern manufacturing and distribution, influencing market access and competition. Generic competition significantly impacts pricing and market dynamics. The market's growth is closely tied to influenza outbreaks and seasonal patterns, making it susceptible to epidemiological factors. M&A activity has been relatively low in recent years, with xx deals recorded between 2019 and 2024.
- Market Concentration: Moderately concentrated, with top 5 players holding xx% market share in 2024.
- Technological Innovation: Focus on improved bioavailability and patient compliance (e.g., novel formulations).
- Regulatory Landscape: Stringent regulations regarding safety and efficacy impact market entry and pricing.
- Competitive Substitutes: Baloxavir marboxil and other antiviral medications present competitive pressure.
- End-User Demographics: Primarily focused on patients with influenza, with age and health status influencing demand.
- M&A Trends: Low activity in recent years, with an anticipated increase in future strategic partnerships.
Oseltamivir Industry Growth Trends & Insights
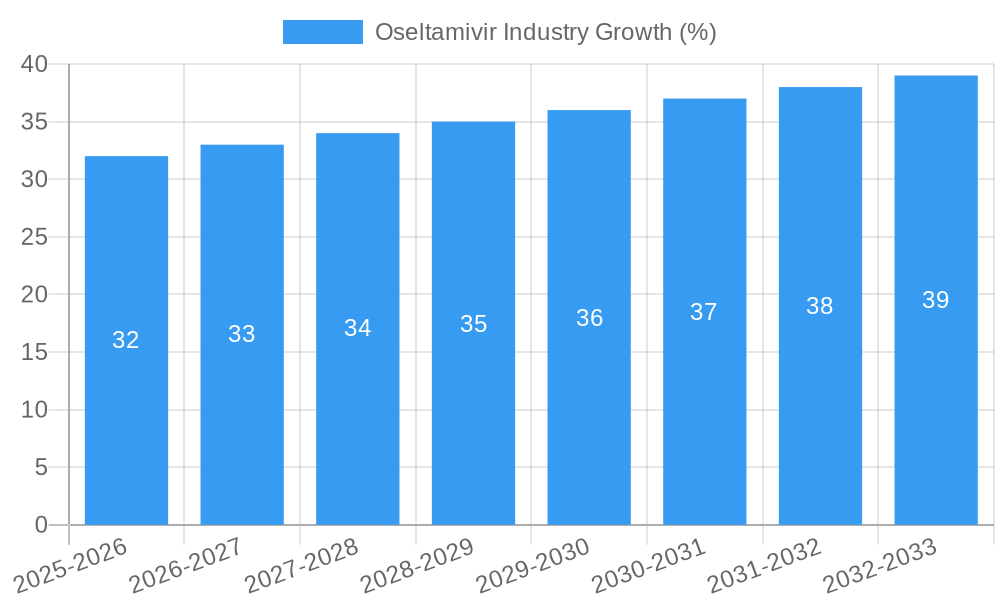
The Oseltamivir market experienced a CAGR of xx% during 2019-2024, driven by increasing influenza incidence and rising awareness of antiviral treatments. Adoption rates vary geographically, with higher penetration in developed nations. Technological advancements, such as improved formulations and combination therapies, are driving market growth. Consumer behavior is influenced by physician recommendations and public health campaigns. The market is expected to continue its growth trajectory, with a projected CAGR of xx% from 2025 to 2033, reaching xx Million units by 2033. Market penetration is expected to increase in emerging markets driven by rising healthcare expenditure and improved access to medication. The impact of seasonal influenza epidemics significantly influences annual sales figures.
Dominant Regions, Countries, or Segments in Oseltamivir Industry
North America and Europe currently dominate the Oseltamivir market due to higher influenza prevalence, well-established healthcare infrastructure, and greater access to antiviral medications. Within product types, Capsules hold the largest market share, followed by Suspensions. Influenza A constitutes the majority of applications.
- Key Drivers: High influenza prevalence in developed regions, robust healthcare infrastructure, and strong physician awareness.
- Dominance Factors: High per capita healthcare spending, established distribution networks, and early adoption of new drug formulations.
- Growth Potential: Significant opportunities exist in emerging markets due to rising healthcare expenditure and increased disease awareness. The market share of capsule is expected to reach xx Million units by 2033.
Oseltamivir Industry Product Landscape
Oseltamivir is primarily available as capsules and oral suspensions, with ongoing research exploring novel formulations and delivery systems aimed at enhancing bioavailability and patient adherence. The focus is on improving taste and palatability, particularly for pediatric formulations. Unique selling propositions include rapid onset of action and reduced symptom duration, although generic competition significantly affects pricing.
Key Drivers, Barriers & Challenges in Oseltamivir Industry
Key Drivers: Increasing influenza cases globally, rising healthcare expenditure, growing awareness of antiviral prophylaxis, and technological advancements leading to improved formulations.
Challenges & Restraints: Emergence of drug-resistant influenza strains, fluctuating demand due to seasonal influenza outbreaks, pricing pressures from generic competition, and potential supply chain disruptions. The impact of generic competition reduced market price by xx% in 2024.
Emerging Opportunities in Oseltamivir Industry
Emerging markets in Asia and Africa offer significant growth potential. Opportunities also exist in developing novel formulations (e.g., long-acting injections), combination therapies with other antivirals, and targeted treatments for specific influenza subtypes. Furthermore, increasing focus on pandemic preparedness creates potential for increased stockpiling of Oseltamivir.
Growth Accelerators in the Oseltamivir Industry
Strategic partnerships for market expansion, especially in underserved regions, can greatly enhance market penetration. Investment in research and development to combat drug resistance and develop new formulations will continue to drive growth. The successful implementation of public health campaigns promoting preventative measures and early antiviral treatment will influence market demand positively.
Key Players Shaping the Oseltamivir Industry Market
- Hetero Healthcare Limited
- F Hoffmann-La Roche Ltd
- Cipla Inc
- Gilead Sciences Inc
- NATCO Pharma Limited
- Strides Pharma Science Limited
- Amneal Pharmaceuticals LLC
- Lupin Limited
- Alembic Pharmaceuticals Limited
- Macleods Pharmaceuticals Ltd
- Zydus Cadila
Notable Milestones in Oseltamivir Industry Sector
- October 2021: M.D. Anderson Cancer Center initiated a Phase II clinical study on the effect of baloxavir in combination with oseltamivir. This indicates potential for combination therapies and expanding the treatment landscape.
- January 2022: Strides Pharma Science Ltd received US FDA approval for its generic oseltamivir phosphate oral suspension. This increased competition and potentially lowered prices.
In-Depth Oseltamivir Industry Market Outlook
The Oseltamivir market is poised for continued growth, driven by ongoing research and development, strategic partnerships, and increased market penetration in emerging economies. The focus on developing novel formulations and combination therapies, along with proactive pandemic preparedness measures, will propel the market forward. The market's long-term growth is linked to the continuous evolution of influenza strains and the need for effective antiviral treatments. Strategic acquisitions and partnerships will likely play a major role in shaping the competitive landscape in the coming years.
Oseltamivir Industry Segmentation
-
1. Product Type
- 1.1. Capsule
- 1.2. Suspension
- 1.3. Other Product Types
-
2. Industry vertical
- 2.1. Influenza A
- 2.2. Influenza B
- 2.3. Other
Oseltamivir Industry Segmentation By Geography
-
1. North America
- 1.1. United States
- 1.2. Canada
- 1.3. Mexico
-
2. Europe
- 2.1. Germany
- 2.2. United Kingdom
- 2.3. France
- 2.4. Italy
- 2.5. Spain
- 2.6. Rest of Europe
-
3. Asia Pacific
- 3.1. China
- 3.2. Japan
- 3.3. India
- 3.4. Australia
- 3.5. South Korea
- 3.6. Rest of Asia Pacific
-
4. Middle East and Africa
- 4.1. GCC
- 4.2. South Africa
- 4.3. Rest of Middle East and Africa
-
5. South America
- 5.1. Brazil
- 5.2. Argentina
- 5.3. Rest of South America
Oseltamivir Industry REPORT HIGHLIGHTS
| Aspects | Details |
|---|---|
| Study Period | 2019-2033 |
| Base Year | 2024 |
| Estimated Year | 2025 |
| Forecast Period | 2025-2033 |
| Historical Period | 2019-2024 |
| Growth Rate | CAGR of 3.20% from 2019-2033 |
| Segmentation |
|
Table of Contents
- 1. Introduction
- 1.1. Research Scope
- 1.2. Market Segmentation
- 1.3. Research Methodology
- 1.4. Definitions and Assumptions
- 2. Executive Summary
- 2.1. Introduction
- 3. Market Dynamics
- 3.1. Introduction
- 3.2. Market Drivers
- 3.2.1. Rising Prevalence of Influenza Virus Infections; Increase in the Number of Research and Development Activities
- 3.3. Market Restrains
- 3.3.1. Side Effects Associated with Oseltamivir Treatment
- 3.4. Market Trends
- 3.4.1. Influenza A Segment Expects to Register a High CAGR Over the Forecast Period
- 4. Market Factor Analysis
- 4.1. Porters Five Forces
- 4.2. Supply/Value Chain
- 4.3. PESTEL analysis
- 4.4. Market Entropy
- 4.5. Patent/Trademark Analysis
- 5. Global Oseltamivir Industry Analysis, Insights and Forecast, 2019-2031
- 5.1. Market Analysis, Insights and Forecast - by Product Type
- 5.1.1. Capsule
- 5.1.2. Suspension
- 5.1.3. Other Product Types
- 5.2. Market Analysis, Insights and Forecast - by Industry vertical
- 5.2.1. Influenza A
- 5.2.2. Influenza B
- 5.2.3. Other
- 5.3. Market Analysis, Insights and Forecast - by Region
- 5.3.1. North America
- 5.3.2. Europe
- 5.3.3. Asia Pacific
- 5.3.4. Middle East and Africa
- 5.3.5. South America
- 5.1. Market Analysis, Insights and Forecast - by Product Type
- 6. North America Oseltamivir Industry Analysis, Insights and Forecast, 2019-2031
- 6.1. Market Analysis, Insights and Forecast - by Product Type
- 6.1.1. Capsule
- 6.1.2. Suspension
- 6.1.3. Other Product Types
- 6.2. Market Analysis, Insights and Forecast - by Industry vertical
- 6.2.1. Influenza A
- 6.2.2. Influenza B
- 6.2.3. Other
- 6.1. Market Analysis, Insights and Forecast - by Product Type
- 7. Europe Oseltamivir Industry Analysis, Insights and Forecast, 2019-2031
- 7.1. Market Analysis, Insights and Forecast - by Product Type
- 7.1.1. Capsule
- 7.1.2. Suspension
- 7.1.3. Other Product Types
- 7.2. Market Analysis, Insights and Forecast - by Industry vertical
- 7.2.1. Influenza A
- 7.2.2. Influenza B
- 7.2.3. Other
- 7.1. Market Analysis, Insights and Forecast - by Product Type
- 8. Asia Pacific Oseltamivir Industry Analysis, Insights and Forecast, 2019-2031
- 8.1. Market Analysis, Insights and Forecast - by Product Type
- 8.1.1. Capsule
- 8.1.2. Suspension
- 8.1.3. Other Product Types
- 8.2. Market Analysis, Insights and Forecast - by Industry vertical
- 8.2.1. Influenza A
- 8.2.2. Influenza B
- 8.2.3. Other
- 8.1. Market Analysis, Insights and Forecast - by Product Type
- 9. Middle East and Africa Oseltamivir Industry Analysis, Insights and Forecast, 2019-2031
- 9.1. Market Analysis, Insights and Forecast - by Product Type
- 9.1.1. Capsule
- 9.1.2. Suspension
- 9.1.3. Other Product Types
- 9.2. Market Analysis, Insights and Forecast - by Industry vertical
- 9.2.1. Influenza A
- 9.2.2. Influenza B
- 9.2.3. Other
- 9.1. Market Analysis, Insights and Forecast - by Product Type
- 10. South America Oseltamivir Industry Analysis, Insights and Forecast, 2019-2031
- 10.1. Market Analysis, Insights and Forecast - by Product Type
- 10.1.1. Capsule
- 10.1.2. Suspension
- 10.1.3. Other Product Types
- 10.2. Market Analysis, Insights and Forecast - by Industry vertical
- 10.2.1. Influenza A
- 10.2.2. Influenza B
- 10.2.3. Other
- 10.1. Market Analysis, Insights and Forecast - by Product Type
- 11. North America Oseltamivir Industry Analysis, Insights and Forecast, 2019-2031
- 11.1. Market Analysis, Insights and Forecast - By Country/Sub-region
- 11.1.1 United States
- 11.1.2 Canada
- 11.1.3 Mexico
- 12. Europe Oseltamivir Industry Analysis, Insights and Forecast, 2019-2031
- 12.1. Market Analysis, Insights and Forecast - By Country/Sub-region
- 12.1.1 Germany
- 12.1.2 United Kingdom
- 12.1.3 France
- 12.1.4 Italy
- 12.1.5 Spain
- 12.1.6 Rest of Europe
- 13. Asia Pacific Oseltamivir Industry Analysis, Insights and Forecast, 2019-2031
- 13.1. Market Analysis, Insights and Forecast - By Country/Sub-region
- 13.1.1 China
- 13.1.2 Japan
- 13.1.3 India
- 13.1.4 Australia
- 13.1.5 South Korea
- 13.1.6 Rest of Asia Pacific
- 14. Middle East and Africa Oseltamivir Industry Analysis, Insights and Forecast, 2019-2031
- 14.1. Market Analysis, Insights and Forecast - By Country/Sub-region
- 14.1.1 GCC
- 14.1.2 South Africa
- 14.1.3 Rest of Middle East and Africa
- 15. South America Oseltamivir Industry Analysis, Insights and Forecast, 2019-2031
- 15.1. Market Analysis, Insights and Forecast - By Country/Sub-region
- 15.1.1 Brazil
- 15.1.2 Argentina
- 15.1.3 Rest of South America
- 16. Competitive Analysis
- 16.1. Global Market Share Analysis 2024
- 16.2. Company Profiles
- 16.2.1 Hetero Healthcare Limited
- 16.2.1.1. Overview
- 16.2.1.2. Products
- 16.2.1.3. SWOT Analysis
- 16.2.1.4. Recent Developments
- 16.2.1.5. Financials (Based on Availability)
- 16.2.2 F Hoffmann-La Roche Ltd
- 16.2.2.1. Overview
- 16.2.2.2. Products
- 16.2.2.3. SWOT Analysis
- 16.2.2.4. Recent Developments
- 16.2.2.5. Financials (Based on Availability)
- 16.2.3 Cipla Inc
- 16.2.3.1. Overview
- 16.2.3.2. Products
- 16.2.3.3. SWOT Analysis
- 16.2.3.4. Recent Developments
- 16.2.3.5. Financials (Based on Availability)
- 16.2.4 Gilead Sciences Inc
- 16.2.4.1. Overview
- 16.2.4.2. Products
- 16.2.4.3. SWOT Analysis
- 16.2.4.4. Recent Developments
- 16.2.4.5. Financials (Based on Availability)
- 16.2.5 NATCO Pharma Limited
- 16.2.5.1. Overview
- 16.2.5.2. Products
- 16.2.5.3. SWOT Analysis
- 16.2.5.4. Recent Developments
- 16.2.5.5. Financials (Based on Availability)
- 16.2.6 Strides Pharma Science Limited
- 16.2.6.1. Overview
- 16.2.6.2. Products
- 16.2.6.3. SWOT Analysis
- 16.2.6.4. Recent Developments
- 16.2.6.5. Financials (Based on Availability)
- 16.2.7 Amneal Pharmaceuticals LLC
- 16.2.7.1. Overview
- 16.2.7.2. Products
- 16.2.7.3. SWOT Analysis
- 16.2.7.4. Recent Developments
- 16.2.7.5. Financials (Based on Availability)
- 16.2.8 Lupin Limited
- 16.2.8.1. Overview
- 16.2.8.2. Products
- 16.2.8.3. SWOT Analysis
- 16.2.8.4. Recent Developments
- 16.2.8.5. Financials (Based on Availability)
- 16.2.9 Alembic Pharmaceuticals Limited
- 16.2.9.1. Overview
- 16.2.9.2. Products
- 16.2.9.3. SWOT Analysis
- 16.2.9.4. Recent Developments
- 16.2.9.5. Financials (Based on Availability)
- 16.2.10 Macleods Pharmaceuticals Ltd
- 16.2.10.1. Overview
- 16.2.10.2. Products
- 16.2.10.3. SWOT Analysis
- 16.2.10.4. Recent Developments
- 16.2.10.5. Financials (Based on Availability)
- 16.2.11 Zydus Cadila
- 16.2.11.1. Overview
- 16.2.11.2. Products
- 16.2.11.3. SWOT Analysis
- 16.2.11.4. Recent Developments
- 16.2.11.5. Financials (Based on Availability)
- 16.2.1 Hetero Healthcare Limited
List of Figures
- Figure 1: Global Oseltamivir Industry Revenue Breakdown (Million, %) by Region 2024 & 2032
- Figure 2: Global Oseltamivir Industry Volume Breakdown (K Unit, %) by Region 2024 & 2032
- Figure 3: North America Oseltamivir Industry Revenue (Million), by Country 2024 & 2032
- Figure 4: North America Oseltamivir Industry Volume (K Unit), by Country 2024 & 2032
- Figure 5: North America Oseltamivir Industry Revenue Share (%), by Country 2024 & 2032
- Figure 6: North America Oseltamivir Industry Volume Share (%), by Country 2024 & 2032
- Figure 7: Europe Oseltamivir Industry Revenue (Million), by Country 2024 & 2032
- Figure 8: Europe Oseltamivir Industry Volume (K Unit), by Country 2024 & 2032
- Figure 9: Europe Oseltamivir Industry Revenue Share (%), by Country 2024 & 2032
- Figure 10: Europe Oseltamivir Industry Volume Share (%), by Country 2024 & 2032
- Figure 11: Asia Pacific Oseltamivir Industry Revenue (Million), by Country 2024 & 2032
- Figure 12: Asia Pacific Oseltamivir Industry Volume (K Unit), by Country 2024 & 2032
- Figure 13: Asia Pacific Oseltamivir Industry Revenue Share (%), by Country 2024 & 2032
- Figure 14: Asia Pacific Oseltamivir Industry Volume Share (%), by Country 2024 & 2032
- Figure 15: Middle East and Africa Oseltamivir Industry Revenue (Million), by Country 2024 & 2032
- Figure 16: Middle East and Africa Oseltamivir Industry Volume (K Unit), by Country 2024 & 2032
- Figure 17: Middle East and Africa Oseltamivir Industry Revenue Share (%), by Country 2024 & 2032
- Figure 18: Middle East and Africa Oseltamivir Industry Volume Share (%), by Country 2024 & 2032
- Figure 19: South America Oseltamivir Industry Revenue (Million), by Country 2024 & 2032
- Figure 20: South America Oseltamivir Industry Volume (K Unit), by Country 2024 & 2032
- Figure 21: South America Oseltamivir Industry Revenue Share (%), by Country 2024 & 2032
- Figure 22: South America Oseltamivir Industry Volume Share (%), by Country 2024 & 2032
- Figure 23: North America Oseltamivir Industry Revenue (Million), by Product Type 2024 & 2032
- Figure 24: North America Oseltamivir Industry Volume (K Unit), by Product Type 2024 & 2032
- Figure 25: North America Oseltamivir Industry Revenue Share (%), by Product Type 2024 & 2032
- Figure 26: North America Oseltamivir Industry Volume Share (%), by Product Type 2024 & 2032
- Figure 27: North America Oseltamivir Industry Revenue (Million), by Industry vertical 2024 & 2032
- Figure 28: North America Oseltamivir Industry Volume (K Unit), by Industry vertical 2024 & 2032
- Figure 29: North America Oseltamivir Industry Revenue Share (%), by Industry vertical 2024 & 2032
- Figure 30: North America Oseltamivir Industry Volume Share (%), by Industry vertical 2024 & 2032
- Figure 31: North America Oseltamivir Industry Revenue (Million), by Country 2024 & 2032
- Figure 32: North America Oseltamivir Industry Volume (K Unit), by Country 2024 & 2032
- Figure 33: North America Oseltamivir Industry Revenue Share (%), by Country 2024 & 2032
- Figure 34: North America Oseltamivir Industry Volume Share (%), by Country 2024 & 2032
- Figure 35: Europe Oseltamivir Industry Revenue (Million), by Product Type 2024 & 2032
- Figure 36: Europe Oseltamivir Industry Volume (K Unit), by Product Type 2024 & 2032
- Figure 37: Europe Oseltamivir Industry Revenue Share (%), by Product Type 2024 & 2032
- Figure 38: Europe Oseltamivir Industry Volume Share (%), by Product Type 2024 & 2032
- Figure 39: Europe Oseltamivir Industry Revenue (Million), by Industry vertical 2024 & 2032
- Figure 40: Europe Oseltamivir Industry Volume (K Unit), by Industry vertical 2024 & 2032
- Figure 41: Europe Oseltamivir Industry Revenue Share (%), by Industry vertical 2024 & 2032
- Figure 42: Europe Oseltamivir Industry Volume Share (%), by Industry vertical 2024 & 2032
- Figure 43: Europe Oseltamivir Industry Revenue (Million), by Country 2024 & 2032
- Figure 44: Europe Oseltamivir Industry Volume (K Unit), by Country 2024 & 2032
- Figure 45: Europe Oseltamivir Industry Revenue Share (%), by Country 2024 & 2032
- Figure 46: Europe Oseltamivir Industry Volume Share (%), by Country 2024 & 2032
- Figure 47: Asia Pacific Oseltamivir Industry Revenue (Million), by Product Type 2024 & 2032
- Figure 48: Asia Pacific Oseltamivir Industry Volume (K Unit), by Product Type 2024 & 2032
- Figure 49: Asia Pacific Oseltamivir Industry Revenue Share (%), by Product Type 2024 & 2032
- Figure 50: Asia Pacific Oseltamivir Industry Volume Share (%), by Product Type 2024 & 2032
- Figure 51: Asia Pacific Oseltamivir Industry Revenue (Million), by Industry vertical 2024 & 2032
- Figure 52: Asia Pacific Oseltamivir Industry Volume (K Unit), by Industry vertical 2024 & 2032
- Figure 53: Asia Pacific Oseltamivir Industry Revenue Share (%), by Industry vertical 2024 & 2032
- Figure 54: Asia Pacific Oseltamivir Industry Volume Share (%), by Industry vertical 2024 & 2032
- Figure 55: Asia Pacific Oseltamivir Industry Revenue (Million), by Country 2024 & 2032
- Figure 56: Asia Pacific Oseltamivir Industry Volume (K Unit), by Country 2024 & 2032
- Figure 57: Asia Pacific Oseltamivir Industry Revenue Share (%), by Country 2024 & 2032
- Figure 58: Asia Pacific Oseltamivir Industry Volume Share (%), by Country 2024 & 2032
- Figure 59: Middle East and Africa Oseltamivir Industry Revenue (Million), by Product Type 2024 & 2032
- Figure 60: Middle East and Africa Oseltamivir Industry Volume (K Unit), by Product Type 2024 & 2032
- Figure 61: Middle East and Africa Oseltamivir Industry Revenue Share (%), by Product Type 2024 & 2032
- Figure 62: Middle East and Africa Oseltamivir Industry Volume Share (%), by Product Type 2024 & 2032
- Figure 63: Middle East and Africa Oseltamivir Industry Revenue (Million), by Industry vertical 2024 & 2032
- Figure 64: Middle East and Africa Oseltamivir Industry Volume (K Unit), by Industry vertical 2024 & 2032
- Figure 65: Middle East and Africa Oseltamivir Industry Revenue Share (%), by Industry vertical 2024 & 2032
- Figure 66: Middle East and Africa Oseltamivir Industry Volume Share (%), by Industry vertical 2024 & 2032
- Figure 67: Middle East and Africa Oseltamivir Industry Revenue (Million), by Country 2024 & 2032
- Figure 68: Middle East and Africa Oseltamivir Industry Volume (K Unit), by Country 2024 & 2032
- Figure 69: Middle East and Africa Oseltamivir Industry Revenue Share (%), by Country 2024 & 2032
- Figure 70: Middle East and Africa Oseltamivir Industry Volume Share (%), by Country 2024 & 2032
- Figure 71: South America Oseltamivir Industry Revenue (Million), by Product Type 2024 & 2032
- Figure 72: South America Oseltamivir Industry Volume (K Unit), by Product Type 2024 & 2032
- Figure 73: South America Oseltamivir Industry Revenue Share (%), by Product Type 2024 & 2032
- Figure 74: South America Oseltamivir Industry Volume Share (%), by Product Type 2024 & 2032
- Figure 75: South America Oseltamivir Industry Revenue (Million), by Industry vertical 2024 & 2032
- Figure 76: South America Oseltamivir Industry Volume (K Unit), by Industry vertical 2024 & 2032
- Figure 77: South America Oseltamivir Industry Revenue Share (%), by Industry vertical 2024 & 2032
- Figure 78: South America Oseltamivir Industry Volume Share (%), by Industry vertical 2024 & 2032
- Figure 79: South America Oseltamivir Industry Revenue (Million), by Country 2024 & 2032
- Figure 80: South America Oseltamivir Industry Volume (K Unit), by Country 2024 & 2032
- Figure 81: South America Oseltamivir Industry Revenue Share (%), by Country 2024 & 2032
- Figure 82: South America Oseltamivir Industry Volume Share (%), by Country 2024 & 2032
List of Tables
- Table 1: Global Oseltamivir Industry Revenue Million Forecast, by Region 2019 & 2032
- Table 2: Global Oseltamivir Industry Volume K Unit Forecast, by Region 2019 & 2032
- Table 3: Global Oseltamivir Industry Revenue Million Forecast, by Product Type 2019 & 2032
- Table 4: Global Oseltamivir Industry Volume K Unit Forecast, by Product Type 2019 & 2032
- Table 5: Global Oseltamivir Industry Revenue Million Forecast, by Industry vertical 2019 & 2032
- Table 6: Global Oseltamivir Industry Volume K Unit Forecast, by Industry vertical 2019 & 2032
- Table 7: Global Oseltamivir Industry Revenue Million Forecast, by Region 2019 & 2032
- Table 8: Global Oseltamivir Industry Volume K Unit Forecast, by Region 2019 & 2032
- Table 9: Global Oseltamivir Industry Revenue Million Forecast, by Country 2019 & 2032
- Table 10: Global Oseltamivir Industry Volume K Unit Forecast, by Country 2019 & 2032
- Table 11: United States Oseltamivir Industry Revenue (Million) Forecast, by Application 2019 & 2032
- Table 12: United States Oseltamivir Industry Volume (K Unit) Forecast, by Application 2019 & 2032
- Table 13: Canada Oseltamivir Industry Revenue (Million) Forecast, by Application 2019 & 2032
- Table 14: Canada Oseltamivir Industry Volume (K Unit) Forecast, by Application 2019 & 2032
- Table 15: Mexico Oseltamivir Industry Revenue (Million) Forecast, by Application 2019 & 2032
- Table 16: Mexico Oseltamivir Industry Volume (K Unit) Forecast, by Application 2019 & 2032
- Table 17: Global Oseltamivir Industry Revenue Million Forecast, by Country 2019 & 2032
- Table 18: Global Oseltamivir Industry Volume K Unit Forecast, by Country 2019 & 2032
- Table 19: Germany Oseltamivir Industry Revenue (Million) Forecast, by Application 2019 & 2032
- Table 20: Germany Oseltamivir Industry Volume (K Unit) Forecast, by Application 2019 & 2032
- Table 21: United Kingdom Oseltamivir Industry Revenue (Million) Forecast, by Application 2019 & 2032
- Table 22: United Kingdom Oseltamivir Industry Volume (K Unit) Forecast, by Application 2019 & 2032
- Table 23: France Oseltamivir Industry Revenue (Million) Forecast, by Application 2019 & 2032
- Table 24: France Oseltamivir Industry Volume (K Unit) Forecast, by Application 2019 & 2032
- Table 25: Italy Oseltamivir Industry Revenue (Million) Forecast, by Application 2019 & 2032
- Table 26: Italy Oseltamivir Industry Volume (K Unit) Forecast, by Application 2019 & 2032
- Table 27: Spain Oseltamivir Industry Revenue (Million) Forecast, by Application 2019 & 2032
- Table 28: Spain Oseltamivir Industry Volume (K Unit) Forecast, by Application 2019 & 2032
- Table 29: Rest of Europe Oseltamivir Industry Revenue (Million) Forecast, by Application 2019 & 2032
- Table 30: Rest of Europe Oseltamivir Industry Volume (K Unit) Forecast, by Application 2019 & 2032
- Table 31: Global Oseltamivir Industry Revenue Million Forecast, by Country 2019 & 2032
- Table 32: Global Oseltamivir Industry Volume K Unit Forecast, by Country 2019 & 2032
- Table 33: China Oseltamivir Industry Revenue (Million) Forecast, by Application 2019 & 2032
- Table 34: China Oseltamivir Industry Volume (K Unit) Forecast, by Application 2019 & 2032
- Table 35: Japan Oseltamivir Industry Revenue (Million) Forecast, by Application 2019 & 2032
- Table 36: Japan Oseltamivir Industry Volume (K Unit) Forecast, by Application 2019 & 2032
- Table 37: India Oseltamivir Industry Revenue (Million) Forecast, by Application 2019 & 2032
- Table 38: India Oseltamivir Industry Volume (K Unit) Forecast, by Application 2019 & 2032
- Table 39: Australia Oseltamivir Industry Revenue (Million) Forecast, by Application 2019 & 2032
- Table 40: Australia Oseltamivir Industry Volume (K Unit) Forecast, by Application 2019 & 2032
- Table 41: South Korea Oseltamivir Industry Revenue (Million) Forecast, by Application 2019 & 2032
- Table 42: South Korea Oseltamivir Industry Volume (K Unit) Forecast, by Application 2019 & 2032
- Table 43: Rest of Asia Pacific Oseltamivir Industry Revenue (Million) Forecast, by Application 2019 & 2032
- Table 44: Rest of Asia Pacific Oseltamivir Industry Volume (K Unit) Forecast, by Application 2019 & 2032
- Table 45: Global Oseltamivir Industry Revenue Million Forecast, by Country 2019 & 2032
- Table 46: Global Oseltamivir Industry Volume K Unit Forecast, by Country 2019 & 2032
- Table 47: GCC Oseltamivir Industry Revenue (Million) Forecast, by Application 2019 & 2032
- Table 48: GCC Oseltamivir Industry Volume (K Unit) Forecast, by Application 2019 & 2032
- Table 49: South Africa Oseltamivir Industry Revenue (Million) Forecast, by Application 2019 & 2032
- Table 50: South Africa Oseltamivir Industry Volume (K Unit) Forecast, by Application 2019 & 2032
- Table 51: Rest of Middle East and Africa Oseltamivir Industry Revenue (Million) Forecast, by Application 2019 & 2032
- Table 52: Rest of Middle East and Africa Oseltamivir Industry Volume (K Unit) Forecast, by Application 2019 & 2032
- Table 53: Global Oseltamivir Industry Revenue Million Forecast, by Country 2019 & 2032
- Table 54: Global Oseltamivir Industry Volume K Unit Forecast, by Country 2019 & 2032
- Table 55: Brazil Oseltamivir Industry Revenue (Million) Forecast, by Application 2019 & 2032
- Table 56: Brazil Oseltamivir Industry Volume (K Unit) Forecast, by Application 2019 & 2032
- Table 57: Argentina Oseltamivir Industry Revenue (Million) Forecast, by Application 2019 & 2032
- Table 58: Argentina Oseltamivir Industry Volume (K Unit) Forecast, by Application 2019 & 2032
- Table 59: Rest of South America Oseltamivir Industry Revenue (Million) Forecast, by Application 2019 & 2032
- Table 60: Rest of South America Oseltamivir Industry Volume (K Unit) Forecast, by Application 2019 & 2032
- Table 61: Global Oseltamivir Industry Revenue Million Forecast, by Product Type 2019 & 2032
- Table 62: Global Oseltamivir Industry Volume K Unit Forecast, by Product Type 2019 & 2032
- Table 63: Global Oseltamivir Industry Revenue Million Forecast, by Industry vertical 2019 & 2032
- Table 64: Global Oseltamivir Industry Volume K Unit Forecast, by Industry vertical 2019 & 2032
- Table 65: Global Oseltamivir Industry Revenue Million Forecast, by Country 2019 & 2032
- Table 66: Global Oseltamivir Industry Volume K Unit Forecast, by Country 2019 & 2032
- Table 67: United States Oseltamivir Industry Revenue (Million) Forecast, by Application 2019 & 2032
- Table 68: United States Oseltamivir Industry Volume (K Unit) Forecast, by Application 2019 & 2032
- Table 69: Canada Oseltamivir Industry Revenue (Million) Forecast, by Application 2019 & 2032
- Table 70: Canada Oseltamivir Industry Volume (K Unit) Forecast, by Application 2019 & 2032
- Table 71: Mexico Oseltamivir Industry Revenue (Million) Forecast, by Application 2019 & 2032
- Table 72: Mexico Oseltamivir Industry Volume (K Unit) Forecast, by Application 2019 & 2032
- Table 73: Global Oseltamivir Industry Revenue Million Forecast, by Product Type 2019 & 2032
- Table 74: Global Oseltamivir Industry Volume K Unit Forecast, by Product Type 2019 & 2032
- Table 75: Global Oseltamivir Industry Revenue Million Forecast, by Industry vertical 2019 & 2032
- Table 76: Global Oseltamivir Industry Volume K Unit Forecast, by Industry vertical 2019 & 2032
- Table 77: Global Oseltamivir Industry Revenue Million Forecast, by Country 2019 & 2032
- Table 78: Global Oseltamivir Industry Volume K Unit Forecast, by Country 2019 & 2032
- Table 79: Germany Oseltamivir Industry Revenue (Million) Forecast, by Application 2019 & 2032
- Table 80: Germany Oseltamivir Industry Volume (K Unit) Forecast, by Application 2019 & 2032
- Table 81: United Kingdom Oseltamivir Industry Revenue (Million) Forecast, by Application 2019 & 2032
- Table 82: United Kingdom Oseltamivir Industry Volume (K Unit) Forecast, by Application 2019 & 2032
- Table 83: France Oseltamivir Industry Revenue (Million) Forecast, by Application 2019 & 2032
- Table 84: France Oseltamivir Industry Volume (K Unit) Forecast, by Application 2019 & 2032
- Table 85: Italy Oseltamivir Industry Revenue (Million) Forecast, by Application 2019 & 2032
- Table 86: Italy Oseltamivir Industry Volume (K Unit) Forecast, by Application 2019 & 2032
- Table 87: Spain Oseltamivir Industry Revenue (Million) Forecast, by Application 2019 & 2032
- Table 88: Spain Oseltamivir Industry Volume (K Unit) Forecast, by Application 2019 & 2032
- Table 89: Rest of Europe Oseltamivir Industry Revenue (Million) Forecast, by Application 2019 & 2032
- Table 90: Rest of Europe Oseltamivir Industry Volume (K Unit) Forecast, by Application 2019 & 2032
- Table 91: Global Oseltamivir Industry Revenue Million Forecast, by Product Type 2019 & 2032
- Table 92: Global Oseltamivir Industry Volume K Unit Forecast, by Product Type 2019 & 2032
- Table 93: Global Oseltamivir Industry Revenue Million Forecast, by Industry vertical 2019 & 2032
- Table 94: Global Oseltamivir Industry Volume K Unit Forecast, by Industry vertical 2019 & 2032
- Table 95: Global Oseltamivir Industry Revenue Million Forecast, by Country 2019 & 2032
- Table 96: Global Oseltamivir Industry Volume K Unit Forecast, by Country 2019 & 2032
- Table 97: China Oseltamivir Industry Revenue (Million) Forecast, by Application 2019 & 2032
- Table 98: China Oseltamivir Industry Volume (K Unit) Forecast, by Application 2019 & 2032
- Table 99: Japan Oseltamivir Industry Revenue (Million) Forecast, by Application 2019 & 2032
- Table 100: Japan Oseltamivir Industry Volume (K Unit) Forecast, by Application 2019 & 2032
- Table 101: India Oseltamivir Industry Revenue (Million) Forecast, by Application 2019 & 2032
- Table 102: India Oseltamivir Industry Volume (K Unit) Forecast, by Application 2019 & 2032
- Table 103: Australia Oseltamivir Industry Revenue (Million) Forecast, by Application 2019 & 2032
- Table 104: Australia Oseltamivir Industry Volume (K Unit) Forecast, by Application 2019 & 2032
- Table 105: South Korea Oseltamivir Industry Revenue (Million) Forecast, by Application 2019 & 2032
- Table 106: South Korea Oseltamivir Industry Volume (K Unit) Forecast, by Application 2019 & 2032
- Table 107: Rest of Asia Pacific Oseltamivir Industry Revenue (Million) Forecast, by Application 2019 & 2032
- Table 108: Rest of Asia Pacific Oseltamivir Industry Volume (K Unit) Forecast, by Application 2019 & 2032
- Table 109: Global Oseltamivir Industry Revenue Million Forecast, by Product Type 2019 & 2032
- Table 110: Global Oseltamivir Industry Volume K Unit Forecast, by Product Type 2019 & 2032
- Table 111: Global Oseltamivir Industry Revenue Million Forecast, by Industry vertical 2019 & 2032
- Table 112: Global Oseltamivir Industry Volume K Unit Forecast, by Industry vertical 2019 & 2032
- Table 113: Global Oseltamivir Industry Revenue Million Forecast, by Country 2019 & 2032
- Table 114: Global Oseltamivir Industry Volume K Unit Forecast, by Country 2019 & 2032
- Table 115: GCC Oseltamivir Industry Revenue (Million) Forecast, by Application 2019 & 2032
- Table 116: GCC Oseltamivir Industry Volume (K Unit) Forecast, by Application 2019 & 2032
- Table 117: South Africa Oseltamivir Industry Revenue (Million) Forecast, by Application 2019 & 2032
- Table 118: South Africa Oseltamivir Industry Volume (K Unit) Forecast, by Application 2019 & 2032
- Table 119: Rest of Middle East and Africa Oseltamivir Industry Revenue (Million) Forecast, by Application 2019 & 2032
- Table 120: Rest of Middle East and Africa Oseltamivir Industry Volume (K Unit) Forecast, by Application 2019 & 2032
- Table 121: Global Oseltamivir Industry Revenue Million Forecast, by Product Type 2019 & 2032
- Table 122: Global Oseltamivir Industry Volume K Unit Forecast, by Product Type 2019 & 2032
- Table 123: Global Oseltamivir Industry Revenue Million Forecast, by Industry vertical 2019 & 2032
- Table 124: Global Oseltamivir Industry Volume K Unit Forecast, by Industry vertical 2019 & 2032
- Table 125: Global Oseltamivir Industry Revenue Million Forecast, by Country 2019 & 2032
- Table 126: Global Oseltamivir Industry Volume K Unit Forecast, by Country 2019 & 2032
- Table 127: Brazil Oseltamivir Industry Revenue (Million) Forecast, by Application 2019 & 2032
- Table 128: Brazil Oseltamivir Industry Volume (K Unit) Forecast, by Application 2019 & 2032
- Table 129: Argentina Oseltamivir Industry Revenue (Million) Forecast, by Application 2019 & 2032
- Table 130: Argentina Oseltamivir Industry Volume (K Unit) Forecast, by Application 2019 & 2032
- Table 131: Rest of South America Oseltamivir Industry Revenue (Million) Forecast, by Application 2019 & 2032
- Table 132: Rest of South America Oseltamivir Industry Volume (K Unit) Forecast, by Application 2019 & 2032
Frequently Asked Questions
1. What is the projected Compound Annual Growth Rate (CAGR) of the Oseltamivir Industry?
The projected CAGR is approximately 3.20%.
2. Which companies are prominent players in the Oseltamivir Industry?
Key companies in the market include Hetero Healthcare Limited, F Hoffmann-La Roche Ltd, Cipla Inc, Gilead Sciences Inc, NATCO Pharma Limited, Strides Pharma Science Limited, Amneal Pharmaceuticals LLC, Lupin Limited, Alembic Pharmaceuticals Limited, Macleods Pharmaceuticals Ltd, Zydus Cadila.
3. What are the main segments of the Oseltamivir Industry?
The market segments include Product Type, Industry vertical.
4. Can you provide details about the market size?
The market size is estimated to be USD XX Million as of 2022.
5. What are some drivers contributing to market growth?
Rising Prevalence of Influenza Virus Infections; Increase in the Number of Research and Development Activities.
6. What are the notable trends driving market growth?
Influenza A Segment Expects to Register a High CAGR Over the Forecast Period.
7. Are there any restraints impacting market growth?
Side Effects Associated with Oseltamivir Treatment.
8. Can you provide examples of recent developments in the market?
October 2021: M.D. Anderson Cancer Center initiated a Phase II clinical study on the effect of baloxavir in combination with oseltamivir in treating severe influenza infection in patients who have previously received a hematopoietic (blood) stem cell transplant.
9. What pricing options are available for accessing the report?
Pricing options include single-user, multi-user, and enterprise licenses priced at USD 4750, USD 5250, and USD 8750 respectively.
10. Is the market size provided in terms of value or volume?
The market size is provided in terms of value, measured in Million and volume, measured in K Unit.
11. Are there any specific market keywords associated with the report?
Yes, the market keyword associated with the report is "Oseltamivir Industry," which aids in identifying and referencing the specific market segment covered.
12. How do I determine which pricing option suits my needs best?
The pricing options vary based on user requirements and access needs. Individual users may opt for single-user licenses, while businesses requiring broader access may choose multi-user or enterprise licenses for cost-effective access to the report.
13. Are there any additional resources or data provided in the Oseltamivir Industry report?
While the report offers comprehensive insights, it's advisable to review the specific contents or supplementary materials provided to ascertain if additional resources or data are available.
14. How can I stay updated on further developments or reports in the Oseltamivir Industry?
To stay informed about further developments, trends, and reports in the Oseltamivir Industry, consider subscribing to industry newsletters, following relevant companies and organizations, or regularly checking reputable industry news sources and publications.
Methodology
Step 1 - Identification of Relevant Samples Size from Population Database


Step 2 - Approaches for Defining Global Market Size (Value, Volume* & Price*)

Note*: In applicable scenarios
Step 3 - Data Sources
Primary Research
- Web Analytics
- Survey Reports
- Research Institute
- Latest Research Reports
- Opinion Leaders
Secondary Research
- Annual Reports
- White Paper
- Latest Press Release
- Industry Association
- Paid Database
- Investor Presentations

Step 4 - Data Triangulation
Involves using different sources of information in order to increase the validity of a study
These sources are likely to be stakeholders in a program - participants, other researchers, program staff, other community members, and so on.
Then we put all data in single framework & apply various statistical tools to find out the dynamic on the market.
During the analysis stage, feedback from the stakeholder groups would be compared to determine areas of agreement as well as areas of divergence
