

Key Insights
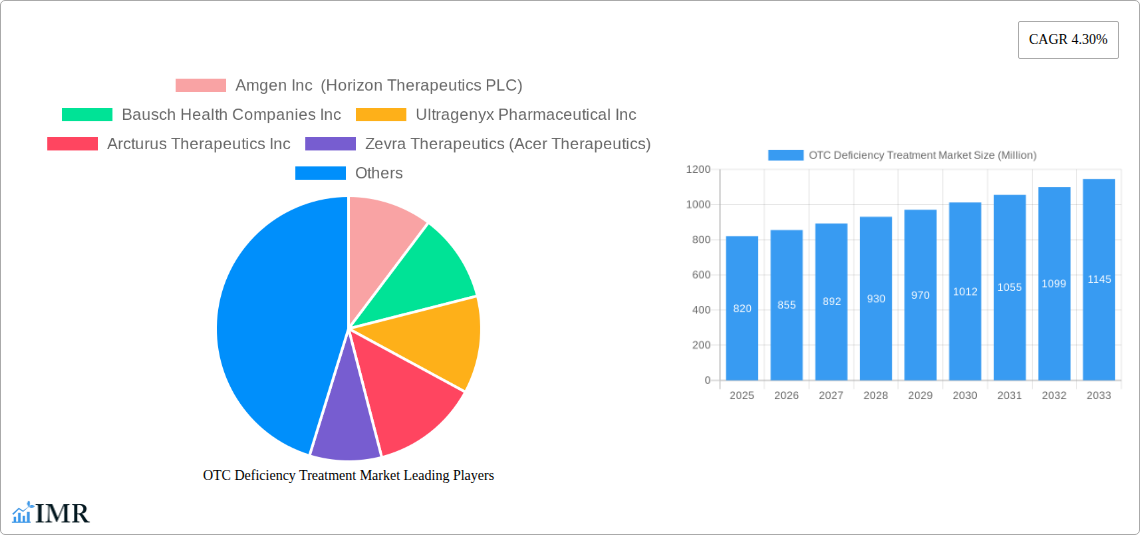
The over-the-counter (OTC) deficiency treatment market, valued at $820 million in 2025, is projected to experience robust growth, driven by increasing awareness of nutritional deficiencies and a rising preference for self-care solutions. The market's 4.30% CAGR from 2025 to 2033 indicates a significant expansion, fueled by several key factors. The aging global population, with its increased susceptibility to nutrient deficiencies, is a major driver. Furthermore, the growing prevalence of lifestyle diseases linked to poor nutrition, such as cardiovascular disease and diabetes, is creating a considerable demand for OTC supplements addressing specific deficiencies. Convenience and accessibility of OTC treatments compared to prescription medications further contribute to market growth. The market is segmented by deficiency type (e.g., vitamin D, iron, calcium), product form (tablets, capsules, liquids), and distribution channel (pharmacies, supermarkets, online retailers). Competitive landscape analysis reveals key players including Amgen, Bausch Health, and Abbott, alongside numerous smaller specialized companies constantly innovating with new formulations and delivery systems. Challenges remain, however, including regulatory hurdles in certain regions and ensuring product quality and efficacy.
The forecast period of 2025-2033 anticipates considerable market diversification. We expect to see increased product innovation, including targeted formulations for specific demographic groups and the incorporation of functional foods and beverages into the market. The rise of e-commerce and direct-to-consumer marketing will transform distribution channels, potentially leading to increased competition. Companies are likely to invest in research and development to bring novel deficiency treatments to the market, further fueling the growth trajectory. The market will likely witness a consolidation trend, with larger players acquiring smaller companies to strengthen their market share. The emphasis will continue to be on evidence-based formulations and transparent labeling to meet evolving consumer expectations regarding safety and efficacy.
OTC Deficiency Treatment Market: A Comprehensive Market Report (2019-2033)
This comprehensive report provides an in-depth analysis of the OTC Deficiency Treatment Market, encompassing market dynamics, growth trends, regional analysis, product landscape, key players, and future outlook. The report covers the period from 2019 to 2033, with 2025 as the base year and a forecast period from 2025 to 2033. The parent market is the broader Rare Disease Treatment Market, while the child market focuses specifically on OTC Deficiency Treatment. The global market size is estimated at xx Million in 2025.
OTC Deficiency Treatment Market Market Dynamics & Structure
The OTC Deficiency Treatment Market is characterized by a moderately concentrated landscape, with several key players dominating the market share. Technological innovation, particularly in targeted therapies and drug delivery systems, is a significant driver of market growth. Stringent regulatory frameworks, including FDA approvals, pose challenges but ensure treatment safety and efficacy. The market faces competition from alternative therapies and supportive care, impacting overall adoption. End-user demographics, primarily patients with urea cycle disorders (UCDs), influence market demand. Recent mergers and acquisitions (M&A) activity significantly shapes the competitive landscape.
- Market Concentration: Moderately concentrated, with top 5 players holding approximately xx% market share in 2025.
- Technological Innovation: Focus on targeted therapies, improved drug delivery systems (e.g., oral suspensions), and personalized medicine.
- Regulatory Framework: Stringent FDA approvals and other global regulatory requirements impacting market entry and product lifecycle.
- Competitive Substitutes: Alternative therapies and supportive care impacting market penetration.
- End-User Demographics: Primarily patients diagnosed with UCDs, with varying age ranges and disease severity influencing treatment needs.
- M&A Trends: Significant activity observed in recent years, reshaping market dynamics and competitive positioning (e.g., Amgen’s acquisition of Horizon Therapeutics). An estimated xx M&A deals occurred between 2019 and 2024.
OTC Deficiency Treatment Market Growth Trends & Insights
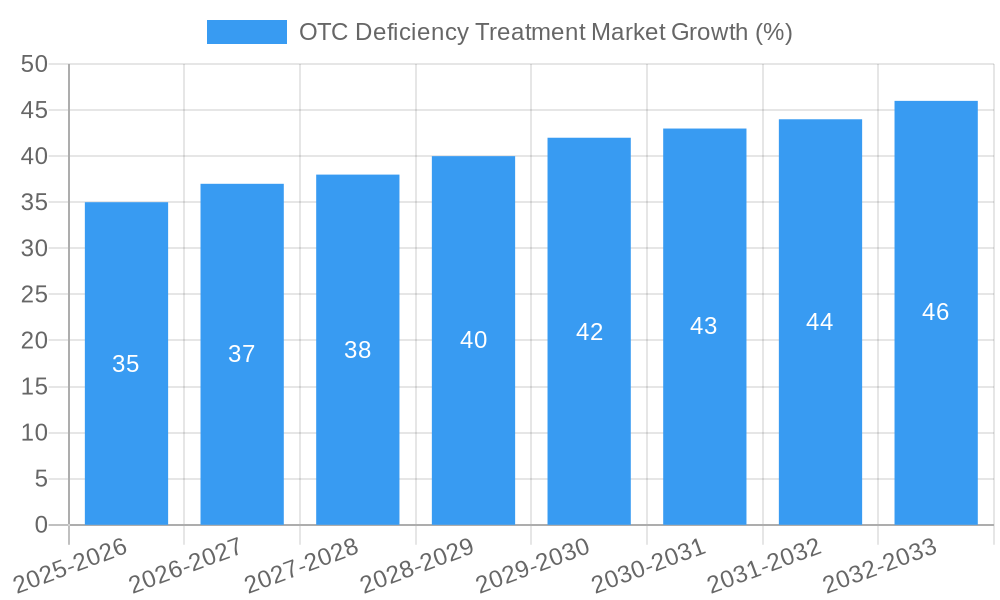
The OTC Deficiency Treatment Market is projected to exhibit robust growth over the forecast period (2025-2033). Driven by increasing prevalence of UCDs, rising awareness of OTC deficiency, and advancements in therapeutic options, the market is poised for expansion. The CAGR is estimated at xx% from 2025 to 2033. Market penetration is expected to increase, particularly in developing regions with improved healthcare infrastructure and access to specialized treatments. Technological disruptions, such as the development of novel therapies and advanced diagnostic tools, further accelerate market growth. Shifting consumer preferences towards personalized medicine and improved patient outcomes also contribute to the market's expansion.
Dominant Regions, Countries, or Segments in OTC Deficiency Treatment Market
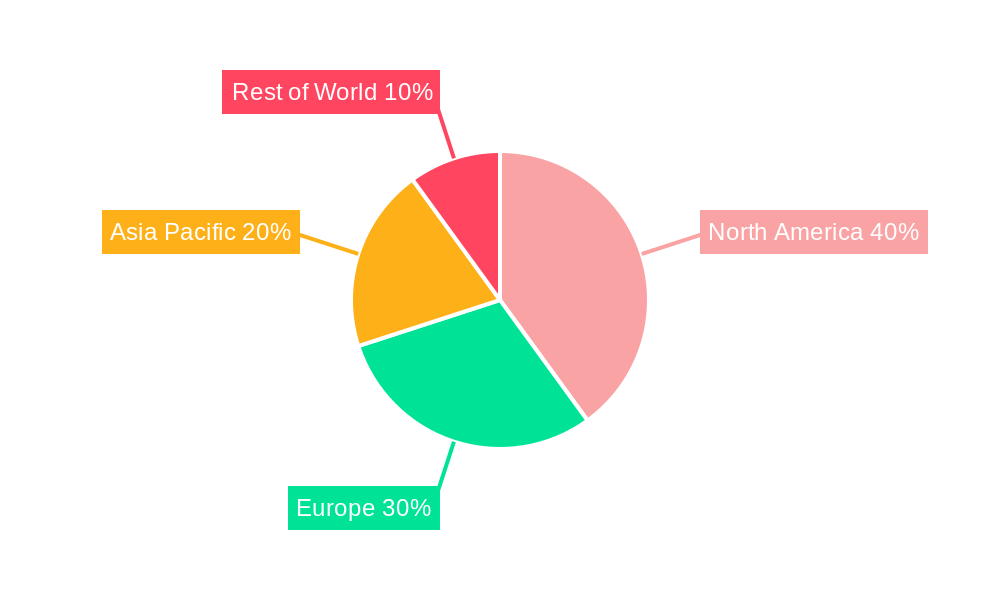
North America currently dominates the OTC Deficiency Treatment Market, owing to factors such as well-established healthcare infrastructure, high healthcare expenditure, and advanced diagnostic capabilities. Europe holds a significant market share, driven by increasing prevalence of UCDs and favorable regulatory environments. Asia-Pacific demonstrates high growth potential due to rising healthcare awareness and increasing disposable incomes.
- North America: Strong market presence due to advanced healthcare infrastructure, higher healthcare expenditure, and a large patient pool.
- Europe: Significant market share due to increasing disease prevalence and favorable regulatory environment.
- Asia-Pacific: High growth potential owing to rising healthcare awareness and improving healthcare access.
- Key Drivers: Increasing prevalence of UCDs, rising healthcare expenditure, technological advancements, and favorable government policies.
OTC Deficiency Treatment Market Product Landscape
The OTC Deficiency Treatment Market offers a range of products, including oral suspensions, specialized diets, and other supportive therapies. Recent innovations focus on improving drug efficacy, reducing side effects, and enhancing patient compliance. Products are differentiated based on their unique mechanisms of action, dosage forms, and delivery systems. Key performance metrics include efficacy, safety, patient tolerability, and cost-effectiveness.
Key Drivers, Barriers & Challenges in OTC Deficiency Treatment Market
Key Drivers:
- Increasing prevalence of UCDs globally.
- Advances in therapeutic options and diagnostic technologies.
- Rising healthcare expenditure and insurance coverage.
- Growing awareness among patients and healthcare professionals.
Challenges & Restraints:
- High cost of treatment and limited access in developing regions.
- Stringent regulatory pathways and approval processes.
- Competition from alternative treatment options.
- Potential side effects associated with certain therapies.
Emerging Opportunities in OTC Deficiency Treatment Market
- Untapped markets in developing countries.
- Development of novel therapies with improved efficacy and safety.
- Personalized medicine approaches for improved patient outcomes.
- Growing demand for telemedicine and remote patient monitoring.
Growth Accelerators in the OTC Deficiency Treatment Market Industry
Long-term growth in the OTC Deficiency Treatment Market will be fueled by continued technological advancements in drug development and delivery, strategic partnerships between pharmaceutical companies and research institutions, and expansion into new geographical markets with unmet medical needs. Early diagnosis initiatives and increased patient advocacy will also contribute to sustained growth.
Key Players Shaping the OTC Deficiency Treatment Market Market
- Amgen Inc (Horizon Therapeutics PLC)
- Bausch Health Companies Inc
- Ultragenyx Pharmaceutical Inc
- Arcturus Therapeutics Inc
- Zevra Therapeutics (Acer Therapeutics)
- iECURE
- Danone Group (Nutricia)
- Abbott
- Reckitt Benckiser
- Nestle
- Moderna Inc
- Duchesnay Pharmaceutical Group-DPG(Medunik USA)
- Eurocept Pharmaceuticals Holding (Lucane Pharma)
- List Not Exhaustive
Notable Milestones in OTC Deficiency Treatment Market Sector
- December 2022: FDA approval of OLPRUVA (sodium phenylbutyrate) for oral suspension for urea cycle disorders, including OTC deficiency.
- October 2023: Amgen's acquisition of Horizon Therapeutics PLC, strengthening Amgen's position in rare disease treatments.
- November 2023: Zevra Therapeutics Inc. acquired Acer Therapeutics Inc., expanding its portfolio of rare disease treatments.
In-Depth OTC Deficiency Treatment Market Market Outlook
The OTC Deficiency Treatment Market exhibits significant growth potential driven by ongoing research and development, increasing disease awareness, and expanding access to healthcare services. Strategic partnerships, focusing on drug discovery and commercialization, will play a crucial role in shaping the market's future. The market is expected to witness the emergence of innovative therapies, personalized medicine approaches, and improved diagnostic tools, further accelerating market growth and enhancing patient outcomes.
OTC Deficiency Treatment Market Segmentation
-
1. Treatment Type
- 1.1. Glycerol Phenylbutyrate
- 1.2. Sodium Phenylbutyrate
- 1.3. Sodium Phenylacetate and Sodium Benzoate
- 1.4. Other Tr
-
2. Route of Administration
- 2.1. Oral
- 2.2. Intravenous
-
3. Distribution Channel
- 3.1. Hospital Pharmacies
- 3.2. Retail Pharmacies
- 3.3. Online Pharmacies
- 3.4. Other Di
OTC Deficiency Treatment Market Segmentation By Geography
-
1. North America
- 1.1. United States
- 1.2. Canada
- 1.3. Mexico
-
2. Europe
- 2.1. Germany
- 2.2. United Kingdom
- 2.3. France
- 2.4. Italy
- 2.5. Spain
- 2.6. Rest of Europe
-
3. Asia Pacific
- 3.1. China
- 3.2. Japan
- 3.3. India
- 3.4. Australia
- 3.5. South Korea
- 3.6. Rest of Asia Pacific
- 4. Rest of the World
OTC Deficiency Treatment Market REPORT HIGHLIGHTS
| Aspects | Details |
|---|---|
| Study Period | 2019-2033 |
| Base Year | 2024 |
| Estimated Year | 2025 |
| Forecast Period | 2025-2033 |
| Historical Period | 2019-2024 |
| Growth Rate | CAGR of 4.30% from 2019-2033 |
| Segmentation |
|
Table of Contents
- 1. Introduction
- 1.1. Research Scope
- 1.2. Market Segmentation
- 1.3. Research Methodology
- 1.4. Definitions and Assumptions
- 2. Executive Summary
- 2.1. Introduction
- 3. Market Dynamics
- 3.1. Introduction
- 3.2. Market Drivers
- 3.2.1. Rising Product Approvals With Novel Pipeline Products for Ornithine Transcarbamylase (OTC) Deficiency Treatment; Growing Awareness for Disease with Campaigns Organized by Public and Private Entities; Favorable Reimbursement Scenario and Patient Assistance Programs
- 3.3. Market Restrains
- 3.3.1. Rising Product Approvals With Novel Pipeline Products for Ornithine Transcarbamylase (OTC) Deficiency Treatment; Growing Awareness for Disease with Campaigns Organized by Public and Private Entities; Favorable Reimbursement Scenario and Patient Assistance Programs
- 3.4. Market Trends
- 3.4.1. The Glycerol Phenylbutyrate Segment is Expected to Witness Significant Growth During the Forecast Period
- 4. Market Factor Analysis
- 4.1. Porters Five Forces
- 4.2. Supply/Value Chain
- 4.3. PESTEL analysis
- 4.4. Market Entropy
- 4.5. Patent/Trademark Analysis
- 5. Global OTC Deficiency Treatment Market Analysis, Insights and Forecast, 2019-2031
- 5.1. Market Analysis, Insights and Forecast - by Treatment Type
- 5.1.1. Glycerol Phenylbutyrate
- 5.1.2. Sodium Phenylbutyrate
- 5.1.3. Sodium Phenylacetate and Sodium Benzoate
- 5.1.4. Other Tr
- 5.2. Market Analysis, Insights and Forecast - by Route of Administration
- 5.2.1. Oral
- 5.2.2. Intravenous
- 5.3. Market Analysis, Insights and Forecast - by Distribution Channel
- 5.3.1. Hospital Pharmacies
- 5.3.2. Retail Pharmacies
- 5.3.3. Online Pharmacies
- 5.3.4. Other Di
- 5.4. Market Analysis, Insights and Forecast - by Region
- 5.4.1. North America
- 5.4.2. Europe
- 5.4.3. Asia Pacific
- 5.4.4. Rest of the World
- 5.1. Market Analysis, Insights and Forecast - by Treatment Type
- 6. North America OTC Deficiency Treatment Market Analysis, Insights and Forecast, 2019-2031
- 6.1. Market Analysis, Insights and Forecast - by Treatment Type
- 6.1.1. Glycerol Phenylbutyrate
- 6.1.2. Sodium Phenylbutyrate
- 6.1.3. Sodium Phenylacetate and Sodium Benzoate
- 6.1.4. Other Tr
- 6.2. Market Analysis, Insights and Forecast - by Route of Administration
- 6.2.1. Oral
- 6.2.2. Intravenous
- 6.3. Market Analysis, Insights and Forecast - by Distribution Channel
- 6.3.1. Hospital Pharmacies
- 6.3.2. Retail Pharmacies
- 6.3.3. Online Pharmacies
- 6.3.4. Other Di
- 6.1. Market Analysis, Insights and Forecast - by Treatment Type
- 7. Europe OTC Deficiency Treatment Market Analysis, Insights and Forecast, 2019-2031
- 7.1. Market Analysis, Insights and Forecast - by Treatment Type
- 7.1.1. Glycerol Phenylbutyrate
- 7.1.2. Sodium Phenylbutyrate
- 7.1.3. Sodium Phenylacetate and Sodium Benzoate
- 7.1.4. Other Tr
- 7.2. Market Analysis, Insights and Forecast - by Route of Administration
- 7.2.1. Oral
- 7.2.2. Intravenous
- 7.3. Market Analysis, Insights and Forecast - by Distribution Channel
- 7.3.1. Hospital Pharmacies
- 7.3.2. Retail Pharmacies
- 7.3.3. Online Pharmacies
- 7.3.4. Other Di
- 7.1. Market Analysis, Insights and Forecast - by Treatment Type
- 8. Asia Pacific OTC Deficiency Treatment Market Analysis, Insights and Forecast, 2019-2031
- 8.1. Market Analysis, Insights and Forecast - by Treatment Type
- 8.1.1. Glycerol Phenylbutyrate
- 8.1.2. Sodium Phenylbutyrate
- 8.1.3. Sodium Phenylacetate and Sodium Benzoate
- 8.1.4. Other Tr
- 8.2. Market Analysis, Insights and Forecast - by Route of Administration
- 8.2.1. Oral
- 8.2.2. Intravenous
- 8.3. Market Analysis, Insights and Forecast - by Distribution Channel
- 8.3.1. Hospital Pharmacies
- 8.3.2. Retail Pharmacies
- 8.3.3. Online Pharmacies
- 8.3.4. Other Di
- 8.1. Market Analysis, Insights and Forecast - by Treatment Type
- 9. Rest of the World OTC Deficiency Treatment Market Analysis, Insights and Forecast, 2019-2031
- 9.1. Market Analysis, Insights and Forecast - by Treatment Type
- 9.1.1. Glycerol Phenylbutyrate
- 9.1.2. Sodium Phenylbutyrate
- 9.1.3. Sodium Phenylacetate and Sodium Benzoate
- 9.1.4. Other Tr
- 9.2. Market Analysis, Insights and Forecast - by Route of Administration
- 9.2.1. Oral
- 9.2.2. Intravenous
- 9.3. Market Analysis, Insights and Forecast - by Distribution Channel
- 9.3.1. Hospital Pharmacies
- 9.3.2. Retail Pharmacies
- 9.3.3. Online Pharmacies
- 9.3.4. Other Di
- 9.1. Market Analysis, Insights and Forecast - by Treatment Type
- 10. Competitive Analysis
- 10.1. Global Market Share Analysis 2024
- 10.2. Company Profiles
- 10.2.1 Amgen Inc (Horizon Therapeutics PLC)
- 10.2.1.1. Overview
- 10.2.1.2. Products
- 10.2.1.3. SWOT Analysis
- 10.2.1.4. Recent Developments
- 10.2.1.5. Financials (Based on Availability)
- 10.2.2 Bausch Health Companies Inc
- 10.2.2.1. Overview
- 10.2.2.2. Products
- 10.2.2.3. SWOT Analysis
- 10.2.2.4. Recent Developments
- 10.2.2.5. Financials (Based on Availability)
- 10.2.3 Ultragenyx Pharmaceutical Inc
- 10.2.3.1. Overview
- 10.2.3.2. Products
- 10.2.3.3. SWOT Analysis
- 10.2.3.4. Recent Developments
- 10.2.3.5. Financials (Based on Availability)
- 10.2.4 Arcturus Therapeutics Inc
- 10.2.4.1. Overview
- 10.2.4.2. Products
- 10.2.4.3. SWOT Analysis
- 10.2.4.4. Recent Developments
- 10.2.4.5. Financials (Based on Availability)
- 10.2.5 Zevra Therapeutics (Acer Therapeutics)
- 10.2.5.1. Overview
- 10.2.5.2. Products
- 10.2.5.3. SWOT Analysis
- 10.2.5.4. Recent Developments
- 10.2.5.5. Financials (Based on Availability)
- 10.2.6 iECURE
- 10.2.6.1. Overview
- 10.2.6.2. Products
- 10.2.6.3. SWOT Analysis
- 10.2.6.4. Recent Developments
- 10.2.6.5. Financials (Based on Availability)
- 10.2.7 Danone Group (Nutricia)
- 10.2.7.1. Overview
- 10.2.7.2. Products
- 10.2.7.3. SWOT Analysis
- 10.2.7.4. Recent Developments
- 10.2.7.5. Financials (Based on Availability)
- 10.2.8 Abbott
- 10.2.8.1. Overview
- 10.2.8.2. Products
- 10.2.8.3. SWOT Analysis
- 10.2.8.4. Recent Developments
- 10.2.8.5. Financials (Based on Availability)
- 10.2.9 Reckitt Benckiser
- 10.2.9.1. Overview
- 10.2.9.2. Products
- 10.2.9.3. SWOT Analysis
- 10.2.9.4. Recent Developments
- 10.2.9.5. Financials (Based on Availability)
- 10.2.10 Nestle
- 10.2.10.1. Overview
- 10.2.10.2. Products
- 10.2.10.3. SWOT Analysis
- 10.2.10.4. Recent Developments
- 10.2.10.5. Financials (Based on Availability)
- 10.2.11 Moderna Inc
- 10.2.11.1. Overview
- 10.2.11.2. Products
- 10.2.11.3. SWOT Analysis
- 10.2.11.4. Recent Developments
- 10.2.11.5. Financials (Based on Availability)
- 10.2.12 Duchesnay Pharmaceutical Group-DPG(Medunik�USA)
- 10.2.12.1. Overview
- 10.2.12.2. Products
- 10.2.12.3. SWOT Analysis
- 10.2.12.4. Recent Developments
- 10.2.12.5. Financials (Based on Availability)
- 10.2.13 Eurocept Pharmaceuticals Holding (Lucane Pharma)*List Not Exhaustive
- 10.2.13.1. Overview
- 10.2.13.2. Products
- 10.2.13.3. SWOT Analysis
- 10.2.13.4. Recent Developments
- 10.2.13.5. Financials (Based on Availability)
- 10.2.1 Amgen Inc (Horizon Therapeutics PLC)
List of Figures
- Figure 1: Global OTC Deficiency Treatment Market Revenue Breakdown (Million, %) by Region 2024 & 2032
- Figure 2: Global OTC Deficiency Treatment Market Volume Breakdown (Billion, %) by Region 2024 & 2032
- Figure 3: North America OTC Deficiency Treatment Market Revenue (Million), by Treatment Type 2024 & 2032
- Figure 4: North America OTC Deficiency Treatment Market Volume (Billion), by Treatment Type 2024 & 2032
- Figure 5: North America OTC Deficiency Treatment Market Revenue Share (%), by Treatment Type 2024 & 2032
- Figure 6: North America OTC Deficiency Treatment Market Volume Share (%), by Treatment Type 2024 & 2032
- Figure 7: North America OTC Deficiency Treatment Market Revenue (Million), by Route of Administration 2024 & 2032
- Figure 8: North America OTC Deficiency Treatment Market Volume (Billion), by Route of Administration 2024 & 2032
- Figure 9: North America OTC Deficiency Treatment Market Revenue Share (%), by Route of Administration 2024 & 2032
- Figure 10: North America OTC Deficiency Treatment Market Volume Share (%), by Route of Administration 2024 & 2032
- Figure 11: North America OTC Deficiency Treatment Market Revenue (Million), by Distribution Channel 2024 & 2032
- Figure 12: North America OTC Deficiency Treatment Market Volume (Billion), by Distribution Channel 2024 & 2032
- Figure 13: North America OTC Deficiency Treatment Market Revenue Share (%), by Distribution Channel 2024 & 2032
- Figure 14: North America OTC Deficiency Treatment Market Volume Share (%), by Distribution Channel 2024 & 2032
- Figure 15: North America OTC Deficiency Treatment Market Revenue (Million), by Country 2024 & 2032
- Figure 16: North America OTC Deficiency Treatment Market Volume (Billion), by Country 2024 & 2032
- Figure 17: North America OTC Deficiency Treatment Market Revenue Share (%), by Country 2024 & 2032
- Figure 18: North America OTC Deficiency Treatment Market Volume Share (%), by Country 2024 & 2032
- Figure 19: Europe OTC Deficiency Treatment Market Revenue (Million), by Treatment Type 2024 & 2032
- Figure 20: Europe OTC Deficiency Treatment Market Volume (Billion), by Treatment Type 2024 & 2032
- Figure 21: Europe OTC Deficiency Treatment Market Revenue Share (%), by Treatment Type 2024 & 2032
- Figure 22: Europe OTC Deficiency Treatment Market Volume Share (%), by Treatment Type 2024 & 2032
- Figure 23: Europe OTC Deficiency Treatment Market Revenue (Million), by Route of Administration 2024 & 2032
- Figure 24: Europe OTC Deficiency Treatment Market Volume (Billion), by Route of Administration 2024 & 2032
- Figure 25: Europe OTC Deficiency Treatment Market Revenue Share (%), by Route of Administration 2024 & 2032
- Figure 26: Europe OTC Deficiency Treatment Market Volume Share (%), by Route of Administration 2024 & 2032
- Figure 27: Europe OTC Deficiency Treatment Market Revenue (Million), by Distribution Channel 2024 & 2032
- Figure 28: Europe OTC Deficiency Treatment Market Volume (Billion), by Distribution Channel 2024 & 2032
- Figure 29: Europe OTC Deficiency Treatment Market Revenue Share (%), by Distribution Channel 2024 & 2032
- Figure 30: Europe OTC Deficiency Treatment Market Volume Share (%), by Distribution Channel 2024 & 2032
- Figure 31: Europe OTC Deficiency Treatment Market Revenue (Million), by Country 2024 & 2032
- Figure 32: Europe OTC Deficiency Treatment Market Volume (Billion), by Country 2024 & 2032
- Figure 33: Europe OTC Deficiency Treatment Market Revenue Share (%), by Country 2024 & 2032
- Figure 34: Europe OTC Deficiency Treatment Market Volume Share (%), by Country 2024 & 2032
- Figure 35: Asia Pacific OTC Deficiency Treatment Market Revenue (Million), by Treatment Type 2024 & 2032
- Figure 36: Asia Pacific OTC Deficiency Treatment Market Volume (Billion), by Treatment Type 2024 & 2032
- Figure 37: Asia Pacific OTC Deficiency Treatment Market Revenue Share (%), by Treatment Type 2024 & 2032
- Figure 38: Asia Pacific OTC Deficiency Treatment Market Volume Share (%), by Treatment Type 2024 & 2032
- Figure 39: Asia Pacific OTC Deficiency Treatment Market Revenue (Million), by Route of Administration 2024 & 2032
- Figure 40: Asia Pacific OTC Deficiency Treatment Market Volume (Billion), by Route of Administration 2024 & 2032
- Figure 41: Asia Pacific OTC Deficiency Treatment Market Revenue Share (%), by Route of Administration 2024 & 2032
- Figure 42: Asia Pacific OTC Deficiency Treatment Market Volume Share (%), by Route of Administration 2024 & 2032
- Figure 43: Asia Pacific OTC Deficiency Treatment Market Revenue (Million), by Distribution Channel 2024 & 2032
- Figure 44: Asia Pacific OTC Deficiency Treatment Market Volume (Billion), by Distribution Channel 2024 & 2032
- Figure 45: Asia Pacific OTC Deficiency Treatment Market Revenue Share (%), by Distribution Channel 2024 & 2032
- Figure 46: Asia Pacific OTC Deficiency Treatment Market Volume Share (%), by Distribution Channel 2024 & 2032
- Figure 47: Asia Pacific OTC Deficiency Treatment Market Revenue (Million), by Country 2024 & 2032
- Figure 48: Asia Pacific OTC Deficiency Treatment Market Volume (Billion), by Country 2024 & 2032
- Figure 49: Asia Pacific OTC Deficiency Treatment Market Revenue Share (%), by Country 2024 & 2032
- Figure 50: Asia Pacific OTC Deficiency Treatment Market Volume Share (%), by Country 2024 & 2032
- Figure 51: Rest of the World OTC Deficiency Treatment Market Revenue (Million), by Treatment Type 2024 & 2032
- Figure 52: Rest of the World OTC Deficiency Treatment Market Volume (Billion), by Treatment Type 2024 & 2032
- Figure 53: Rest of the World OTC Deficiency Treatment Market Revenue Share (%), by Treatment Type 2024 & 2032
- Figure 54: Rest of the World OTC Deficiency Treatment Market Volume Share (%), by Treatment Type 2024 & 2032
- Figure 55: Rest of the World OTC Deficiency Treatment Market Revenue (Million), by Route of Administration 2024 & 2032
- Figure 56: Rest of the World OTC Deficiency Treatment Market Volume (Billion), by Route of Administration 2024 & 2032
- Figure 57: Rest of the World OTC Deficiency Treatment Market Revenue Share (%), by Route of Administration 2024 & 2032
- Figure 58: Rest of the World OTC Deficiency Treatment Market Volume Share (%), by Route of Administration 2024 & 2032
- Figure 59: Rest of the World OTC Deficiency Treatment Market Revenue (Million), by Distribution Channel 2024 & 2032
- Figure 60: Rest of the World OTC Deficiency Treatment Market Volume (Billion), by Distribution Channel 2024 & 2032
- Figure 61: Rest of the World OTC Deficiency Treatment Market Revenue Share (%), by Distribution Channel 2024 & 2032
- Figure 62: Rest of the World OTC Deficiency Treatment Market Volume Share (%), by Distribution Channel 2024 & 2032
- Figure 63: Rest of the World OTC Deficiency Treatment Market Revenue (Million), by Country 2024 & 2032
- Figure 64: Rest of the World OTC Deficiency Treatment Market Volume (Billion), by Country 2024 & 2032
- Figure 65: Rest of the World OTC Deficiency Treatment Market Revenue Share (%), by Country 2024 & 2032
- Figure 66: Rest of the World OTC Deficiency Treatment Market Volume Share (%), by Country 2024 & 2032
List of Tables
- Table 1: Global OTC Deficiency Treatment Market Revenue Million Forecast, by Region 2019 & 2032
- Table 2: Global OTC Deficiency Treatment Market Volume Billion Forecast, by Region 2019 & 2032
- Table 3: Global OTC Deficiency Treatment Market Revenue Million Forecast, by Treatment Type 2019 & 2032
- Table 4: Global OTC Deficiency Treatment Market Volume Billion Forecast, by Treatment Type 2019 & 2032
- Table 5: Global OTC Deficiency Treatment Market Revenue Million Forecast, by Route of Administration 2019 & 2032
- Table 6: Global OTC Deficiency Treatment Market Volume Billion Forecast, by Route of Administration 2019 & 2032
- Table 7: Global OTC Deficiency Treatment Market Revenue Million Forecast, by Distribution Channel 2019 & 2032
- Table 8: Global OTC Deficiency Treatment Market Volume Billion Forecast, by Distribution Channel 2019 & 2032
- Table 9: Global OTC Deficiency Treatment Market Revenue Million Forecast, by Region 2019 & 2032
- Table 10: Global OTC Deficiency Treatment Market Volume Billion Forecast, by Region 2019 & 2032
- Table 11: Global OTC Deficiency Treatment Market Revenue Million Forecast, by Treatment Type 2019 & 2032
- Table 12: Global OTC Deficiency Treatment Market Volume Billion Forecast, by Treatment Type 2019 & 2032
- Table 13: Global OTC Deficiency Treatment Market Revenue Million Forecast, by Route of Administration 2019 & 2032
- Table 14: Global OTC Deficiency Treatment Market Volume Billion Forecast, by Route of Administration 2019 & 2032
- Table 15: Global OTC Deficiency Treatment Market Revenue Million Forecast, by Distribution Channel 2019 & 2032
- Table 16: Global OTC Deficiency Treatment Market Volume Billion Forecast, by Distribution Channel 2019 & 2032
- Table 17: Global OTC Deficiency Treatment Market Revenue Million Forecast, by Country 2019 & 2032
- Table 18: Global OTC Deficiency Treatment Market Volume Billion Forecast, by Country 2019 & 2032
- Table 19: United States OTC Deficiency Treatment Market Revenue (Million) Forecast, by Application 2019 & 2032
- Table 20: United States OTC Deficiency Treatment Market Volume (Billion) Forecast, by Application 2019 & 2032
- Table 21: Canada OTC Deficiency Treatment Market Revenue (Million) Forecast, by Application 2019 & 2032
- Table 22: Canada OTC Deficiency Treatment Market Volume (Billion) Forecast, by Application 2019 & 2032
- Table 23: Mexico OTC Deficiency Treatment Market Revenue (Million) Forecast, by Application 2019 & 2032
- Table 24: Mexico OTC Deficiency Treatment Market Volume (Billion) Forecast, by Application 2019 & 2032
- Table 25: Global OTC Deficiency Treatment Market Revenue Million Forecast, by Treatment Type 2019 & 2032
- Table 26: Global OTC Deficiency Treatment Market Volume Billion Forecast, by Treatment Type 2019 & 2032
- Table 27: Global OTC Deficiency Treatment Market Revenue Million Forecast, by Route of Administration 2019 & 2032
- Table 28: Global OTC Deficiency Treatment Market Volume Billion Forecast, by Route of Administration 2019 & 2032
- Table 29: Global OTC Deficiency Treatment Market Revenue Million Forecast, by Distribution Channel 2019 & 2032
- Table 30: Global OTC Deficiency Treatment Market Volume Billion Forecast, by Distribution Channel 2019 & 2032
- Table 31: Global OTC Deficiency Treatment Market Revenue Million Forecast, by Country 2019 & 2032
- Table 32: Global OTC Deficiency Treatment Market Volume Billion Forecast, by Country 2019 & 2032
- Table 33: Germany OTC Deficiency Treatment Market Revenue (Million) Forecast, by Application 2019 & 2032
- Table 34: Germany OTC Deficiency Treatment Market Volume (Billion) Forecast, by Application 2019 & 2032
- Table 35: United Kingdom OTC Deficiency Treatment Market Revenue (Million) Forecast, by Application 2019 & 2032
- Table 36: United Kingdom OTC Deficiency Treatment Market Volume (Billion) Forecast, by Application 2019 & 2032
- Table 37: France OTC Deficiency Treatment Market Revenue (Million) Forecast, by Application 2019 & 2032
- Table 38: France OTC Deficiency Treatment Market Volume (Billion) Forecast, by Application 2019 & 2032
- Table 39: Italy OTC Deficiency Treatment Market Revenue (Million) Forecast, by Application 2019 & 2032
- Table 40: Italy OTC Deficiency Treatment Market Volume (Billion) Forecast, by Application 2019 & 2032
- Table 41: Spain OTC Deficiency Treatment Market Revenue (Million) Forecast, by Application 2019 & 2032
- Table 42: Spain OTC Deficiency Treatment Market Volume (Billion) Forecast, by Application 2019 & 2032
- Table 43: Rest of Europe OTC Deficiency Treatment Market Revenue (Million) Forecast, by Application 2019 & 2032
- Table 44: Rest of Europe OTC Deficiency Treatment Market Volume (Billion) Forecast, by Application 2019 & 2032
- Table 45: Global OTC Deficiency Treatment Market Revenue Million Forecast, by Treatment Type 2019 & 2032
- Table 46: Global OTC Deficiency Treatment Market Volume Billion Forecast, by Treatment Type 2019 & 2032
- Table 47: Global OTC Deficiency Treatment Market Revenue Million Forecast, by Route of Administration 2019 & 2032
- Table 48: Global OTC Deficiency Treatment Market Volume Billion Forecast, by Route of Administration 2019 & 2032
- Table 49: Global OTC Deficiency Treatment Market Revenue Million Forecast, by Distribution Channel 2019 & 2032
- Table 50: Global OTC Deficiency Treatment Market Volume Billion Forecast, by Distribution Channel 2019 & 2032
- Table 51: Global OTC Deficiency Treatment Market Revenue Million Forecast, by Country 2019 & 2032
- Table 52: Global OTC Deficiency Treatment Market Volume Billion Forecast, by Country 2019 & 2032
- Table 53: China OTC Deficiency Treatment Market Revenue (Million) Forecast, by Application 2019 & 2032
- Table 54: China OTC Deficiency Treatment Market Volume (Billion) Forecast, by Application 2019 & 2032
- Table 55: Japan OTC Deficiency Treatment Market Revenue (Million) Forecast, by Application 2019 & 2032
- Table 56: Japan OTC Deficiency Treatment Market Volume (Billion) Forecast, by Application 2019 & 2032
- Table 57: India OTC Deficiency Treatment Market Revenue (Million) Forecast, by Application 2019 & 2032
- Table 58: India OTC Deficiency Treatment Market Volume (Billion) Forecast, by Application 2019 & 2032
- Table 59: Australia OTC Deficiency Treatment Market Revenue (Million) Forecast, by Application 2019 & 2032
- Table 60: Australia OTC Deficiency Treatment Market Volume (Billion) Forecast, by Application 2019 & 2032
- Table 61: South Korea OTC Deficiency Treatment Market Revenue (Million) Forecast, by Application 2019 & 2032
- Table 62: South Korea OTC Deficiency Treatment Market Volume (Billion) Forecast, by Application 2019 & 2032
- Table 63: Rest of Asia Pacific OTC Deficiency Treatment Market Revenue (Million) Forecast, by Application 2019 & 2032
- Table 64: Rest of Asia Pacific OTC Deficiency Treatment Market Volume (Billion) Forecast, by Application 2019 & 2032
- Table 65: Global OTC Deficiency Treatment Market Revenue Million Forecast, by Treatment Type 2019 & 2032
- Table 66: Global OTC Deficiency Treatment Market Volume Billion Forecast, by Treatment Type 2019 & 2032
- Table 67: Global OTC Deficiency Treatment Market Revenue Million Forecast, by Route of Administration 2019 & 2032
- Table 68: Global OTC Deficiency Treatment Market Volume Billion Forecast, by Route of Administration 2019 & 2032
- Table 69: Global OTC Deficiency Treatment Market Revenue Million Forecast, by Distribution Channel 2019 & 2032
- Table 70: Global OTC Deficiency Treatment Market Volume Billion Forecast, by Distribution Channel 2019 & 2032
- Table 71: Global OTC Deficiency Treatment Market Revenue Million Forecast, by Country 2019 & 2032
- Table 72: Global OTC Deficiency Treatment Market Volume Billion Forecast, by Country 2019 & 2032
Frequently Asked Questions
1. What is the projected Compound Annual Growth Rate (CAGR) of the OTC Deficiency Treatment Market?
The projected CAGR is approximately 4.30%.
2. Which companies are prominent players in the OTC Deficiency Treatment Market?
Key companies in the market include Amgen Inc (Horizon Therapeutics PLC), Bausch Health Companies Inc, Ultragenyx Pharmaceutical Inc, Arcturus Therapeutics Inc, Zevra Therapeutics (Acer Therapeutics), iECURE, Danone Group (Nutricia), Abbott, Reckitt Benckiser, Nestle, Moderna Inc, Duchesnay Pharmaceutical Group-DPG(Medunik�USA), Eurocept Pharmaceuticals Holding (Lucane Pharma)*List Not Exhaustive.
3. What are the main segments of the OTC Deficiency Treatment Market?
The market segments include Treatment Type, Route of Administration, Distribution Channel.
4. Can you provide details about the market size?
The market size is estimated to be USD 0.82 Million as of 2022.
5. What are some drivers contributing to market growth?
Rising Product Approvals With Novel Pipeline Products for Ornithine Transcarbamylase (OTC) Deficiency Treatment; Growing Awareness for Disease with Campaigns Organized by Public and Private Entities; Favorable Reimbursement Scenario and Patient Assistance Programs.
6. What are the notable trends driving market growth?
The Glycerol Phenylbutyrate Segment is Expected to Witness Significant Growth During the Forecast Period.
7. Are there any restraints impacting market growth?
Rising Product Approvals With Novel Pipeline Products for Ornithine Transcarbamylase (OTC) Deficiency Treatment; Growing Awareness for Disease with Campaigns Organized by Public and Private Entities; Favorable Reimbursement Scenario and Patient Assistance Programs.
8. Can you provide examples of recent developments in the market?
November 2023: Zevra Therapeutics Inc. acquired Acer Therapeutics Inc., which marked an important milestone in executing Zevra's strategy to become a leader in products of treatments for rare diseases such as urea cycle disorders.
9. What pricing options are available for accessing the report?
Pricing options include single-user, multi-user, and enterprise licenses priced at USD 4750, USD 5250, and USD 8750 respectively.
10. Is the market size provided in terms of value or volume?
The market size is provided in terms of value, measured in Million and volume, measured in Billion.
11. Are there any specific market keywords associated with the report?
Yes, the market keyword associated with the report is "OTC Deficiency Treatment Market," which aids in identifying and referencing the specific market segment covered.
12. How do I determine which pricing option suits my needs best?
The pricing options vary based on user requirements and access needs. Individual users may opt for single-user licenses, while businesses requiring broader access may choose multi-user or enterprise licenses for cost-effective access to the report.
13. Are there any additional resources or data provided in the OTC Deficiency Treatment Market report?
While the report offers comprehensive insights, it's advisable to review the specific contents or supplementary materials provided to ascertain if additional resources or data are available.
14. How can I stay updated on further developments or reports in the OTC Deficiency Treatment Market?
To stay informed about further developments, trends, and reports in the OTC Deficiency Treatment Market, consider subscribing to industry newsletters, following relevant companies and organizations, or regularly checking reputable industry news sources and publications.
Methodology
Step 1 - Identification of Relevant Samples Size from Population Database


Step 2 - Approaches for Defining Global Market Size (Value, Volume* & Price*)

Note*: In applicable scenarios
Step 3 - Data Sources
Primary Research
- Web Analytics
- Survey Reports
- Research Institute
- Latest Research Reports
- Opinion Leaders
Secondary Research
- Annual Reports
- White Paper
- Latest Press Release
- Industry Association
- Paid Database
- Investor Presentations

Step 4 - Data Triangulation
Involves using different sources of information in order to increase the validity of a study
These sources are likely to be stakeholders in a program - participants, other researchers, program staff, other community members, and so on.
Then we put all data in single framework & apply various statistical tools to find out the dynamic on the market.
During the analysis stage, feedback from the stakeholder groups would be compared to determine areas of agreement as well as areas of divergence
