

Key Insights
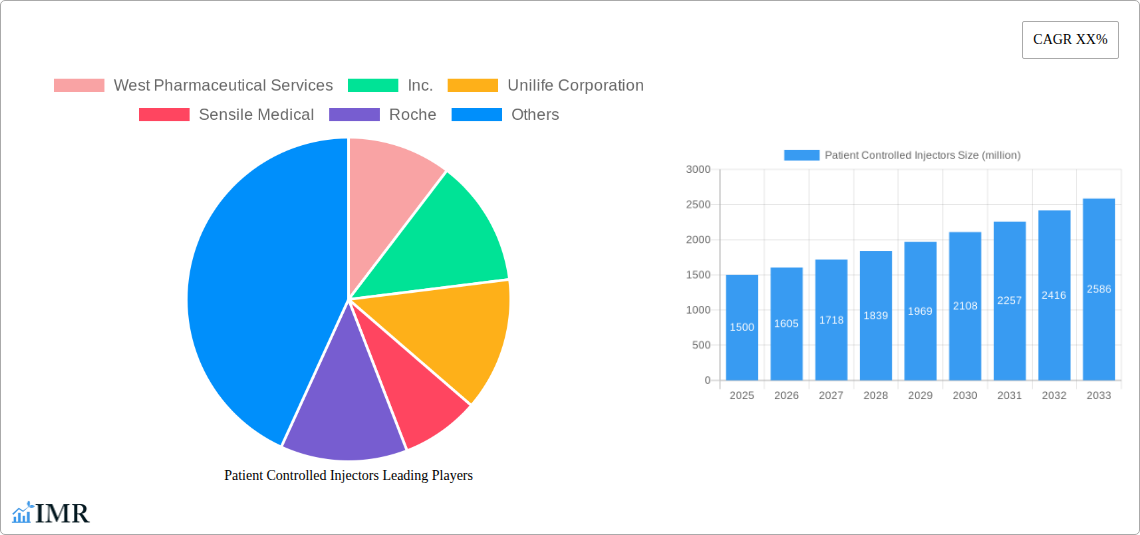
The global patient-controlled injectors (PCIs) market is experiencing robust growth, driven by a confluence of factors. The increasing prevalence of chronic diseases requiring frequent and precise medication delivery, coupled with the rising demand for convenient and self-administered therapies, fuels market expansion. Technological advancements leading to smaller, more user-friendly devices, and improved safety features are also significant drivers. Furthermore, the growing elderly population, who often require assistance with medication management, represents a substantial market segment. We estimate the market size in 2025 to be approximately $1.5 billion, based on typical growth rates observed in similar medical device sectors. Assuming a conservative CAGR of 7% (a reasonable estimate given the market dynamics), we project the market to reach approximately $2.5 billion by 2033. Key players like West Pharmaceutical Services, Unilife Corporation, and Sensile Medical are actively investing in research and development to improve device efficacy, portability, and connectivity, further propelling market growth.
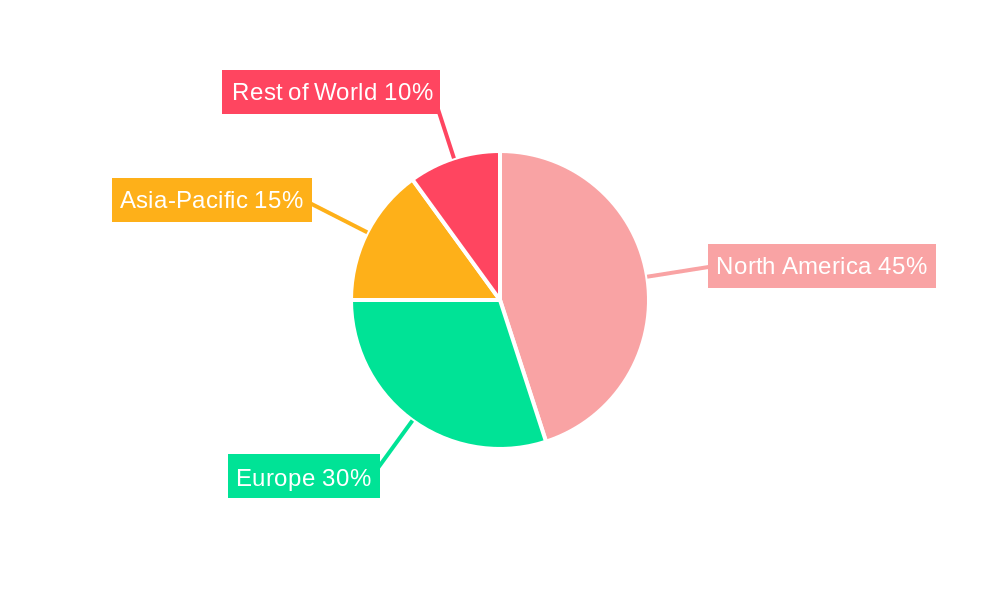
However, the market faces certain challenges. High initial costs associated with PCI devices, coupled with the need for specialized training for patients and healthcare providers, might hinder wider adoption in certain regions. Regulatory hurdles and stringent approval processes in various countries also pose potential restraints. Nevertheless, the long-term outlook remains positive, fueled by the continuous innovation in drug delivery technologies and the increasing focus on patient empowerment and improved healthcare outcomes. Market segmentation is largely driven by device type (e.g., disposable vs. reusable), application (e.g., pain management, chemotherapy), and end-user (e.g., hospitals, home care settings). The North American market currently holds the largest share, followed by Europe, with Asia-Pacific showing promising growth potential in the coming years.
Patient Controlled Injectors Market Report: 2019-2033
This comprehensive report provides a detailed analysis of the global Patient Controlled Injectors market, offering invaluable insights for industry professionals, investors, and stakeholders. The study covers the period from 2019 to 2033, with a focus on the forecast period from 2025 to 2033 and a base year of 2025. The report segments the market by key players, product types, and geographic regions, delivering a granular understanding of this rapidly evolving landscape. The total market size is projected to reach xx million units by 2033, representing a substantial growth opportunity.
Patient Controlled Injectors Market Dynamics & Structure
This section analyzes the market's competitive landscape, technological advancements, regulatory influences, and market trends. The global Patient Controlled Injectors market exhibits moderate concentration, with key players such as West Pharmaceutical Services, Inc., Unilife Corporation, and Sensile Medical holding significant market share. However, the market is also characterized by several smaller players, leading to a dynamic and competitive environment.
Market Structure:
- Market Concentration: Moderately concentrated, with a few major players and several smaller participants.
- Technological Innovation: Driven by advancements in drug delivery systems, miniaturization, and improved patient usability.
- Regulatory Framework: Stringent regulatory approvals needed for new products, impacting market entry and innovation. Significant variations exist across different geographies.
- Competitive Product Substitutes: Oral medications, transdermal patches, and other drug delivery systems pose competitive threats.
- End-User Demographics: Growing geriatric population and increasing prevalence of chronic diseases drive market demand.
- M&A Trends: Moderate level of mergers and acquisitions activity, with strategic partnerships shaping the competitive landscape. XX M&A deals were recorded between 2019 and 2024, with an estimated xx% increase predicted for 2025-2033. Major players are actively pursuing acquisitions to expand their product portfolios and geographical reach.
Patient Controlled Injectors Growth Trends & Insights
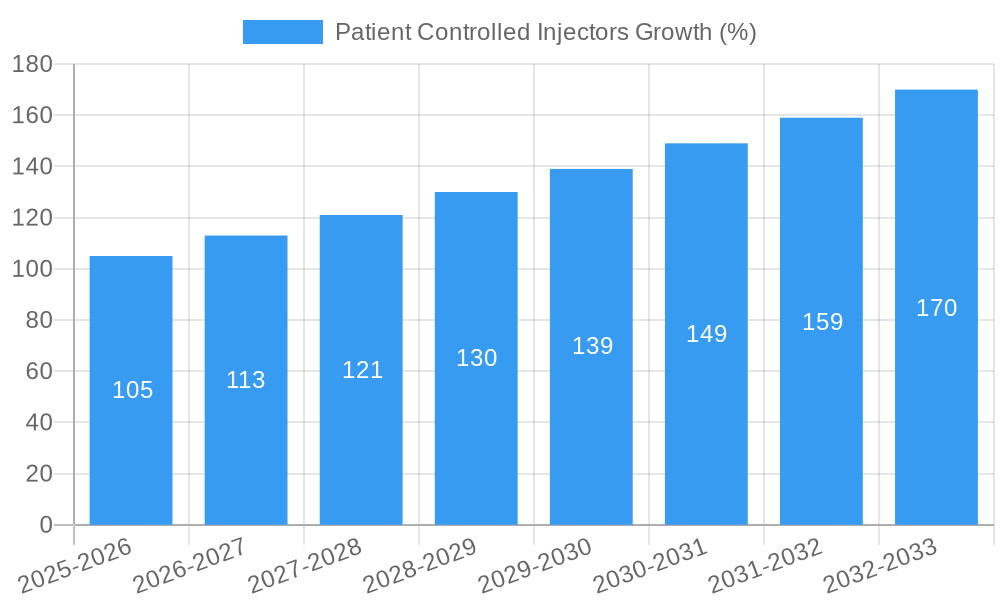
The global Patient Controlled Injectors market witnessed robust growth during the historical period (2019-2024). This growth was fueled by a combination of factors, including rising healthcare expenditure, technological advancements, and increasing patient preference for self-administered therapies. The market size expanded from xx million units in 2019 to xx million units in 2024, registering a CAGR of xx%. This positive trajectory is projected to continue throughout the forecast period (2025-2033), with the market expected to reach xx million units by 2033, driven by factors like increased adoption of self-care practices and rising awareness about advanced drug delivery solutions. The market penetration rate is expected to increase from xx% in 2024 to xx% by 2033. Technological disruptions, particularly the development of smart injectors and connected devices, are poised to further accelerate market growth. Consumer behavior shifts towards personalized medicine and convenient drug administration methods also contribute significantly to this expansion.
Dominant Regions, Countries, or Segments in Patient Controlled Injectors
North America currently dominates the Patient Controlled Injectors market, driven by factors such as high healthcare expenditure, robust regulatory frameworks, and a significant presence of major players. Europe follows as the second-largest market, exhibiting strong growth potential.
- Key Drivers in North America:
- High healthcare expenditure and insurance coverage
- Strong presence of key players and advanced research facilities
- Favorable regulatory environment promoting innovation.
- Key Drivers in Europe:
- Increasing prevalence of chronic diseases
- Growing adoption of advanced drug delivery systems
- Initiatives to improve healthcare accessibility.
- Asia Pacific Growth Potential: The Asia-Pacific region is projected to show significant growth in the coming years, driven by rising disposable incomes, increasing healthcare awareness, and expanding healthcare infrastructure. However, regulatory hurdles and market penetration challenges in some countries hinder rapid expansion.
Market share analysis reveals North America accounts for approximately xx% of the global market, while Europe holds approximately xx%. Asia-Pacific is projected to achieve a significant CAGR of xx% during the forecast period.
Patient Controlled Injectors Product Landscape
Patient Controlled Injectors encompass a range of devices designed for self-administration of medications, offering diverse features such as variable dose control, safety mechanisms, and connectivity options. Recent innovations include smaller, more user-friendly designs, integration with smart technology for remote monitoring, and enhanced safety features to prevent accidental injections. These advancements cater to patient preference for ease of use, improved compliance, and increased safety. The market also witnesses the development of specialized injectors for specific therapeutic areas.
Key Drivers, Barriers & Challenges in Patient Controlled Injectors
Key Drivers:
- Increasing prevalence of chronic diseases requiring long-term medication.
- Growing preference for self-administered therapies and home healthcare.
- Advancements in technology resulting in smaller, more user-friendly devices.
Challenges and Restraints:
- High initial investment costs for patients and healthcare systems.
- Stringent regulatory requirements for approvals and market entry.
- Potential for device malfunction or misuse, necessitating robust safety mechanisms. This contributes to approximately xx% of reported device failures in the market.
Emerging Opportunities in Patient Controlled Injectors
- Untapped Markets: Expanding market penetration in emerging economies with rising healthcare expenditure.
- Innovative Applications: Development of injectors for novel drug delivery mechanisms and therapeutic areas.
- Evolving Consumer Preferences: Personalized medicine and tailored drug delivery systems are gaining traction.
Growth Accelerators in the Patient Controlled Injectors Industry
Technological breakthroughs in miniaturization, smart technology integration, and improved safety features are key catalysts for long-term growth. Strategic partnerships between pharmaceutical companies and medical device manufacturers drive innovation and market expansion. Furthermore, proactive market expansion strategies by key players targeting underserved regions and therapeutic areas will contribute to sustained growth.
Key Players Shaping the Patient Controlled Injectors Market
- West Pharmaceutical Services, Inc.
- Unilife Corporation
- Sensile Medical
- Roche
- Janssen Pharmaceutical (Johnson & Johnson)
- Westbourne Medical Ltd.
Notable Milestones in Patient Controlled Injectors Sector
- 2020: Launch of a new smart injector with integrated connectivity features by [Company Name].
- 2021: Acquisition of [Company A] by [Company B], expanding market share and product portfolio.
- 2022: FDA approval of a novel Patient Controlled Injector for a specific therapeutic area.
- 2023: Introduction of a biosimilar medication delivered via a novel Patient Controlled Injector.
In-Depth Patient Controlled Injectors Market Outlook
The Patient Controlled Injectors market is poised for substantial growth in the coming years, driven by technological innovation, strategic partnerships, and expanding market penetration in emerging economies. The focus on personalized medicine and patient-centric care will further propel market expansion. Strategic opportunities exist for companies investing in advanced technologies, establishing strategic partnerships, and expanding into new geographical markets. The market is expected to experience a CAGR of xx% from 2025 to 2033.
Patient Controlled Injectors Segmentation
-
1. Application
- 1.1. Cancer Treatment
- 1.2. Auto-immune Treatment
- 1.3. Blood Disorders Treatment
- 1.4. Others
-
2. Types
- 2.1. Electronical Injectors
- 2.2. Mechanical Injectors
- 2.3. Others
Patient Controlled Injectors Segmentation By Geography
-
1. North America
- 1.1. United States
- 1.2. Canada
- 1.3. Mexico
-
2. South America
- 2.1. Brazil
- 2.2. Argentina
- 2.3. Rest of South America
-
3. Europe
- 3.1. United Kingdom
- 3.2. Germany
- 3.3. France
- 3.4. Italy
- 3.5. Spain
- 3.6. Russia
- 3.7. Benelux
- 3.8. Nordics
- 3.9. Rest of Europe
-
4. Middle East & Africa
- 4.1. Turkey
- 4.2. Israel
- 4.3. GCC
- 4.4. North Africa
- 4.5. South Africa
- 4.6. Rest of Middle East & Africa
-
5. Asia Pacific
- 5.1. China
- 5.2. India
- 5.3. Japan
- 5.4. South Korea
- 5.5. ASEAN
- 5.6. Oceania
- 5.7. Rest of Asia Pacific
Patient Controlled Injectors REPORT HIGHLIGHTS
| Aspects | Details |
|---|---|
| Study Period | 2019-2033 |
| Base Year | 2024 |
| Estimated Year | 2025 |
| Forecast Period | 2025-2033 |
| Historical Period | 2019-2024 |
| Growth Rate | CAGR of XX% from 2019-2033 |
| Segmentation |
|
Table of Contents
- 1. Introduction
- 1.1. Research Scope
- 1.2. Market Segmentation
- 1.3. Research Methodology
- 1.4. Definitions and Assumptions
- 2. Executive Summary
- 2.1. Introduction
- 3. Market Dynamics
- 3.1. Introduction
- 3.2. Market Drivers
- 3.3. Market Restrains
- 3.4. Market Trends
- 4. Market Factor Analysis
- 4.1. Porters Five Forces
- 4.2. Supply/Value Chain
- 4.3. PESTEL analysis
- 4.4. Market Entropy
- 4.5. Patent/Trademark Analysis
- 5. Global Patient Controlled Injectors Analysis, Insights and Forecast, 2019-2031
- 5.1. Market Analysis, Insights and Forecast - by Application
- 5.1.1. Cancer Treatment
- 5.1.2. Auto-immune Treatment
- 5.1.3. Blood Disorders Treatment
- 5.1.4. Others
- 5.2. Market Analysis, Insights and Forecast - by Types
- 5.2.1. Electronical Injectors
- 5.2.2. Mechanical Injectors
- 5.2.3. Others
- 5.3. Market Analysis, Insights and Forecast - by Region
- 5.3.1. North America
- 5.3.2. South America
- 5.3.3. Europe
- 5.3.4. Middle East & Africa
- 5.3.5. Asia Pacific
- 5.1. Market Analysis, Insights and Forecast - by Application
- 6. North America Patient Controlled Injectors Analysis, Insights and Forecast, 2019-2031
- 6.1. Market Analysis, Insights and Forecast - by Application
- 6.1.1. Cancer Treatment
- 6.1.2. Auto-immune Treatment
- 6.1.3. Blood Disorders Treatment
- 6.1.4. Others
- 6.2. Market Analysis, Insights and Forecast - by Types
- 6.2.1. Electronical Injectors
- 6.2.2. Mechanical Injectors
- 6.2.3. Others
- 6.1. Market Analysis, Insights and Forecast - by Application
- 7. South America Patient Controlled Injectors Analysis, Insights and Forecast, 2019-2031
- 7.1. Market Analysis, Insights and Forecast - by Application
- 7.1.1. Cancer Treatment
- 7.1.2. Auto-immune Treatment
- 7.1.3. Blood Disorders Treatment
- 7.1.4. Others
- 7.2. Market Analysis, Insights and Forecast - by Types
- 7.2.1. Electronical Injectors
- 7.2.2. Mechanical Injectors
- 7.2.3. Others
- 7.1. Market Analysis, Insights and Forecast - by Application
- 8. Europe Patient Controlled Injectors Analysis, Insights and Forecast, 2019-2031
- 8.1. Market Analysis, Insights and Forecast - by Application
- 8.1.1. Cancer Treatment
- 8.1.2. Auto-immune Treatment
- 8.1.3. Blood Disorders Treatment
- 8.1.4. Others
- 8.2. Market Analysis, Insights and Forecast - by Types
- 8.2.1. Electronical Injectors
- 8.2.2. Mechanical Injectors
- 8.2.3. Others
- 8.1. Market Analysis, Insights and Forecast - by Application
- 9. Middle East & Africa Patient Controlled Injectors Analysis, Insights and Forecast, 2019-2031
- 9.1. Market Analysis, Insights and Forecast - by Application
- 9.1.1. Cancer Treatment
- 9.1.2. Auto-immune Treatment
- 9.1.3. Blood Disorders Treatment
- 9.1.4. Others
- 9.2. Market Analysis, Insights and Forecast - by Types
- 9.2.1. Electronical Injectors
- 9.2.2. Mechanical Injectors
- 9.2.3. Others
- 9.1. Market Analysis, Insights and Forecast - by Application
- 10. Asia Pacific Patient Controlled Injectors Analysis, Insights and Forecast, 2019-2031
- 10.1. Market Analysis, Insights and Forecast - by Application
- 10.1.1. Cancer Treatment
- 10.1.2. Auto-immune Treatment
- 10.1.3. Blood Disorders Treatment
- 10.1.4. Others
- 10.2. Market Analysis, Insights and Forecast - by Types
- 10.2.1. Electronical Injectors
- 10.2.2. Mechanical Injectors
- 10.2.3. Others
- 10.1. Market Analysis, Insights and Forecast - by Application
- 11. Competitive Analysis
- 11.1. Global Market Share Analysis 2024
- 11.2. Company Profiles
- 11.2.1 West Pharmaceutical Services
- 11.2.1.1. Overview
- 11.2.1.2. Products
- 11.2.1.3. SWOT Analysis
- 11.2.1.4. Recent Developments
- 11.2.1.5. Financials (Based on Availability)
- 11.2.2 Inc.
- 11.2.2.1. Overview
- 11.2.2.2. Products
- 11.2.2.3. SWOT Analysis
- 11.2.2.4. Recent Developments
- 11.2.2.5. Financials (Based on Availability)
- 11.2.3 Unilife Corporation
- 11.2.3.1. Overview
- 11.2.3.2. Products
- 11.2.3.3. SWOT Analysis
- 11.2.3.4. Recent Developments
- 11.2.3.5. Financials (Based on Availability)
- 11.2.4 Sensile Medical
- 11.2.4.1. Overview
- 11.2.4.2. Products
- 11.2.4.3. SWOT Analysis
- 11.2.4.4. Recent Developments
- 11.2.4.5. Financials (Based on Availability)
- 11.2.5 Roche
- 11.2.5.1. Overview
- 11.2.5.2. Products
- 11.2.5.3. SWOT Analysis
- 11.2.5.4. Recent Developments
- 11.2.5.5. Financials (Based on Availability)
- 11.2.6 Janssen Pharmaceutical (Johnson & Johnson)
- 11.2.6.1. Overview
- 11.2.6.2. Products
- 11.2.6.3. SWOT Analysis
- 11.2.6.4. Recent Developments
- 11.2.6.5. Financials (Based on Availability)
- 11.2.7 Westbourne Medical Ltd.
- 11.2.7.1. Overview
- 11.2.7.2. Products
- 11.2.7.3. SWOT Analysis
- 11.2.7.4. Recent Developments
- 11.2.7.5. Financials (Based on Availability)
- 11.2.1 West Pharmaceutical Services
List of Figures
- Figure 1: Global Patient Controlled Injectors Revenue Breakdown (million, %) by Region 2024 & 2032
- Figure 2: Global Patient Controlled Injectors Volume Breakdown (K, %) by Region 2024 & 2032
- Figure 3: North America Patient Controlled Injectors Revenue (million), by Application 2024 & 2032
- Figure 4: North America Patient Controlled Injectors Volume (K), by Application 2024 & 2032
- Figure 5: North America Patient Controlled Injectors Revenue Share (%), by Application 2024 & 2032
- Figure 6: North America Patient Controlled Injectors Volume Share (%), by Application 2024 & 2032
- Figure 7: North America Patient Controlled Injectors Revenue (million), by Types 2024 & 2032
- Figure 8: North America Patient Controlled Injectors Volume (K), by Types 2024 & 2032
- Figure 9: North America Patient Controlled Injectors Revenue Share (%), by Types 2024 & 2032
- Figure 10: North America Patient Controlled Injectors Volume Share (%), by Types 2024 & 2032
- Figure 11: North America Patient Controlled Injectors Revenue (million), by Country 2024 & 2032
- Figure 12: North America Patient Controlled Injectors Volume (K), by Country 2024 & 2032
- Figure 13: North America Patient Controlled Injectors Revenue Share (%), by Country 2024 & 2032
- Figure 14: North America Patient Controlled Injectors Volume Share (%), by Country 2024 & 2032
- Figure 15: South America Patient Controlled Injectors Revenue (million), by Application 2024 & 2032
- Figure 16: South America Patient Controlled Injectors Volume (K), by Application 2024 & 2032
- Figure 17: South America Patient Controlled Injectors Revenue Share (%), by Application 2024 & 2032
- Figure 18: South America Patient Controlled Injectors Volume Share (%), by Application 2024 & 2032
- Figure 19: South America Patient Controlled Injectors Revenue (million), by Types 2024 & 2032
- Figure 20: South America Patient Controlled Injectors Volume (K), by Types 2024 & 2032
- Figure 21: South America Patient Controlled Injectors Revenue Share (%), by Types 2024 & 2032
- Figure 22: South America Patient Controlled Injectors Volume Share (%), by Types 2024 & 2032
- Figure 23: South America Patient Controlled Injectors Revenue (million), by Country 2024 & 2032
- Figure 24: South America Patient Controlled Injectors Volume (K), by Country 2024 & 2032
- Figure 25: South America Patient Controlled Injectors Revenue Share (%), by Country 2024 & 2032
- Figure 26: South America Patient Controlled Injectors Volume Share (%), by Country 2024 & 2032
- Figure 27: Europe Patient Controlled Injectors Revenue (million), by Application 2024 & 2032
- Figure 28: Europe Patient Controlled Injectors Volume (K), by Application 2024 & 2032
- Figure 29: Europe Patient Controlled Injectors Revenue Share (%), by Application 2024 & 2032
- Figure 30: Europe Patient Controlled Injectors Volume Share (%), by Application 2024 & 2032
- Figure 31: Europe Patient Controlled Injectors Revenue (million), by Types 2024 & 2032
- Figure 32: Europe Patient Controlled Injectors Volume (K), by Types 2024 & 2032
- Figure 33: Europe Patient Controlled Injectors Revenue Share (%), by Types 2024 & 2032
- Figure 34: Europe Patient Controlled Injectors Volume Share (%), by Types 2024 & 2032
- Figure 35: Europe Patient Controlled Injectors Revenue (million), by Country 2024 & 2032
- Figure 36: Europe Patient Controlled Injectors Volume (K), by Country 2024 & 2032
- Figure 37: Europe Patient Controlled Injectors Revenue Share (%), by Country 2024 & 2032
- Figure 38: Europe Patient Controlled Injectors Volume Share (%), by Country 2024 & 2032
- Figure 39: Middle East & Africa Patient Controlled Injectors Revenue (million), by Application 2024 & 2032
- Figure 40: Middle East & Africa Patient Controlled Injectors Volume (K), by Application 2024 & 2032
- Figure 41: Middle East & Africa Patient Controlled Injectors Revenue Share (%), by Application 2024 & 2032
- Figure 42: Middle East & Africa Patient Controlled Injectors Volume Share (%), by Application 2024 & 2032
- Figure 43: Middle East & Africa Patient Controlled Injectors Revenue (million), by Types 2024 & 2032
- Figure 44: Middle East & Africa Patient Controlled Injectors Volume (K), by Types 2024 & 2032
- Figure 45: Middle East & Africa Patient Controlled Injectors Revenue Share (%), by Types 2024 & 2032
- Figure 46: Middle East & Africa Patient Controlled Injectors Volume Share (%), by Types 2024 & 2032
- Figure 47: Middle East & Africa Patient Controlled Injectors Revenue (million), by Country 2024 & 2032
- Figure 48: Middle East & Africa Patient Controlled Injectors Volume (K), by Country 2024 & 2032
- Figure 49: Middle East & Africa Patient Controlled Injectors Revenue Share (%), by Country 2024 & 2032
- Figure 50: Middle East & Africa Patient Controlled Injectors Volume Share (%), by Country 2024 & 2032
- Figure 51: Asia Pacific Patient Controlled Injectors Revenue (million), by Application 2024 & 2032
- Figure 52: Asia Pacific Patient Controlled Injectors Volume (K), by Application 2024 & 2032
- Figure 53: Asia Pacific Patient Controlled Injectors Revenue Share (%), by Application 2024 & 2032
- Figure 54: Asia Pacific Patient Controlled Injectors Volume Share (%), by Application 2024 & 2032
- Figure 55: Asia Pacific Patient Controlled Injectors Revenue (million), by Types 2024 & 2032
- Figure 56: Asia Pacific Patient Controlled Injectors Volume (K), by Types 2024 & 2032
- Figure 57: Asia Pacific Patient Controlled Injectors Revenue Share (%), by Types 2024 & 2032
- Figure 58: Asia Pacific Patient Controlled Injectors Volume Share (%), by Types 2024 & 2032
- Figure 59: Asia Pacific Patient Controlled Injectors Revenue (million), by Country 2024 & 2032
- Figure 60: Asia Pacific Patient Controlled Injectors Volume (K), by Country 2024 & 2032
- Figure 61: Asia Pacific Patient Controlled Injectors Revenue Share (%), by Country 2024 & 2032
- Figure 62: Asia Pacific Patient Controlled Injectors Volume Share (%), by Country 2024 & 2032
List of Tables
- Table 1: Global Patient Controlled Injectors Revenue million Forecast, by Region 2019 & 2032
- Table 2: Global Patient Controlled Injectors Volume K Forecast, by Region 2019 & 2032
- Table 3: Global Patient Controlled Injectors Revenue million Forecast, by Application 2019 & 2032
- Table 4: Global Patient Controlled Injectors Volume K Forecast, by Application 2019 & 2032
- Table 5: Global Patient Controlled Injectors Revenue million Forecast, by Types 2019 & 2032
- Table 6: Global Patient Controlled Injectors Volume K Forecast, by Types 2019 & 2032
- Table 7: Global Patient Controlled Injectors Revenue million Forecast, by Region 2019 & 2032
- Table 8: Global Patient Controlled Injectors Volume K Forecast, by Region 2019 & 2032
- Table 9: Global Patient Controlled Injectors Revenue million Forecast, by Application 2019 & 2032
- Table 10: Global Patient Controlled Injectors Volume K Forecast, by Application 2019 & 2032
- Table 11: Global Patient Controlled Injectors Revenue million Forecast, by Types 2019 & 2032
- Table 12: Global Patient Controlled Injectors Volume K Forecast, by Types 2019 & 2032
- Table 13: Global Patient Controlled Injectors Revenue million Forecast, by Country 2019 & 2032
- Table 14: Global Patient Controlled Injectors Volume K Forecast, by Country 2019 & 2032
- Table 15: United States Patient Controlled Injectors Revenue (million) Forecast, by Application 2019 & 2032
- Table 16: United States Patient Controlled Injectors Volume (K) Forecast, by Application 2019 & 2032
- Table 17: Canada Patient Controlled Injectors Revenue (million) Forecast, by Application 2019 & 2032
- Table 18: Canada Patient Controlled Injectors Volume (K) Forecast, by Application 2019 & 2032
- Table 19: Mexico Patient Controlled Injectors Revenue (million) Forecast, by Application 2019 & 2032
- Table 20: Mexico Patient Controlled Injectors Volume (K) Forecast, by Application 2019 & 2032
- Table 21: Global Patient Controlled Injectors Revenue million Forecast, by Application 2019 & 2032
- Table 22: Global Patient Controlled Injectors Volume K Forecast, by Application 2019 & 2032
- Table 23: Global Patient Controlled Injectors Revenue million Forecast, by Types 2019 & 2032
- Table 24: Global Patient Controlled Injectors Volume K Forecast, by Types 2019 & 2032
- Table 25: Global Patient Controlled Injectors Revenue million Forecast, by Country 2019 & 2032
- Table 26: Global Patient Controlled Injectors Volume K Forecast, by Country 2019 & 2032
- Table 27: Brazil Patient Controlled Injectors Revenue (million) Forecast, by Application 2019 & 2032
- Table 28: Brazil Patient Controlled Injectors Volume (K) Forecast, by Application 2019 & 2032
- Table 29: Argentina Patient Controlled Injectors Revenue (million) Forecast, by Application 2019 & 2032
- Table 30: Argentina Patient Controlled Injectors Volume (K) Forecast, by Application 2019 & 2032
- Table 31: Rest of South America Patient Controlled Injectors Revenue (million) Forecast, by Application 2019 & 2032
- Table 32: Rest of South America Patient Controlled Injectors Volume (K) Forecast, by Application 2019 & 2032
- Table 33: Global Patient Controlled Injectors Revenue million Forecast, by Application 2019 & 2032
- Table 34: Global Patient Controlled Injectors Volume K Forecast, by Application 2019 & 2032
- Table 35: Global Patient Controlled Injectors Revenue million Forecast, by Types 2019 & 2032
- Table 36: Global Patient Controlled Injectors Volume K Forecast, by Types 2019 & 2032
- Table 37: Global Patient Controlled Injectors Revenue million Forecast, by Country 2019 & 2032
- Table 38: Global Patient Controlled Injectors Volume K Forecast, by Country 2019 & 2032
- Table 39: United Kingdom Patient Controlled Injectors Revenue (million) Forecast, by Application 2019 & 2032
- Table 40: United Kingdom Patient Controlled Injectors Volume (K) Forecast, by Application 2019 & 2032
- Table 41: Germany Patient Controlled Injectors Revenue (million) Forecast, by Application 2019 & 2032
- Table 42: Germany Patient Controlled Injectors Volume (K) Forecast, by Application 2019 & 2032
- Table 43: France Patient Controlled Injectors Revenue (million) Forecast, by Application 2019 & 2032
- Table 44: France Patient Controlled Injectors Volume (K) Forecast, by Application 2019 & 2032
- Table 45: Italy Patient Controlled Injectors Revenue (million) Forecast, by Application 2019 & 2032
- Table 46: Italy Patient Controlled Injectors Volume (K) Forecast, by Application 2019 & 2032
- Table 47: Spain Patient Controlled Injectors Revenue (million) Forecast, by Application 2019 & 2032
- Table 48: Spain Patient Controlled Injectors Volume (K) Forecast, by Application 2019 & 2032
- Table 49: Russia Patient Controlled Injectors Revenue (million) Forecast, by Application 2019 & 2032
- Table 50: Russia Patient Controlled Injectors Volume (K) Forecast, by Application 2019 & 2032
- Table 51: Benelux Patient Controlled Injectors Revenue (million) Forecast, by Application 2019 & 2032
- Table 52: Benelux Patient Controlled Injectors Volume (K) Forecast, by Application 2019 & 2032
- Table 53: Nordics Patient Controlled Injectors Revenue (million) Forecast, by Application 2019 & 2032
- Table 54: Nordics Patient Controlled Injectors Volume (K) Forecast, by Application 2019 & 2032
- Table 55: Rest of Europe Patient Controlled Injectors Revenue (million) Forecast, by Application 2019 & 2032
- Table 56: Rest of Europe Patient Controlled Injectors Volume (K) Forecast, by Application 2019 & 2032
- Table 57: Global Patient Controlled Injectors Revenue million Forecast, by Application 2019 & 2032
- Table 58: Global Patient Controlled Injectors Volume K Forecast, by Application 2019 & 2032
- Table 59: Global Patient Controlled Injectors Revenue million Forecast, by Types 2019 & 2032
- Table 60: Global Patient Controlled Injectors Volume K Forecast, by Types 2019 & 2032
- Table 61: Global Patient Controlled Injectors Revenue million Forecast, by Country 2019 & 2032
- Table 62: Global Patient Controlled Injectors Volume K Forecast, by Country 2019 & 2032
- Table 63: Turkey Patient Controlled Injectors Revenue (million) Forecast, by Application 2019 & 2032
- Table 64: Turkey Patient Controlled Injectors Volume (K) Forecast, by Application 2019 & 2032
- Table 65: Israel Patient Controlled Injectors Revenue (million) Forecast, by Application 2019 & 2032
- Table 66: Israel Patient Controlled Injectors Volume (K) Forecast, by Application 2019 & 2032
- Table 67: GCC Patient Controlled Injectors Revenue (million) Forecast, by Application 2019 & 2032
- Table 68: GCC Patient Controlled Injectors Volume (K) Forecast, by Application 2019 & 2032
- Table 69: North Africa Patient Controlled Injectors Revenue (million) Forecast, by Application 2019 & 2032
- Table 70: North Africa Patient Controlled Injectors Volume (K) Forecast, by Application 2019 & 2032
- Table 71: South Africa Patient Controlled Injectors Revenue (million) Forecast, by Application 2019 & 2032
- Table 72: South Africa Patient Controlled Injectors Volume (K) Forecast, by Application 2019 & 2032
- Table 73: Rest of Middle East & Africa Patient Controlled Injectors Revenue (million) Forecast, by Application 2019 & 2032
- Table 74: Rest of Middle East & Africa Patient Controlled Injectors Volume (K) Forecast, by Application 2019 & 2032
- Table 75: Global Patient Controlled Injectors Revenue million Forecast, by Application 2019 & 2032
- Table 76: Global Patient Controlled Injectors Volume K Forecast, by Application 2019 & 2032
- Table 77: Global Patient Controlled Injectors Revenue million Forecast, by Types 2019 & 2032
- Table 78: Global Patient Controlled Injectors Volume K Forecast, by Types 2019 & 2032
- Table 79: Global Patient Controlled Injectors Revenue million Forecast, by Country 2019 & 2032
- Table 80: Global Patient Controlled Injectors Volume K Forecast, by Country 2019 & 2032
- Table 81: China Patient Controlled Injectors Revenue (million) Forecast, by Application 2019 & 2032
- Table 82: China Patient Controlled Injectors Volume (K) Forecast, by Application 2019 & 2032
- Table 83: India Patient Controlled Injectors Revenue (million) Forecast, by Application 2019 & 2032
- Table 84: India Patient Controlled Injectors Volume (K) Forecast, by Application 2019 & 2032
- Table 85: Japan Patient Controlled Injectors Revenue (million) Forecast, by Application 2019 & 2032
- Table 86: Japan Patient Controlled Injectors Volume (K) Forecast, by Application 2019 & 2032
- Table 87: South Korea Patient Controlled Injectors Revenue (million) Forecast, by Application 2019 & 2032
- Table 88: South Korea Patient Controlled Injectors Volume (K) Forecast, by Application 2019 & 2032
- Table 89: ASEAN Patient Controlled Injectors Revenue (million) Forecast, by Application 2019 & 2032
- Table 90: ASEAN Patient Controlled Injectors Volume (K) Forecast, by Application 2019 & 2032
- Table 91: Oceania Patient Controlled Injectors Revenue (million) Forecast, by Application 2019 & 2032
- Table 92: Oceania Patient Controlled Injectors Volume (K) Forecast, by Application 2019 & 2032
- Table 93: Rest of Asia Pacific Patient Controlled Injectors Revenue (million) Forecast, by Application 2019 & 2032
- Table 94: Rest of Asia Pacific Patient Controlled Injectors Volume (K) Forecast, by Application 2019 & 2032
Frequently Asked Questions
1. What is the projected Compound Annual Growth Rate (CAGR) of the Patient Controlled Injectors?
The projected CAGR is approximately XX%.
2. Which companies are prominent players in the Patient Controlled Injectors?
Key companies in the market include West Pharmaceutical Services, Inc., Unilife Corporation, Sensile Medical, Roche, Janssen Pharmaceutical (Johnson & Johnson), Westbourne Medical Ltd..
3. What are the main segments of the Patient Controlled Injectors?
The market segments include Application, Types.
4. Can you provide details about the market size?
The market size is estimated to be USD XXX million as of 2022.
5. What are some drivers contributing to market growth?
N/A
6. What are the notable trends driving market growth?
N/A
7. Are there any restraints impacting market growth?
N/A
8. Can you provide examples of recent developments in the market?
N/A
9. What pricing options are available for accessing the report?
Pricing options include single-user, multi-user, and enterprise licenses priced at USD 3950.00, USD 5925.00, and USD 7900.00 respectively.
10. Is the market size provided in terms of value or volume?
The market size is provided in terms of value, measured in million and volume, measured in K.
11. Are there any specific market keywords associated with the report?
Yes, the market keyword associated with the report is "Patient Controlled Injectors," which aids in identifying and referencing the specific market segment covered.
12. How do I determine which pricing option suits my needs best?
The pricing options vary based on user requirements and access needs. Individual users may opt for single-user licenses, while businesses requiring broader access may choose multi-user or enterprise licenses for cost-effective access to the report.
13. Are there any additional resources or data provided in the Patient Controlled Injectors report?
While the report offers comprehensive insights, it's advisable to review the specific contents or supplementary materials provided to ascertain if additional resources or data are available.
14. How can I stay updated on further developments or reports in the Patient Controlled Injectors?
To stay informed about further developments, trends, and reports in the Patient Controlled Injectors, consider subscribing to industry newsletters, following relevant companies and organizations, or regularly checking reputable industry news sources and publications.
Methodology
Step 1 - Identification of Relevant Samples Size from Population Database


Step 2 - Approaches for Defining Global Market Size (Value, Volume* & Price*)

Note*: In applicable scenarios
Step 3 - Data Sources
Primary Research
- Web Analytics
- Survey Reports
- Research Institute
- Latest Research Reports
- Opinion Leaders
Secondary Research
- Annual Reports
- White Paper
- Latest Press Release
- Industry Association
- Paid Database
- Investor Presentations

Step 4 - Data Triangulation
Involves using different sources of information in order to increase the validity of a study
These sources are likely to be stakeholders in a program - participants, other researchers, program staff, other community members, and so on.
Then we put all data in single framework & apply various statistical tools to find out the dynamic on the market.
During the analysis stage, feedback from the stakeholder groups would be compared to determine areas of agreement as well as areas of divergence
