

Key Insights
The global pediatric wheelchair market is experiencing steady growth, driven by increasing prevalence of birth defects, cerebral palsy, muscular dystrophy, and other conditions requiring mobility assistance in children. The market's Compound Annual Growth Rate (CAGR) of 5.30% from 2019-2024 suggests a robust and expanding sector. This growth is further fueled by advancements in wheelchair technology, leading to lighter, more comfortable, and customizable designs tailored to children's specific needs. Parents and caregivers are increasingly seeking high-quality, durable wheelchairs that promote independence and participation in daily activities. The segment is segmented by product type (manual and powered), frame type (rigid and foldable), and end-user (hospitals, homecare settings, and other). Powered wheelchairs, offering greater ease of use and enhanced mobility, are witnessing particularly strong demand, while foldable wheelchairs are favored for their portability and convenience. North America and Europe currently hold significant market shares due to higher healthcare expenditure and advanced medical infrastructure. However, emerging economies in Asia-Pacific and other regions are exhibiting promising growth potential, driven by rising disposable incomes and increasing awareness of assistive technologies. The market faces challenges including high initial costs of wheelchairs, particularly powered models, and varying levels of healthcare coverage across different regions.
Despite these challenges, the long-term outlook for the pediatric wheelchair market remains positive. Technological innovations, such as the integration of smart features and personalized design options, are anticipated to drive future market expansion. Furthermore, government initiatives and increased awareness campaigns promoting inclusivity and accessibility are expected to stimulate demand for pediatric wheelchairs. The competitive landscape is characterized by a mix of established players like Invacare, Ottobock, and Sunrise Medical, along with smaller specialized companies catering to the specific needs of the pediatric population. Continuous product innovation, strategic partnerships, and expansion into emerging markets will be key success factors for market players in the coming years. The projected market size for 2025 is estimated based on the provided CAGR and considering market trends, resulting in a logical and realistic value.
Pediatric Wheelchair Industry Market Report: 2019-2033
This comprehensive report provides an in-depth analysis of the pediatric wheelchair market, offering invaluable insights for parents, healthcare professionals, and industry stakeholders. With a focus on market dynamics, growth trends, and future projections (2019-2033), this report is essential for strategic decision-making. The study period covers 2019-2024 (Historical Period), with 2025 serving as the base and estimated year. The forecast period extends from 2025-2033.
Pediatric Wheelchair Industry Market Dynamics & Structure
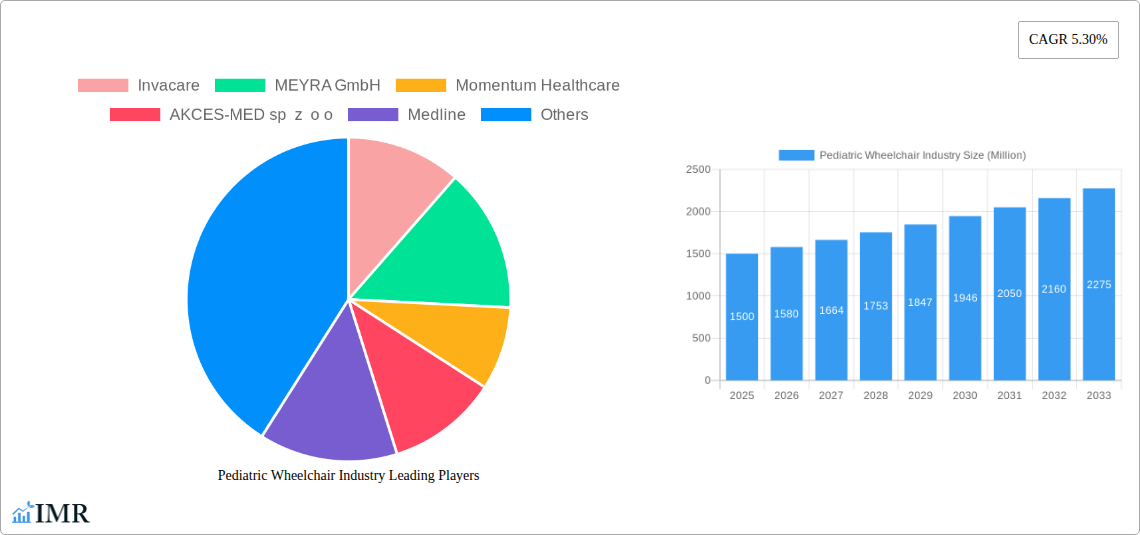
The pediatric wheelchair market is characterized by a moderately concentrated landscape, with key players such as Invacare, MEYRA GmbH, and Permobil holding significant market share. Technological innovation, particularly in adjustable and lightweight designs, is a major driver, alongside increasing awareness of accessibility needs among parents and healthcare providers. Regulatory frameworks concerning safety and accessibility standards significantly influence product development and market access. While there are some substitutes, such as specialized strollers, the unique needs of children with mobility impairments solidify the demand for pediatric-specific wheelchairs. The market also sees a growing trend of mergers and acquisitions (M&A), with xx number of deals recorded between 2019 and 2024, indicating consolidation within the sector. End-user demographics are shifting towards a higher demand from homecare settings, influenced by increasing preference for at-home care.
- Market Concentration: Moderately concentrated, with top 5 players holding approximately xx% market share.
- Technological Innovation: Focus on lightweight, adjustable, and customizable designs.
- Regulatory Landscape: Stringent safety and accessibility standards influence product development.
- Competitive Substitutes: Limited, with specialized strollers offering partial substitution.
- M&A Activity: xx deals recorded between 2019 and 2024, indicating consolidation.
- End-User Demographics: Growing demand from homecare settings.
Pediatric Wheelchair Industry Growth Trends & Insights
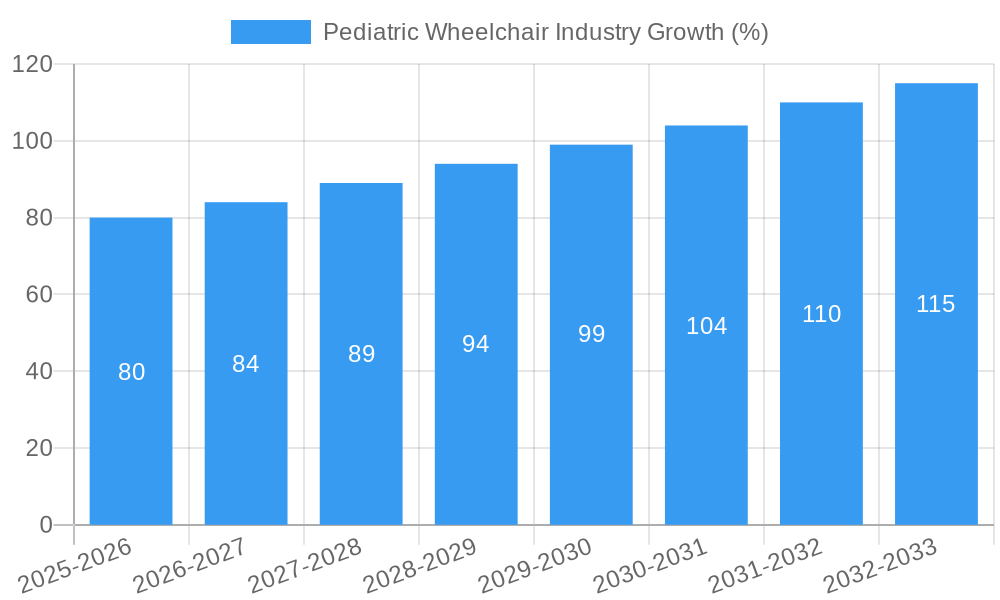
The pediatric wheelchair market exhibits a robust growth trajectory, driven by increasing prevalence of childhood disabilities, rising disposable incomes in developing economies, and growing awareness regarding the importance of early intervention therapies. The market size is projected to reach xx million units by 2025, exhibiting a CAGR of xx% during the forecast period (2025-2033). Adoption rates are increasing steadily, particularly in regions with improving healthcare infrastructure. Technological advancements, such as smart wheelchair technologies and advanced materials, are further fueling market expansion. Consumer behavior is shifting towards personalized and customized solutions, driving demand for adjustable and adaptable wheelchairs.
Dominant Regions, Countries, or Segments in Pediatric Wheelchair Industry
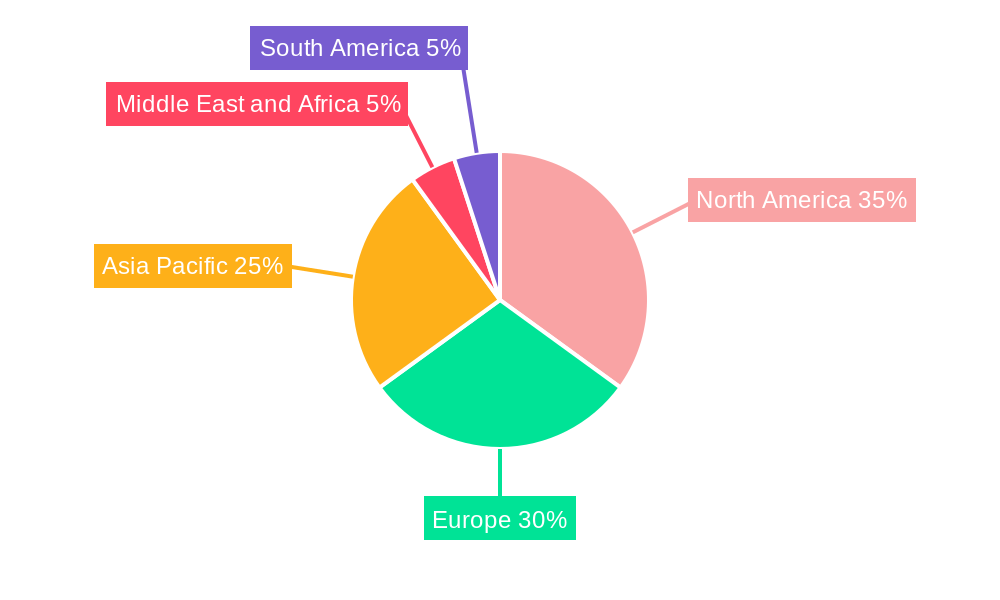
North America currently holds the largest market share due to high healthcare expenditure and robust healthcare infrastructure. However, Asia-Pacific is poised for significant growth, driven by rising disposable incomes and increasing prevalence of childhood disabilities. Within product types, powered wheelchairs command a higher price point and larger market segment than manual wheelchairs, although the manual wheelchair segment retains significant volume due to cost-effectiveness. Foldable wheelchairs are gaining popularity for their convenience and portability. Homecare settings represent the largest end-user segment, reflecting an increasing preference for at-home care and rehabilitation.
- Dominant Region: North America (Market Share: xx%)
- Fastest-Growing Region: Asia-Pacific (CAGR: xx%)
- Largest Product Segment: Powered Wheelchairs (Market Share: xx%)
- Largest End-User Segment: Homecare Settings (Market Share: xx%)
- Key Drivers: Increasing prevalence of childhood disabilities, rising healthcare expenditure, improved healthcare infrastructure, and government initiatives promoting accessibility.
Pediatric Wheelchair Industry Product Landscape
The pediatric wheelchair market offers a diverse range of products catering to specific needs and preferences. Key innovations include lightweight, adjustable frames, enhanced seating systems for posture support, and integrated safety features. Technological advancements encompass smart wheelchair technologies with features like GPS tracking and remote monitoring capabilities. Manufacturers are increasingly focusing on design aesthetics and user comfort to enhance the overall experience. Unique selling propositions include customizable features, advanced ergonomics, and improved durability.
Key Drivers, Barriers & Challenges in Pediatric Wheelchair Industry
Key Drivers: Increasing prevalence of childhood disabilities, rising healthcare expenditure, growing awareness of early intervention, technological advancements (lightweight materials, adjustable designs), and supportive government policies promoting accessibility.
Challenges: High manufacturing costs, stringent regulatory requirements, potential supply chain disruptions impacting material availability, intense competition, and the need to balance affordability and advanced features. These factors can lead to price increases impacting accessibility for some families. The estimated impact of supply chain issues on market growth is approximately xx% reduction by 2028.
Emerging Opportunities in Pediatric Wheelchair Industry
Untapped markets in developing economies present significant growth potential. Integration of smart technologies, such as telemedicine capabilities and remote monitoring features, offer enhanced care and cost efficiency. Personalized wheelchair designs, incorporating 3D printing and customization options, cater to individual needs and preferences. Furthermore, expanding into niche areas such as specialized pediatric sports wheelchairs creates further opportunities.
Growth Accelerators in the Pediatric Wheelchair Industry
Strategic partnerships between manufacturers and rehabilitation centers will streamline product development and distribution. Technological breakthroughs in lightweight materials and smart technology integration will significantly enhance product performance and accessibility. Market expansion into underserved regions, particularly through targeted marketing and partnerships with NGOs, will stimulate demand.
Key Players Shaping the Pediatric Wheelchair Industry Market
- Invacare
- MEYRA GmbH
- Momentum Healthcare
- AKCES-MED sp z o o
- Medline
- SORG Rollstuhltechnik GmbH
- Ottobock
- Permobil
- Sunrise Medical
Notable Milestones in Pediatric Wheelchair Industry Sector
- September 2022: Karma Medical launched the Flexx Adapt, a highly adjustable pediatric wheelchair.
- May 2022: CRINA received a donation of 107 pediatric wheelchairs from the US government.
In-Depth Pediatric Wheelchair Industry Market Outlook
The pediatric wheelchair market is poised for substantial growth, driven by technological innovation, increasing awareness, and expanding healthcare infrastructure. Strategic partnerships, market expansion into emerging economies, and the development of innovative products catering to diverse needs will shape the market's future trajectory. The market presents significant opportunities for manufacturers who can successfully navigate regulatory hurdles and meet the evolving needs of children with mobility impairments and their families.
Pediatric Wheelchair Industry Segmentation
-
1. Product Type
- 1.1. Manual
- 1.2. Powered
-
2. Frame Type
- 2.1. Rigid Wheelchairs
- 2.2. Foldable Wheelchairs
-
3. End User
- 3.1. Hopsitals
- 3.2. Homecare Setting
- 3.3. Other End Users
Pediatric Wheelchair Industry Segmentation By Geography
-
1. North America
- 1.1. United States
- 1.2. Canada
- 1.3. Mexico
-
2. Europe
- 2.1. Germany
- 2.2. United Kingdom
- 2.3. France
- 2.4. Italy
- 2.5. Spain
- 2.6. Rest of Europe
-
3. Asia Pacific
- 3.1. China
- 3.2. Japan
- 3.3. India
- 3.4. Australia
- 3.5. South Korea
- 3.6. Rest of Asia Pacific
-
4. Middle East and Africa
- 4.1. GCC
- 4.2. South Africa
- 4.3. Rest of Middle East and Africa
-
5. South America
- 5.1. Brazil
- 5.2. Argentina
- 5.3. Rest of South America
Pediatric Wheelchair Industry REPORT HIGHLIGHTS
| Aspects | Details |
|---|---|
| Study Period | 2019-2033 |
| Base Year | 2024 |
| Estimated Year | 2025 |
| Forecast Period | 2025-2033 |
| Historical Period | 2019-2024 |
| Growth Rate | CAGR of 5.30% from 2019-2033 |
| Segmentation |
|
Table of Contents
- 1. Introduction
- 1.1. Research Scope
- 1.2. Market Segmentation
- 1.3. Research Methodology
- 1.4. Definitions and Assumptions
- 2. Executive Summary
- 2.1. Introduction
- 3. Market Dynamics
- 3.1. Introduction
- 3.2. Market Drivers
- 3.2.1. Rising Incidences of Disabilities in Children; Supportive Government Policies and Funding
- 3.3. Market Restrains
- 3.3.1. High Cost of Paediatric Wheelchairs
- 3.4. Market Trends
- 3.4.1. Manual Wheelchairs Segment Dominates the Market and is Expected to do so in the Forecast Period
- 4. Market Factor Analysis
- 4.1. Porters Five Forces
- 4.2. Supply/Value Chain
- 4.3. PESTEL analysis
- 4.4. Market Entropy
- 4.5. Patent/Trademark Analysis
- 5. Global Pediatric Wheelchair Industry Analysis, Insights and Forecast, 2019-2031
- 5.1. Market Analysis, Insights and Forecast - by Product Type
- 5.1.1. Manual
- 5.1.2. Powered
- 5.2. Market Analysis, Insights and Forecast - by Frame Type
- 5.2.1. Rigid Wheelchairs
- 5.2.2. Foldable Wheelchairs
- 5.3. Market Analysis, Insights and Forecast - by End User
- 5.3.1. Hopsitals
- 5.3.2. Homecare Setting
- 5.3.3. Other End Users
- 5.4. Market Analysis, Insights and Forecast - by Region
- 5.4.1. North America
- 5.4.2. Europe
- 5.4.3. Asia Pacific
- 5.4.4. Middle East and Africa
- 5.4.5. South America
- 5.1. Market Analysis, Insights and Forecast - by Product Type
- 6. North America Pediatric Wheelchair Industry Analysis, Insights and Forecast, 2019-2031
- 6.1. Market Analysis, Insights and Forecast - by Product Type
- 6.1.1. Manual
- 6.1.2. Powered
- 6.2. Market Analysis, Insights and Forecast - by Frame Type
- 6.2.1. Rigid Wheelchairs
- 6.2.2. Foldable Wheelchairs
- 6.3. Market Analysis, Insights and Forecast - by End User
- 6.3.1. Hopsitals
- 6.3.2. Homecare Setting
- 6.3.3. Other End Users
- 6.1. Market Analysis, Insights and Forecast - by Product Type
- 7. Europe Pediatric Wheelchair Industry Analysis, Insights and Forecast, 2019-2031
- 7.1. Market Analysis, Insights and Forecast - by Product Type
- 7.1.1. Manual
- 7.1.2. Powered
- 7.2. Market Analysis, Insights and Forecast - by Frame Type
- 7.2.1. Rigid Wheelchairs
- 7.2.2. Foldable Wheelchairs
- 7.3. Market Analysis, Insights and Forecast - by End User
- 7.3.1. Hopsitals
- 7.3.2. Homecare Setting
- 7.3.3. Other End Users
- 7.1. Market Analysis, Insights and Forecast - by Product Type
- 8. Asia Pacific Pediatric Wheelchair Industry Analysis, Insights and Forecast, 2019-2031
- 8.1. Market Analysis, Insights and Forecast - by Product Type
- 8.1.1. Manual
- 8.1.2. Powered
- 8.2. Market Analysis, Insights and Forecast - by Frame Type
- 8.2.1. Rigid Wheelchairs
- 8.2.2. Foldable Wheelchairs
- 8.3. Market Analysis, Insights and Forecast - by End User
- 8.3.1. Hopsitals
- 8.3.2. Homecare Setting
- 8.3.3. Other End Users
- 8.1. Market Analysis, Insights and Forecast - by Product Type
- 9. Middle East and Africa Pediatric Wheelchair Industry Analysis, Insights and Forecast, 2019-2031
- 9.1. Market Analysis, Insights and Forecast - by Product Type
- 9.1.1. Manual
- 9.1.2. Powered
- 9.2. Market Analysis, Insights and Forecast - by Frame Type
- 9.2.1. Rigid Wheelchairs
- 9.2.2. Foldable Wheelchairs
- 9.3. Market Analysis, Insights and Forecast - by End User
- 9.3.1. Hopsitals
- 9.3.2. Homecare Setting
- 9.3.3. Other End Users
- 9.1. Market Analysis, Insights and Forecast - by Product Type
- 10. South America Pediatric Wheelchair Industry Analysis, Insights and Forecast, 2019-2031
- 10.1. Market Analysis, Insights and Forecast - by Product Type
- 10.1.1. Manual
- 10.1.2. Powered
- 10.2. Market Analysis, Insights and Forecast - by Frame Type
- 10.2.1. Rigid Wheelchairs
- 10.2.2. Foldable Wheelchairs
- 10.3. Market Analysis, Insights and Forecast - by End User
- 10.3.1. Hopsitals
- 10.3.2. Homecare Setting
- 10.3.3. Other End Users
- 10.1. Market Analysis, Insights and Forecast - by Product Type
- 11. North America Pediatric Wheelchair Industry Analysis, Insights and Forecast, 2019-2031
- 11.1. Market Analysis, Insights and Forecast - By Country/Sub-region
- 11.1.1 United States
- 11.1.2 Canada
- 11.1.3 Mexico
- 12. Europe Pediatric Wheelchair Industry Analysis, Insights and Forecast, 2019-2031
- 12.1. Market Analysis, Insights and Forecast - By Country/Sub-region
- 12.1.1 Germany
- 12.1.2 United Kingdom
- 12.1.3 France
- 12.1.4 Italy
- 12.1.5 Spain
- 12.1.6 Rest of Europe
- 13. Asia Pacific Pediatric Wheelchair Industry Analysis, Insights and Forecast, 2019-2031
- 13.1. Market Analysis, Insights and Forecast - By Country/Sub-region
- 13.1.1 China
- 13.1.2 Japan
- 13.1.3 India
- 13.1.4 Australia
- 13.1.5 South Korea
- 13.1.6 Rest of Asia Pacific
- 14. Middle East and Africa Pediatric Wheelchair Industry Analysis, Insights and Forecast, 2019-2031
- 14.1. Market Analysis, Insights and Forecast - By Country/Sub-region
- 14.1.1 GCC
- 14.1.2 South Africa
- 14.1.3 Rest of Middle East and Africa
- 15. South America Pediatric Wheelchair Industry Analysis, Insights and Forecast, 2019-2031
- 15.1. Market Analysis, Insights and Forecast - By Country/Sub-region
- 15.1.1 Brazil
- 15.1.2 Argentina
- 15.1.3 Rest of South America
- 16. Competitive Analysis
- 16.1. Global Market Share Analysis 2024
- 16.2. Company Profiles
- 16.2.1 Invacare
- 16.2.1.1. Overview
- 16.2.1.2. Products
- 16.2.1.3. SWOT Analysis
- 16.2.1.4. Recent Developments
- 16.2.1.5. Financials (Based on Availability)
- 16.2.2 MEYRA GmbH
- 16.2.2.1. Overview
- 16.2.2.2. Products
- 16.2.2.3. SWOT Analysis
- 16.2.2.4. Recent Developments
- 16.2.2.5. Financials (Based on Availability)
- 16.2.3 Momentum Healthcare
- 16.2.3.1. Overview
- 16.2.3.2. Products
- 16.2.3.3. SWOT Analysis
- 16.2.3.4. Recent Developments
- 16.2.3.5. Financials (Based on Availability)
- 16.2.4 AKCES-MED sp z o o
- 16.2.4.1. Overview
- 16.2.4.2. Products
- 16.2.4.3. SWOT Analysis
- 16.2.4.4. Recent Developments
- 16.2.4.5. Financials (Based on Availability)
- 16.2.5 Medline
- 16.2.5.1. Overview
- 16.2.5.2. Products
- 16.2.5.3. SWOT Analysis
- 16.2.5.4. Recent Developments
- 16.2.5.5. Financials (Based on Availability)
- 16.2.6 SORG Rollstuhltechnik GmbH
- 16.2.6.1. Overview
- 16.2.6.2. Products
- 16.2.6.3. SWOT Analysis
- 16.2.6.4. Recent Developments
- 16.2.6.5. Financials (Based on Availability)
- 16.2.7 Ottobock
- 16.2.7.1. Overview
- 16.2.7.2. Products
- 16.2.7.3. SWOT Analysis
- 16.2.7.4. Recent Developments
- 16.2.7.5. Financials (Based on Availability)
- 16.2.8 Permobil
- 16.2.8.1. Overview
- 16.2.8.2. Products
- 16.2.8.3. SWOT Analysis
- 16.2.8.4. Recent Developments
- 16.2.8.5. Financials (Based on Availability)
- 16.2.9 Sunrise Medical
- 16.2.9.1. Overview
- 16.2.9.2. Products
- 16.2.9.3. SWOT Analysis
- 16.2.9.4. Recent Developments
- 16.2.9.5. Financials (Based on Availability)
- 16.2.1 Invacare
List of Figures
- Figure 1: Global Pediatric Wheelchair Industry Revenue Breakdown (Million, %) by Region 2024 & 2032
- Figure 2: Global Pediatric Wheelchair Industry Volume Breakdown (K Unit, %) by Region 2024 & 2032
- Figure 3: North America Pediatric Wheelchair Industry Revenue (Million), by Country 2024 & 2032
- Figure 4: North America Pediatric Wheelchair Industry Volume (K Unit), by Country 2024 & 2032
- Figure 5: North America Pediatric Wheelchair Industry Revenue Share (%), by Country 2024 & 2032
- Figure 6: North America Pediatric Wheelchair Industry Volume Share (%), by Country 2024 & 2032
- Figure 7: Europe Pediatric Wheelchair Industry Revenue (Million), by Country 2024 & 2032
- Figure 8: Europe Pediatric Wheelchair Industry Volume (K Unit), by Country 2024 & 2032
- Figure 9: Europe Pediatric Wheelchair Industry Revenue Share (%), by Country 2024 & 2032
- Figure 10: Europe Pediatric Wheelchair Industry Volume Share (%), by Country 2024 & 2032
- Figure 11: Asia Pacific Pediatric Wheelchair Industry Revenue (Million), by Country 2024 & 2032
- Figure 12: Asia Pacific Pediatric Wheelchair Industry Volume (K Unit), by Country 2024 & 2032
- Figure 13: Asia Pacific Pediatric Wheelchair Industry Revenue Share (%), by Country 2024 & 2032
- Figure 14: Asia Pacific Pediatric Wheelchair Industry Volume Share (%), by Country 2024 & 2032
- Figure 15: Middle East and Africa Pediatric Wheelchair Industry Revenue (Million), by Country 2024 & 2032
- Figure 16: Middle East and Africa Pediatric Wheelchair Industry Volume (K Unit), by Country 2024 & 2032
- Figure 17: Middle East and Africa Pediatric Wheelchair Industry Revenue Share (%), by Country 2024 & 2032
- Figure 18: Middle East and Africa Pediatric Wheelchair Industry Volume Share (%), by Country 2024 & 2032
- Figure 19: South America Pediatric Wheelchair Industry Revenue (Million), by Country 2024 & 2032
- Figure 20: South America Pediatric Wheelchair Industry Volume (K Unit), by Country 2024 & 2032
- Figure 21: South America Pediatric Wheelchair Industry Revenue Share (%), by Country 2024 & 2032
- Figure 22: South America Pediatric Wheelchair Industry Volume Share (%), by Country 2024 & 2032
- Figure 23: North America Pediatric Wheelchair Industry Revenue (Million), by Product Type 2024 & 2032
- Figure 24: North America Pediatric Wheelchair Industry Volume (K Unit), by Product Type 2024 & 2032
- Figure 25: North America Pediatric Wheelchair Industry Revenue Share (%), by Product Type 2024 & 2032
- Figure 26: North America Pediatric Wheelchair Industry Volume Share (%), by Product Type 2024 & 2032
- Figure 27: North America Pediatric Wheelchair Industry Revenue (Million), by Frame Type 2024 & 2032
- Figure 28: North America Pediatric Wheelchair Industry Volume (K Unit), by Frame Type 2024 & 2032
- Figure 29: North America Pediatric Wheelchair Industry Revenue Share (%), by Frame Type 2024 & 2032
- Figure 30: North America Pediatric Wheelchair Industry Volume Share (%), by Frame Type 2024 & 2032
- Figure 31: North America Pediatric Wheelchair Industry Revenue (Million), by End User 2024 & 2032
- Figure 32: North America Pediatric Wheelchair Industry Volume (K Unit), by End User 2024 & 2032
- Figure 33: North America Pediatric Wheelchair Industry Revenue Share (%), by End User 2024 & 2032
- Figure 34: North America Pediatric Wheelchair Industry Volume Share (%), by End User 2024 & 2032
- Figure 35: North America Pediatric Wheelchair Industry Revenue (Million), by Country 2024 & 2032
- Figure 36: North America Pediatric Wheelchair Industry Volume (K Unit), by Country 2024 & 2032
- Figure 37: North America Pediatric Wheelchair Industry Revenue Share (%), by Country 2024 & 2032
- Figure 38: North America Pediatric Wheelchair Industry Volume Share (%), by Country 2024 & 2032
- Figure 39: Europe Pediatric Wheelchair Industry Revenue (Million), by Product Type 2024 & 2032
- Figure 40: Europe Pediatric Wheelchair Industry Volume (K Unit), by Product Type 2024 & 2032
- Figure 41: Europe Pediatric Wheelchair Industry Revenue Share (%), by Product Type 2024 & 2032
- Figure 42: Europe Pediatric Wheelchair Industry Volume Share (%), by Product Type 2024 & 2032
- Figure 43: Europe Pediatric Wheelchair Industry Revenue (Million), by Frame Type 2024 & 2032
- Figure 44: Europe Pediatric Wheelchair Industry Volume (K Unit), by Frame Type 2024 & 2032
- Figure 45: Europe Pediatric Wheelchair Industry Revenue Share (%), by Frame Type 2024 & 2032
- Figure 46: Europe Pediatric Wheelchair Industry Volume Share (%), by Frame Type 2024 & 2032
- Figure 47: Europe Pediatric Wheelchair Industry Revenue (Million), by End User 2024 & 2032
- Figure 48: Europe Pediatric Wheelchair Industry Volume (K Unit), by End User 2024 & 2032
- Figure 49: Europe Pediatric Wheelchair Industry Revenue Share (%), by End User 2024 & 2032
- Figure 50: Europe Pediatric Wheelchair Industry Volume Share (%), by End User 2024 & 2032
- Figure 51: Europe Pediatric Wheelchair Industry Revenue (Million), by Country 2024 & 2032
- Figure 52: Europe Pediatric Wheelchair Industry Volume (K Unit), by Country 2024 & 2032
- Figure 53: Europe Pediatric Wheelchair Industry Revenue Share (%), by Country 2024 & 2032
- Figure 54: Europe Pediatric Wheelchair Industry Volume Share (%), by Country 2024 & 2032
- Figure 55: Asia Pacific Pediatric Wheelchair Industry Revenue (Million), by Product Type 2024 & 2032
- Figure 56: Asia Pacific Pediatric Wheelchair Industry Volume (K Unit), by Product Type 2024 & 2032
- Figure 57: Asia Pacific Pediatric Wheelchair Industry Revenue Share (%), by Product Type 2024 & 2032
- Figure 58: Asia Pacific Pediatric Wheelchair Industry Volume Share (%), by Product Type 2024 & 2032
- Figure 59: Asia Pacific Pediatric Wheelchair Industry Revenue (Million), by Frame Type 2024 & 2032
- Figure 60: Asia Pacific Pediatric Wheelchair Industry Volume (K Unit), by Frame Type 2024 & 2032
- Figure 61: Asia Pacific Pediatric Wheelchair Industry Revenue Share (%), by Frame Type 2024 & 2032
- Figure 62: Asia Pacific Pediatric Wheelchair Industry Volume Share (%), by Frame Type 2024 & 2032
- Figure 63: Asia Pacific Pediatric Wheelchair Industry Revenue (Million), by End User 2024 & 2032
- Figure 64: Asia Pacific Pediatric Wheelchair Industry Volume (K Unit), by End User 2024 & 2032
- Figure 65: Asia Pacific Pediatric Wheelchair Industry Revenue Share (%), by End User 2024 & 2032
- Figure 66: Asia Pacific Pediatric Wheelchair Industry Volume Share (%), by End User 2024 & 2032
- Figure 67: Asia Pacific Pediatric Wheelchair Industry Revenue (Million), by Country 2024 & 2032
- Figure 68: Asia Pacific Pediatric Wheelchair Industry Volume (K Unit), by Country 2024 & 2032
- Figure 69: Asia Pacific Pediatric Wheelchair Industry Revenue Share (%), by Country 2024 & 2032
- Figure 70: Asia Pacific Pediatric Wheelchair Industry Volume Share (%), by Country 2024 & 2032
- Figure 71: Middle East and Africa Pediatric Wheelchair Industry Revenue (Million), by Product Type 2024 & 2032
- Figure 72: Middle East and Africa Pediatric Wheelchair Industry Volume (K Unit), by Product Type 2024 & 2032
- Figure 73: Middle East and Africa Pediatric Wheelchair Industry Revenue Share (%), by Product Type 2024 & 2032
- Figure 74: Middle East and Africa Pediatric Wheelchair Industry Volume Share (%), by Product Type 2024 & 2032
- Figure 75: Middle East and Africa Pediatric Wheelchair Industry Revenue (Million), by Frame Type 2024 & 2032
- Figure 76: Middle East and Africa Pediatric Wheelchair Industry Volume (K Unit), by Frame Type 2024 & 2032
- Figure 77: Middle East and Africa Pediatric Wheelchair Industry Revenue Share (%), by Frame Type 2024 & 2032
- Figure 78: Middle East and Africa Pediatric Wheelchair Industry Volume Share (%), by Frame Type 2024 & 2032
- Figure 79: Middle East and Africa Pediatric Wheelchair Industry Revenue (Million), by End User 2024 & 2032
- Figure 80: Middle East and Africa Pediatric Wheelchair Industry Volume (K Unit), by End User 2024 & 2032
- Figure 81: Middle East and Africa Pediatric Wheelchair Industry Revenue Share (%), by End User 2024 & 2032
- Figure 82: Middle East and Africa Pediatric Wheelchair Industry Volume Share (%), by End User 2024 & 2032
- Figure 83: Middle East and Africa Pediatric Wheelchair Industry Revenue (Million), by Country 2024 & 2032
- Figure 84: Middle East and Africa Pediatric Wheelchair Industry Volume (K Unit), by Country 2024 & 2032
- Figure 85: Middle East and Africa Pediatric Wheelchair Industry Revenue Share (%), by Country 2024 & 2032
- Figure 86: Middle East and Africa Pediatric Wheelchair Industry Volume Share (%), by Country 2024 & 2032
- Figure 87: South America Pediatric Wheelchair Industry Revenue (Million), by Product Type 2024 & 2032
- Figure 88: South America Pediatric Wheelchair Industry Volume (K Unit), by Product Type 2024 & 2032
- Figure 89: South America Pediatric Wheelchair Industry Revenue Share (%), by Product Type 2024 & 2032
- Figure 90: South America Pediatric Wheelchair Industry Volume Share (%), by Product Type 2024 & 2032
- Figure 91: South America Pediatric Wheelchair Industry Revenue (Million), by Frame Type 2024 & 2032
- Figure 92: South America Pediatric Wheelchair Industry Volume (K Unit), by Frame Type 2024 & 2032
- Figure 93: South America Pediatric Wheelchair Industry Revenue Share (%), by Frame Type 2024 & 2032
- Figure 94: South America Pediatric Wheelchair Industry Volume Share (%), by Frame Type 2024 & 2032
- Figure 95: South America Pediatric Wheelchair Industry Revenue (Million), by End User 2024 & 2032
- Figure 96: South America Pediatric Wheelchair Industry Volume (K Unit), by End User 2024 & 2032
- Figure 97: South America Pediatric Wheelchair Industry Revenue Share (%), by End User 2024 & 2032
- Figure 98: South America Pediatric Wheelchair Industry Volume Share (%), by End User 2024 & 2032
- Figure 99: South America Pediatric Wheelchair Industry Revenue (Million), by Country 2024 & 2032
- Figure 100: South America Pediatric Wheelchair Industry Volume (K Unit), by Country 2024 & 2032
- Figure 101: South America Pediatric Wheelchair Industry Revenue Share (%), by Country 2024 & 2032
- Figure 102: South America Pediatric Wheelchair Industry Volume Share (%), by Country 2024 & 2032
List of Tables
- Table 1: Global Pediatric Wheelchair Industry Revenue Million Forecast, by Region 2019 & 2032
- Table 2: Global Pediatric Wheelchair Industry Volume K Unit Forecast, by Region 2019 & 2032
- Table 3: Global Pediatric Wheelchair Industry Revenue Million Forecast, by Product Type 2019 & 2032
- Table 4: Global Pediatric Wheelchair Industry Volume K Unit Forecast, by Product Type 2019 & 2032
- Table 5: Global Pediatric Wheelchair Industry Revenue Million Forecast, by Frame Type 2019 & 2032
- Table 6: Global Pediatric Wheelchair Industry Volume K Unit Forecast, by Frame Type 2019 & 2032
- Table 7: Global Pediatric Wheelchair Industry Revenue Million Forecast, by End User 2019 & 2032
- Table 8: Global Pediatric Wheelchair Industry Volume K Unit Forecast, by End User 2019 & 2032
- Table 9: Global Pediatric Wheelchair Industry Revenue Million Forecast, by Region 2019 & 2032
- Table 10: Global Pediatric Wheelchair Industry Volume K Unit Forecast, by Region 2019 & 2032
- Table 11: Global Pediatric Wheelchair Industry Revenue Million Forecast, by Country 2019 & 2032
- Table 12: Global Pediatric Wheelchair Industry Volume K Unit Forecast, by Country 2019 & 2032
- Table 13: United States Pediatric Wheelchair Industry Revenue (Million) Forecast, by Application 2019 & 2032
- Table 14: United States Pediatric Wheelchair Industry Volume (K Unit) Forecast, by Application 2019 & 2032
- Table 15: Canada Pediatric Wheelchair Industry Revenue (Million) Forecast, by Application 2019 & 2032
- Table 16: Canada Pediatric Wheelchair Industry Volume (K Unit) Forecast, by Application 2019 & 2032
- Table 17: Mexico Pediatric Wheelchair Industry Revenue (Million) Forecast, by Application 2019 & 2032
- Table 18: Mexico Pediatric Wheelchair Industry Volume (K Unit) Forecast, by Application 2019 & 2032
- Table 19: Global Pediatric Wheelchair Industry Revenue Million Forecast, by Country 2019 & 2032
- Table 20: Global Pediatric Wheelchair Industry Volume K Unit Forecast, by Country 2019 & 2032
- Table 21: Germany Pediatric Wheelchair Industry Revenue (Million) Forecast, by Application 2019 & 2032
- Table 22: Germany Pediatric Wheelchair Industry Volume (K Unit) Forecast, by Application 2019 & 2032
- Table 23: United Kingdom Pediatric Wheelchair Industry Revenue (Million) Forecast, by Application 2019 & 2032
- Table 24: United Kingdom Pediatric Wheelchair Industry Volume (K Unit) Forecast, by Application 2019 & 2032
- Table 25: France Pediatric Wheelchair Industry Revenue (Million) Forecast, by Application 2019 & 2032
- Table 26: France Pediatric Wheelchair Industry Volume (K Unit) Forecast, by Application 2019 & 2032
- Table 27: Italy Pediatric Wheelchair Industry Revenue (Million) Forecast, by Application 2019 & 2032
- Table 28: Italy Pediatric Wheelchair Industry Volume (K Unit) Forecast, by Application 2019 & 2032
- Table 29: Spain Pediatric Wheelchair Industry Revenue (Million) Forecast, by Application 2019 & 2032
- Table 30: Spain Pediatric Wheelchair Industry Volume (K Unit) Forecast, by Application 2019 & 2032
- Table 31: Rest of Europe Pediatric Wheelchair Industry Revenue (Million) Forecast, by Application 2019 & 2032
- Table 32: Rest of Europe Pediatric Wheelchair Industry Volume (K Unit) Forecast, by Application 2019 & 2032
- Table 33: Global Pediatric Wheelchair Industry Revenue Million Forecast, by Country 2019 & 2032
- Table 34: Global Pediatric Wheelchair Industry Volume K Unit Forecast, by Country 2019 & 2032
- Table 35: China Pediatric Wheelchair Industry Revenue (Million) Forecast, by Application 2019 & 2032
- Table 36: China Pediatric Wheelchair Industry Volume (K Unit) Forecast, by Application 2019 & 2032
- Table 37: Japan Pediatric Wheelchair Industry Revenue (Million) Forecast, by Application 2019 & 2032
- Table 38: Japan Pediatric Wheelchair Industry Volume (K Unit) Forecast, by Application 2019 & 2032
- Table 39: India Pediatric Wheelchair Industry Revenue (Million) Forecast, by Application 2019 & 2032
- Table 40: India Pediatric Wheelchair Industry Volume (K Unit) Forecast, by Application 2019 & 2032
- Table 41: Australia Pediatric Wheelchair Industry Revenue (Million) Forecast, by Application 2019 & 2032
- Table 42: Australia Pediatric Wheelchair Industry Volume (K Unit) Forecast, by Application 2019 & 2032
- Table 43: South Korea Pediatric Wheelchair Industry Revenue (Million) Forecast, by Application 2019 & 2032
- Table 44: South Korea Pediatric Wheelchair Industry Volume (K Unit) Forecast, by Application 2019 & 2032
- Table 45: Rest of Asia Pacific Pediatric Wheelchair Industry Revenue (Million) Forecast, by Application 2019 & 2032
- Table 46: Rest of Asia Pacific Pediatric Wheelchair Industry Volume (K Unit) Forecast, by Application 2019 & 2032
- Table 47: Global Pediatric Wheelchair Industry Revenue Million Forecast, by Country 2019 & 2032
- Table 48: Global Pediatric Wheelchair Industry Volume K Unit Forecast, by Country 2019 & 2032
- Table 49: GCC Pediatric Wheelchair Industry Revenue (Million) Forecast, by Application 2019 & 2032
- Table 50: GCC Pediatric Wheelchair Industry Volume (K Unit) Forecast, by Application 2019 & 2032
- Table 51: South Africa Pediatric Wheelchair Industry Revenue (Million) Forecast, by Application 2019 & 2032
- Table 52: South Africa Pediatric Wheelchair Industry Volume (K Unit) Forecast, by Application 2019 & 2032
- Table 53: Rest of Middle East and Africa Pediatric Wheelchair Industry Revenue (Million) Forecast, by Application 2019 & 2032
- Table 54: Rest of Middle East and Africa Pediatric Wheelchair Industry Volume (K Unit) Forecast, by Application 2019 & 2032
- Table 55: Global Pediatric Wheelchair Industry Revenue Million Forecast, by Country 2019 & 2032
- Table 56: Global Pediatric Wheelchair Industry Volume K Unit Forecast, by Country 2019 & 2032
- Table 57: Brazil Pediatric Wheelchair Industry Revenue (Million) Forecast, by Application 2019 & 2032
- Table 58: Brazil Pediatric Wheelchair Industry Volume (K Unit) Forecast, by Application 2019 & 2032
- Table 59: Argentina Pediatric Wheelchair Industry Revenue (Million) Forecast, by Application 2019 & 2032
- Table 60: Argentina Pediatric Wheelchair Industry Volume (K Unit) Forecast, by Application 2019 & 2032
- Table 61: Rest of South America Pediatric Wheelchair Industry Revenue (Million) Forecast, by Application 2019 & 2032
- Table 62: Rest of South America Pediatric Wheelchair Industry Volume (K Unit) Forecast, by Application 2019 & 2032
- Table 63: Global Pediatric Wheelchair Industry Revenue Million Forecast, by Product Type 2019 & 2032
- Table 64: Global Pediatric Wheelchair Industry Volume K Unit Forecast, by Product Type 2019 & 2032
- Table 65: Global Pediatric Wheelchair Industry Revenue Million Forecast, by Frame Type 2019 & 2032
- Table 66: Global Pediatric Wheelchair Industry Volume K Unit Forecast, by Frame Type 2019 & 2032
- Table 67: Global Pediatric Wheelchair Industry Revenue Million Forecast, by End User 2019 & 2032
- Table 68: Global Pediatric Wheelchair Industry Volume K Unit Forecast, by End User 2019 & 2032
- Table 69: Global Pediatric Wheelchair Industry Revenue Million Forecast, by Country 2019 & 2032
- Table 70: Global Pediatric Wheelchair Industry Volume K Unit Forecast, by Country 2019 & 2032
- Table 71: United States Pediatric Wheelchair Industry Revenue (Million) Forecast, by Application 2019 & 2032
- Table 72: United States Pediatric Wheelchair Industry Volume (K Unit) Forecast, by Application 2019 & 2032
- Table 73: Canada Pediatric Wheelchair Industry Revenue (Million) Forecast, by Application 2019 & 2032
- Table 74: Canada Pediatric Wheelchair Industry Volume (K Unit) Forecast, by Application 2019 & 2032
- Table 75: Mexico Pediatric Wheelchair Industry Revenue (Million) Forecast, by Application 2019 & 2032
- Table 76: Mexico Pediatric Wheelchair Industry Volume (K Unit) Forecast, by Application 2019 & 2032
- Table 77: Global Pediatric Wheelchair Industry Revenue Million Forecast, by Product Type 2019 & 2032
- Table 78: Global Pediatric Wheelchair Industry Volume K Unit Forecast, by Product Type 2019 & 2032
- Table 79: Global Pediatric Wheelchair Industry Revenue Million Forecast, by Frame Type 2019 & 2032
- Table 80: Global Pediatric Wheelchair Industry Volume K Unit Forecast, by Frame Type 2019 & 2032
- Table 81: Global Pediatric Wheelchair Industry Revenue Million Forecast, by End User 2019 & 2032
- Table 82: Global Pediatric Wheelchair Industry Volume K Unit Forecast, by End User 2019 & 2032
- Table 83: Global Pediatric Wheelchair Industry Revenue Million Forecast, by Country 2019 & 2032
- Table 84: Global Pediatric Wheelchair Industry Volume K Unit Forecast, by Country 2019 & 2032
- Table 85: Germany Pediatric Wheelchair Industry Revenue (Million) Forecast, by Application 2019 & 2032
- Table 86: Germany Pediatric Wheelchair Industry Volume (K Unit) Forecast, by Application 2019 & 2032
- Table 87: United Kingdom Pediatric Wheelchair Industry Revenue (Million) Forecast, by Application 2019 & 2032
- Table 88: United Kingdom Pediatric Wheelchair Industry Volume (K Unit) Forecast, by Application 2019 & 2032
- Table 89: France Pediatric Wheelchair Industry Revenue (Million) Forecast, by Application 2019 & 2032
- Table 90: France Pediatric Wheelchair Industry Volume (K Unit) Forecast, by Application 2019 & 2032
- Table 91: Italy Pediatric Wheelchair Industry Revenue (Million) Forecast, by Application 2019 & 2032
- Table 92: Italy Pediatric Wheelchair Industry Volume (K Unit) Forecast, by Application 2019 & 2032
- Table 93: Spain Pediatric Wheelchair Industry Revenue (Million) Forecast, by Application 2019 & 2032
- Table 94: Spain Pediatric Wheelchair Industry Volume (K Unit) Forecast, by Application 2019 & 2032
- Table 95: Rest of Europe Pediatric Wheelchair Industry Revenue (Million) Forecast, by Application 2019 & 2032
- Table 96: Rest of Europe Pediatric Wheelchair Industry Volume (K Unit) Forecast, by Application 2019 & 2032
- Table 97: Global Pediatric Wheelchair Industry Revenue Million Forecast, by Product Type 2019 & 2032
- Table 98: Global Pediatric Wheelchair Industry Volume K Unit Forecast, by Product Type 2019 & 2032
- Table 99: Global Pediatric Wheelchair Industry Revenue Million Forecast, by Frame Type 2019 & 2032
- Table 100: Global Pediatric Wheelchair Industry Volume K Unit Forecast, by Frame Type 2019 & 2032
- Table 101: Global Pediatric Wheelchair Industry Revenue Million Forecast, by End User 2019 & 2032
- Table 102: Global Pediatric Wheelchair Industry Volume K Unit Forecast, by End User 2019 & 2032
- Table 103: Global Pediatric Wheelchair Industry Revenue Million Forecast, by Country 2019 & 2032
- Table 104: Global Pediatric Wheelchair Industry Volume K Unit Forecast, by Country 2019 & 2032
- Table 105: China Pediatric Wheelchair Industry Revenue (Million) Forecast, by Application 2019 & 2032
- Table 106: China Pediatric Wheelchair Industry Volume (K Unit) Forecast, by Application 2019 & 2032
- Table 107: Japan Pediatric Wheelchair Industry Revenue (Million) Forecast, by Application 2019 & 2032
- Table 108: Japan Pediatric Wheelchair Industry Volume (K Unit) Forecast, by Application 2019 & 2032
- Table 109: India Pediatric Wheelchair Industry Revenue (Million) Forecast, by Application 2019 & 2032
- Table 110: India Pediatric Wheelchair Industry Volume (K Unit) Forecast, by Application 2019 & 2032
- Table 111: Australia Pediatric Wheelchair Industry Revenue (Million) Forecast, by Application 2019 & 2032
- Table 112: Australia Pediatric Wheelchair Industry Volume (K Unit) Forecast, by Application 2019 & 2032
- Table 113: South Korea Pediatric Wheelchair Industry Revenue (Million) Forecast, by Application 2019 & 2032
- Table 114: South Korea Pediatric Wheelchair Industry Volume (K Unit) Forecast, by Application 2019 & 2032
- Table 115: Rest of Asia Pacific Pediatric Wheelchair Industry Revenue (Million) Forecast, by Application 2019 & 2032
- Table 116: Rest of Asia Pacific Pediatric Wheelchair Industry Volume (K Unit) Forecast, by Application 2019 & 2032
- Table 117: Global Pediatric Wheelchair Industry Revenue Million Forecast, by Product Type 2019 & 2032
- Table 118: Global Pediatric Wheelchair Industry Volume K Unit Forecast, by Product Type 2019 & 2032
- Table 119: Global Pediatric Wheelchair Industry Revenue Million Forecast, by Frame Type 2019 & 2032
- Table 120: Global Pediatric Wheelchair Industry Volume K Unit Forecast, by Frame Type 2019 & 2032
- Table 121: Global Pediatric Wheelchair Industry Revenue Million Forecast, by End User 2019 & 2032
- Table 122: Global Pediatric Wheelchair Industry Volume K Unit Forecast, by End User 2019 & 2032
- Table 123: Global Pediatric Wheelchair Industry Revenue Million Forecast, by Country 2019 & 2032
- Table 124: Global Pediatric Wheelchair Industry Volume K Unit Forecast, by Country 2019 & 2032
- Table 125: GCC Pediatric Wheelchair Industry Revenue (Million) Forecast, by Application 2019 & 2032
- Table 126: GCC Pediatric Wheelchair Industry Volume (K Unit) Forecast, by Application 2019 & 2032
- Table 127: South Africa Pediatric Wheelchair Industry Revenue (Million) Forecast, by Application 2019 & 2032
- Table 128: South Africa Pediatric Wheelchair Industry Volume (K Unit) Forecast, by Application 2019 & 2032
- Table 129: Rest of Middle East and Africa Pediatric Wheelchair Industry Revenue (Million) Forecast, by Application 2019 & 2032
- Table 130: Rest of Middle East and Africa Pediatric Wheelchair Industry Volume (K Unit) Forecast, by Application 2019 & 2032
- Table 131: Global Pediatric Wheelchair Industry Revenue Million Forecast, by Product Type 2019 & 2032
- Table 132: Global Pediatric Wheelchair Industry Volume K Unit Forecast, by Product Type 2019 & 2032
- Table 133: Global Pediatric Wheelchair Industry Revenue Million Forecast, by Frame Type 2019 & 2032
- Table 134: Global Pediatric Wheelchair Industry Volume K Unit Forecast, by Frame Type 2019 & 2032
- Table 135: Global Pediatric Wheelchair Industry Revenue Million Forecast, by End User 2019 & 2032
- Table 136: Global Pediatric Wheelchair Industry Volume K Unit Forecast, by End User 2019 & 2032
- Table 137: Global Pediatric Wheelchair Industry Revenue Million Forecast, by Country 2019 & 2032
- Table 138: Global Pediatric Wheelchair Industry Volume K Unit Forecast, by Country 2019 & 2032
- Table 139: Brazil Pediatric Wheelchair Industry Revenue (Million) Forecast, by Application 2019 & 2032
- Table 140: Brazil Pediatric Wheelchair Industry Volume (K Unit) Forecast, by Application 2019 & 2032
- Table 141: Argentina Pediatric Wheelchair Industry Revenue (Million) Forecast, by Application 2019 & 2032
- Table 142: Argentina Pediatric Wheelchair Industry Volume (K Unit) Forecast, by Application 2019 & 2032
- Table 143: Rest of South America Pediatric Wheelchair Industry Revenue (Million) Forecast, by Application 2019 & 2032
- Table 144: Rest of South America Pediatric Wheelchair Industry Volume (K Unit) Forecast, by Application 2019 & 2032
Frequently Asked Questions
1. What is the projected Compound Annual Growth Rate (CAGR) of the Pediatric Wheelchair Industry?
The projected CAGR is approximately 5.30%.
2. Which companies are prominent players in the Pediatric Wheelchair Industry?
Key companies in the market include Invacare, MEYRA GmbH, Momentum Healthcare, AKCES-MED sp z o o, Medline, SORG Rollstuhltechnik GmbH, Ottobock, Permobil, Sunrise Medical.
3. What are the main segments of the Pediatric Wheelchair Industry?
The market segments include Product Type, Frame Type, End User.
4. Can you provide details about the market size?
The market size is estimated to be USD XX Million as of 2022.
5. What are some drivers contributing to market growth?
Rising Incidences of Disabilities in Children; Supportive Government Policies and Funding.
6. What are the notable trends driving market growth?
Manual Wheelchairs Segment Dominates the Market and is Expected to do so in the Forecast Period.
7. Are there any restraints impacting market growth?
High Cost of Paediatric Wheelchairs.
8. Can you provide examples of recent developments in the market?
In September 2022, Mobility solution manufacturer Karma Medical launched a new pediatric wheelchair at Rehacare 2022 in Dusseldorf, Germany. The Flexx Adapt is a highly adjustable pediatric wheelchair that grows with the child to provide a safe, supportive, and comfortable wheelchair experience.
9. What pricing options are available for accessing the report?
Pricing options include single-user, multi-user, and enterprise licenses priced at USD 4750, USD 5250, and USD 8750 respectively.
10. Is the market size provided in terms of value or volume?
The market size is provided in terms of value, measured in Million and volume, measured in K Unit.
11. Are there any specific market keywords associated with the report?
Yes, the market keyword associated with the report is "Pediatric Wheelchair Industry," which aids in identifying and referencing the specific market segment covered.
12. How do I determine which pricing option suits my needs best?
The pricing options vary based on user requirements and access needs. Individual users may opt for single-user licenses, while businesses requiring broader access may choose multi-user or enterprise licenses for cost-effective access to the report.
13. Are there any additional resources or data provided in the Pediatric Wheelchair Industry report?
While the report offers comprehensive insights, it's advisable to review the specific contents or supplementary materials provided to ascertain if additional resources or data are available.
14. How can I stay updated on further developments or reports in the Pediatric Wheelchair Industry?
To stay informed about further developments, trends, and reports in the Pediatric Wheelchair Industry, consider subscribing to industry newsletters, following relevant companies and organizations, or regularly checking reputable industry news sources and publications.
Methodology
Step 1 - Identification of Relevant Samples Size from Population Database


Step 2 - Approaches for Defining Global Market Size (Value, Volume* & Price*)

Note*: In applicable scenarios
Step 3 - Data Sources
Primary Research
- Web Analytics
- Survey Reports
- Research Institute
- Latest Research Reports
- Opinion Leaders
Secondary Research
- Annual Reports
- White Paper
- Latest Press Release
- Industry Association
- Paid Database
- Investor Presentations

Step 4 - Data Triangulation
Involves using different sources of information in order to increase the validity of a study
These sources are likely to be stakeholders in a program - participants, other researchers, program staff, other community members, and so on.
Then we put all data in single framework & apply various statistical tools to find out the dynamic on the market.
During the analysis stage, feedback from the stakeholder groups would be compared to determine areas of agreement as well as areas of divergence
