

Key Insights
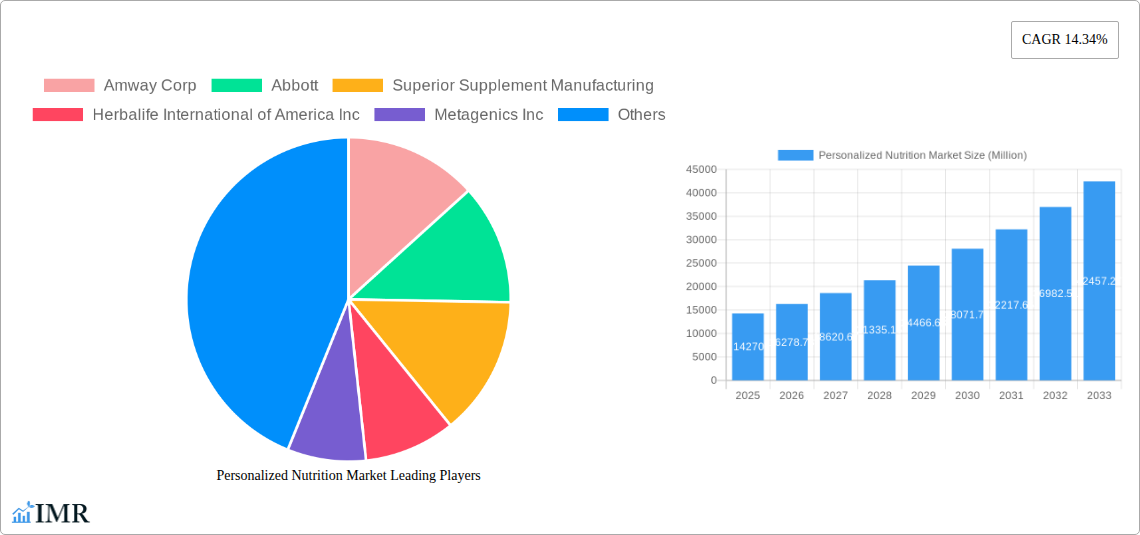
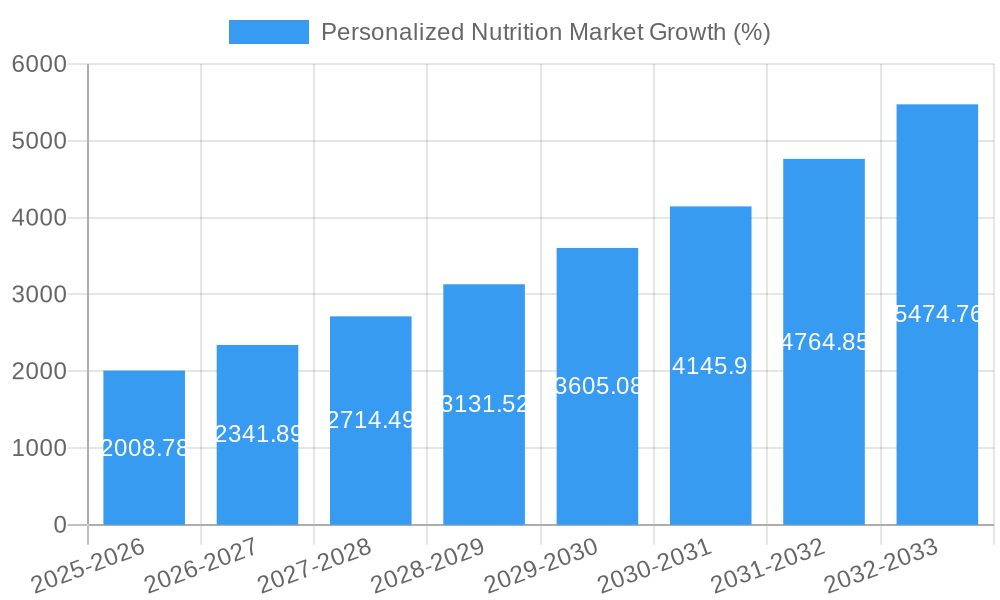
The personalized nutrition market is experiencing robust growth, projected to reach a market size of $14.27 billion in 2025, expanding at a compound annual growth rate (CAGR) of 14.34% from 2025 to 2033. This surge is driven by several key factors. Increasing consumer awareness of the link between nutrition and overall health, coupled with the rising prevalence of chronic diseases like diabetes and heart disease, fuels demand for tailored nutritional solutions. Technological advancements, particularly in genomics and data analytics, enable the creation of highly personalized dietary recommendations and supplement regimens, further accelerating market expansion. The convenience of direct-to-consumer testing kits and personalized meal delivery services also contributes to market growth. Furthermore, the increasing adoption of wearable technology that tracks individual health metrics, provides valuable data for refining personalized nutrition plans, further enhancing the effectiveness and appeal of these solutions.
Major players like Amway, Abbott, and Herbalife are driving innovation and competition within the sector, constantly refining their product offerings and service delivery models. However, the market faces challenges including the high cost of personalized nutrition plans, potential data privacy concerns, and the need for greater regulatory clarity surrounding the efficacy and safety of personalized supplements. Despite these restraints, the long-term outlook for the personalized nutrition market remains extremely positive, fueled by continuous technological progress, expanding consumer awareness, and a growing focus on preventative healthcare. The market is segmented by product type (e.g., supplements, meal replacements, functional foods), delivery method (e.g., online, in-person consultations), and target consumer groups (e.g., athletes, individuals with specific health conditions). Future growth will likely be influenced by the successful integration of artificial intelligence and machine learning to improve the accuracy and personalization of nutritional recommendations.
Personalized Nutrition Market: A Comprehensive Market Report (2019-2033)
This comprehensive report delivers an in-depth analysis of the Personalized Nutrition Market, encompassing market dynamics, growth trends, regional insights, product landscape, key players, and future outlook. The study period covers 2019-2033, with a base year of 2025 and a forecast period of 2025-2033. This report serves as an invaluable resource for industry professionals, investors, and strategic decision-makers seeking to navigate this rapidly evolving market. The parent market is the broader dietary supplements market valued at xx Million in 2024, while the child market focuses specifically on personalized nutrition solutions.
Personalized Nutrition Market Market Dynamics & Structure
The Personalized Nutrition Market is characterized by moderate concentration, with several key players vying for market share. Technological innovation, particularly in genomics and data analytics, is a significant driver, while regulatory frameworks vary across regions, impacting market entry and product development. Competitive substitutes include traditional dietary supplements and generic nutritional products. End-user demographics are expanding, driven by increasing health consciousness and awareness of personalized healthcare. M&A activity is relatively moderate.
- Market Concentration: Moderately concentrated, with top 5 players holding approximately xx% market share in 2024.
- Technological Innovation: Rapid advancements in genomics, AI, and data analytics are driving product differentiation and personalization.
- Regulatory Landscape: Varying regulatory frameworks across regions create challenges for market standardization and expansion.
- Competitive Substitutes: Traditional dietary supplements, generic vitamins and minerals pose a competitive threat.
- End-User Demographics: Growing health consciousness, rising disposable incomes, and increased awareness of personalized medicine fuel market growth. The primary end-users are health-conscious individuals, athletes, and patients with specific dietary needs.
- M&A Trends: A moderate number of mergers and acquisitions, primarily focused on enhancing technological capabilities and expanding product portfolios (xx deals in the past 5 years).
Personalized Nutrition Market Growth Trends & Insights
The Personalized Nutrition Market is experiencing robust growth, driven by increasing consumer demand for tailored health solutions. Market size is projected to reach xx Million by 2033, exhibiting a CAGR of xx% during the forecast period (2025-2033). This growth is fueled by rising adoption rates of personalized nutrition plans, technological advancements enabling precise nutrient profiling, and changing consumer preferences towards proactive healthcare management. Technological disruptions like AI-driven nutritional recommendations and advanced genetic testing are significantly impacting market dynamics. Consumer behavior is shifting towards a more personalized and data-driven approach to health and wellness.
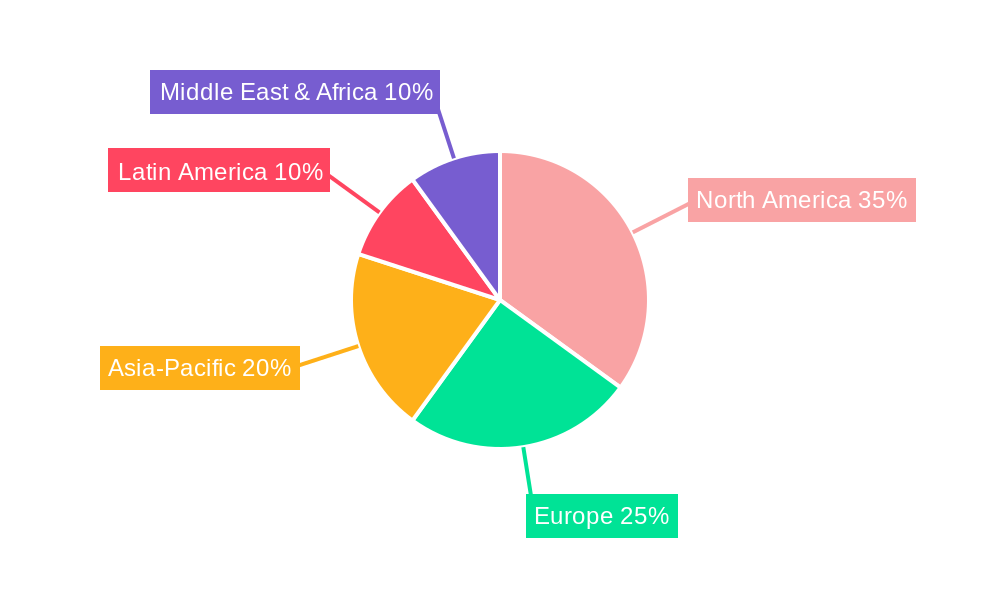
Dominant Regions, Countries, or Segments in Personalized Nutrition Market
North America currently holds the largest market share, driven by high consumer spending on wellness, robust technological infrastructure, and early adoption of personalized nutrition solutions. Europe and Asia-Pacific are also witnessing significant growth, with increasing health awareness and rising disposable incomes. The direct-to-consumer (DTC) segment exhibits the highest growth potential due to its convenience and personalized approach.
- North America: High consumer awareness, advanced technological capabilities, and early adoption of personalized healthcare solutions.
- Europe: Growing health consciousness, increasing demand for preventative healthcare, and expanding digital health infrastructure.
- Asia-Pacific: Rising disposable incomes, increasing health awareness, and substantial untapped market potential.
- DTC Segment: High growth potential due to convenience, personalized experiences, and direct engagement with consumers.
Personalized Nutrition Market Product Landscape
The Personalized Nutrition Market offers a diverse range of products, including customized vitamin and mineral blends, personalized meal plans, and targeted supplements based on individual genetic profiles and dietary needs. These products leverage advanced technologies such as genetic testing, microbiome analysis, and AI-powered dietary recommendations to provide highly personalized solutions. Unique selling propositions often include improved efficacy, reduced side effects, and increased adherence rates. Technological advancements continuously enhance product accuracy, efficacy, and user experience.
Key Drivers, Barriers & Challenges in Personalized Nutrition Market
Key Drivers: Rising health consciousness, increasing prevalence of chronic diseases, advancements in genetic testing and data analytics, and growing adoption of personalized medicine are key drivers. Government initiatives promoting preventative healthcare also contribute significantly.
Key Barriers and Challenges: High initial costs of personalized nutrition plans, concerns about data privacy and security, regulatory uncertainties regarding personalized health products, and the potential for inaccurate or misleading information pose significant challenges. Supply chain complexities and variability in product quality can also affect market growth. Competition from established players and new entrants adds further pressure.
Emerging Opportunities in Personalized Nutrition Market
Untapped markets in developing economies, integration with wearable health technology, expansion into specialized health conditions (e.g., diabetes, cardiovascular disease), and personalized sports nutrition represent significant growth opportunities. Developing innovative delivery systems (e.g., micro-nutrient blends) and creating personalized nutrition programs for specific demographics (e.g., children, elderly) can unlock significant market potential.
Growth Accelerators in the Personalized Nutrition Market Industry
Technological advancements such as AI-powered dietary recommendations, precision nutrition approaches that incorporate microbiome data, and seamless integration with health tracking apps are driving market expansion. Strategic partnerships between healthcare providers, technology companies, and supplement manufacturers enhance market reach and consumer adoption. Expanding into untapped international markets and focusing on specialized health conditions will fuel further growth.
Key Players Shaping the Personalized Nutrition Market Market
- Amway Corp
- Abbott
- Superior Supplement Manufacturing
- Herbalife International of America Inc
- Metagenics Inc
- GX Sciences LLC
- Nutralliance
- Divine Design Manufacturing
- Archer Daniels Midland Company (ADM)
- Viome Life Sciences Inc
- List Not Exhaustive
Notable Milestones in Personalized Nutrition Market Sector
- February 2024: Riise launched personalized microgranule nutrient blends, simplifying supplement intake.
- September 2024: Bioniq partnered with Truemed, enabling HSA/FSA coverage for its supplements.
In-Depth Personalized Nutrition Market Market Outlook
The Personalized Nutrition Market is poised for continued expansion, fueled by technological innovation, increasing health awareness, and expanding consumer adoption. Strategic partnerships, market expansion into new geographic regions, and the development of innovative products tailored to specific health needs will drive future market growth. The market presents significant opportunities for companies that can effectively leverage technological advancements, build strong data analytics capabilities, and address consumer demand for personalized health solutions.
Personalized Nutrition Market Segmentation
-
1. Product Type
- 1.1. Active Measurement
- 1.2. Standard Measurement
-
2. Application
- 2.1. Standard Supplements
- 2.2. Disease-based
-
3. End User
- 3.1. Direct-to-Consumer
- 3.2. Wellness and Fitness Centers
- 3.3. Hospitals and Clinics
- 3.4. Research Institutions
Personalized Nutrition Market Segmentation By Geography
-
1. North America
- 1.1. United States
- 1.2. Canada
- 1.3. Mexico
-
2. Europe
- 2.1. Germany
- 2.2. United Kingdom
- 2.3. France
- 2.4. Italy
- 2.5. Spain
- 2.6. Rest of Europe
-
3. Asia Pacific
- 3.1. China
- 3.2. Japan
- 3.3. India
- 3.4. Australia
- 3.5. South Korea
- 3.6. Rest of Asia Pacific
-
4. Middle East and Africa
- 4.1. GCC
- 4.2. South Africa
- 4.3. Rest of Middle East and Africa
-
5. South America
- 5.1. Brazil
- 5.2. Argentina
- 5.3. Rest of South America
Personalized Nutrition Market REPORT HIGHLIGHTS
| Aspects | Details |
|---|---|
| Study Period | 2019-2033 |
| Base Year | 2024 |
| Estimated Year | 2025 |
| Forecast Period | 2025-2033 |
| Historical Period | 2019-2024 |
| Growth Rate | CAGR of 14.34% from 2019-2033 |
| Segmentation |
|
Table of Contents
- 1. Introduction
- 1.1. Research Scope
- 1.2. Market Segmentation
- 1.3. Research Methodology
- 1.4. Definitions and Assumptions
- 2. Executive Summary
- 2.1. Introduction
- 3. Market Dynamics
- 3.1. Introduction
- 3.2. Market Drivers
- 3.2.1. Shift in Consumer Preference Due to a Rise in Health Awareness; Increasing Burden of Chronic Diseases and Geriatric Population; Technological Advancements and Growing Trend of Digital Healthcare
- 3.3. Market Restrains
- 3.3.1. Shift in Consumer Preference Due to a Rise in Health Awareness; Increasing Burden of Chronic Diseases and Geriatric Population; Technological Advancements and Growing Trend of Digital Healthcare
- 3.4. Market Trends
- 3.4.1. Disease-based Segment Expected to Hold a Significant Share Over the Forecast Period
- 4. Market Factor Analysis
- 4.1. Porters Five Forces
- 4.2. Supply/Value Chain
- 4.3. PESTEL analysis
- 4.4. Market Entropy
- 4.5. Patent/Trademark Analysis
- 5. Global Personalized Nutrition Market Analysis, Insights and Forecast, 2019-2031
- 5.1. Market Analysis, Insights and Forecast - by Product Type
- 5.1.1. Active Measurement
- 5.1.2. Standard Measurement
- 5.2. Market Analysis, Insights and Forecast - by Application
- 5.2.1. Standard Supplements
- 5.2.2. Disease-based
- 5.3. Market Analysis, Insights and Forecast - by End User
- 5.3.1. Direct-to-Consumer
- 5.3.2. Wellness and Fitness Centers
- 5.3.3. Hospitals and Clinics
- 5.3.4. Research Institutions
- 5.4. Market Analysis, Insights and Forecast - by Region
- 5.4.1. North America
- 5.4.2. Europe
- 5.4.3. Asia Pacific
- 5.4.4. Middle East and Africa
- 5.4.5. South America
- 5.1. Market Analysis, Insights and Forecast - by Product Type
- 6. North America Personalized Nutrition Market Analysis, Insights and Forecast, 2019-2031
- 6.1. Market Analysis, Insights and Forecast - by Product Type
- 6.1.1. Active Measurement
- 6.1.2. Standard Measurement
- 6.2. Market Analysis, Insights and Forecast - by Application
- 6.2.1. Standard Supplements
- 6.2.2. Disease-based
- 6.3. Market Analysis, Insights and Forecast - by End User
- 6.3.1. Direct-to-Consumer
- 6.3.2. Wellness and Fitness Centers
- 6.3.3. Hospitals and Clinics
- 6.3.4. Research Institutions
- 6.1. Market Analysis, Insights and Forecast - by Product Type
- 7. Europe Personalized Nutrition Market Analysis, Insights and Forecast, 2019-2031
- 7.1. Market Analysis, Insights and Forecast - by Product Type
- 7.1.1. Active Measurement
- 7.1.2. Standard Measurement
- 7.2. Market Analysis, Insights and Forecast - by Application
- 7.2.1. Standard Supplements
- 7.2.2. Disease-based
- 7.3. Market Analysis, Insights and Forecast - by End User
- 7.3.1. Direct-to-Consumer
- 7.3.2. Wellness and Fitness Centers
- 7.3.3. Hospitals and Clinics
- 7.3.4. Research Institutions
- 7.1. Market Analysis, Insights and Forecast - by Product Type
- 8. Asia Pacific Personalized Nutrition Market Analysis, Insights and Forecast, 2019-2031
- 8.1. Market Analysis, Insights and Forecast - by Product Type
- 8.1.1. Active Measurement
- 8.1.2. Standard Measurement
- 8.2. Market Analysis, Insights and Forecast - by Application
- 8.2.1. Standard Supplements
- 8.2.2. Disease-based
- 8.3. Market Analysis, Insights and Forecast - by End User
- 8.3.1. Direct-to-Consumer
- 8.3.2. Wellness and Fitness Centers
- 8.3.3. Hospitals and Clinics
- 8.3.4. Research Institutions
- 8.1. Market Analysis, Insights and Forecast - by Product Type
- 9. Middle East and Africa Personalized Nutrition Market Analysis, Insights and Forecast, 2019-2031
- 9.1. Market Analysis, Insights and Forecast - by Product Type
- 9.1.1. Active Measurement
- 9.1.2. Standard Measurement
- 9.2. Market Analysis, Insights and Forecast - by Application
- 9.2.1. Standard Supplements
- 9.2.2. Disease-based
- 9.3. Market Analysis, Insights and Forecast - by End User
- 9.3.1. Direct-to-Consumer
- 9.3.2. Wellness and Fitness Centers
- 9.3.3. Hospitals and Clinics
- 9.3.4. Research Institutions
- 9.1. Market Analysis, Insights and Forecast - by Product Type
- 10. South America Personalized Nutrition Market Analysis, Insights and Forecast, 2019-2031
- 10.1. Market Analysis, Insights and Forecast - by Product Type
- 10.1.1. Active Measurement
- 10.1.2. Standard Measurement
- 10.2. Market Analysis, Insights and Forecast - by Application
- 10.2.1. Standard Supplements
- 10.2.2. Disease-based
- 10.3. Market Analysis, Insights and Forecast - by End User
- 10.3.1. Direct-to-Consumer
- 10.3.2. Wellness and Fitness Centers
- 10.3.3. Hospitals and Clinics
- 10.3.4. Research Institutions
- 10.1. Market Analysis, Insights and Forecast - by Product Type
- 11. Competitive Analysis
- 11.1. Global Market Share Analysis 2024
- 11.2. Company Profiles
- 11.2.1 Amway Corp
- 11.2.1.1. Overview
- 11.2.1.2. Products
- 11.2.1.3. SWOT Analysis
- 11.2.1.4. Recent Developments
- 11.2.1.5. Financials (Based on Availability)
- 11.2.2 Abbott
- 11.2.2.1. Overview
- 11.2.2.2. Products
- 11.2.2.3. SWOT Analysis
- 11.2.2.4. Recent Developments
- 11.2.2.5. Financials (Based on Availability)
- 11.2.3 Superior Supplement Manufacturing
- 11.2.3.1. Overview
- 11.2.3.2. Products
- 11.2.3.3. SWOT Analysis
- 11.2.3.4. Recent Developments
- 11.2.3.5. Financials (Based on Availability)
- 11.2.4 Herbalife International of America Inc
- 11.2.4.1. Overview
- 11.2.4.2. Products
- 11.2.4.3. SWOT Analysis
- 11.2.4.4. Recent Developments
- 11.2.4.5. Financials (Based on Availability)
- 11.2.5 Metagenics Inc
- 11.2.5.1. Overview
- 11.2.5.2. Products
- 11.2.5.3. SWOT Analysis
- 11.2.5.4. Recent Developments
- 11.2.5.5. Financials (Based on Availability)
- 11.2.6 GX Sciences LLC
- 11.2.6.1. Overview
- 11.2.6.2. Products
- 11.2.6.3. SWOT Analysis
- 11.2.6.4. Recent Developments
- 11.2.6.5. Financials (Based on Availability)
- 11.2.7 Nutralliance
- 11.2.7.1. Overview
- 11.2.7.2. Products
- 11.2.7.3. SWOT Analysis
- 11.2.7.4. Recent Developments
- 11.2.7.5. Financials (Based on Availability)
- 11.2.8 Divine Design Manufacturing
- 11.2.8.1. Overview
- 11.2.8.2. Products
- 11.2.8.3. SWOT Analysis
- 11.2.8.4. Recent Developments
- 11.2.8.5. Financials (Based on Availability)
- 11.2.9 Archer Daniels Midland Company (ADM)
- 11.2.9.1. Overview
- 11.2.9.2. Products
- 11.2.9.3. SWOT Analysis
- 11.2.9.4. Recent Developments
- 11.2.9.5. Financials (Based on Availability)
- 11.2.10 Viome Life Sciences Inc *List Not Exhaustive
- 11.2.10.1. Overview
- 11.2.10.2. Products
- 11.2.10.3. SWOT Analysis
- 11.2.10.4. Recent Developments
- 11.2.10.5. Financials (Based on Availability)
- 11.2.1 Amway Corp
List of Figures
- Figure 1: Global Personalized Nutrition Market Revenue Breakdown (Million, %) by Region 2024 & 2032
- Figure 2: Global Personalized Nutrition Market Volume Breakdown (Billion, %) by Region 2024 & 2032
- Figure 3: North America Personalized Nutrition Market Revenue (Million), by Product Type 2024 & 2032
- Figure 4: North America Personalized Nutrition Market Volume (Billion), by Product Type 2024 & 2032
- Figure 5: North America Personalized Nutrition Market Revenue Share (%), by Product Type 2024 & 2032
- Figure 6: North America Personalized Nutrition Market Volume Share (%), by Product Type 2024 & 2032
- Figure 7: North America Personalized Nutrition Market Revenue (Million), by Application 2024 & 2032
- Figure 8: North America Personalized Nutrition Market Volume (Billion), by Application 2024 & 2032
- Figure 9: North America Personalized Nutrition Market Revenue Share (%), by Application 2024 & 2032
- Figure 10: North America Personalized Nutrition Market Volume Share (%), by Application 2024 & 2032
- Figure 11: North America Personalized Nutrition Market Revenue (Million), by End User 2024 & 2032
- Figure 12: North America Personalized Nutrition Market Volume (Billion), by End User 2024 & 2032
- Figure 13: North America Personalized Nutrition Market Revenue Share (%), by End User 2024 & 2032
- Figure 14: North America Personalized Nutrition Market Volume Share (%), by End User 2024 & 2032
- Figure 15: North America Personalized Nutrition Market Revenue (Million), by Country 2024 & 2032
- Figure 16: North America Personalized Nutrition Market Volume (Billion), by Country 2024 & 2032
- Figure 17: North America Personalized Nutrition Market Revenue Share (%), by Country 2024 & 2032
- Figure 18: North America Personalized Nutrition Market Volume Share (%), by Country 2024 & 2032
- Figure 19: Europe Personalized Nutrition Market Revenue (Million), by Product Type 2024 & 2032
- Figure 20: Europe Personalized Nutrition Market Volume (Billion), by Product Type 2024 & 2032
- Figure 21: Europe Personalized Nutrition Market Revenue Share (%), by Product Type 2024 & 2032
- Figure 22: Europe Personalized Nutrition Market Volume Share (%), by Product Type 2024 & 2032
- Figure 23: Europe Personalized Nutrition Market Revenue (Million), by Application 2024 & 2032
- Figure 24: Europe Personalized Nutrition Market Volume (Billion), by Application 2024 & 2032
- Figure 25: Europe Personalized Nutrition Market Revenue Share (%), by Application 2024 & 2032
- Figure 26: Europe Personalized Nutrition Market Volume Share (%), by Application 2024 & 2032
- Figure 27: Europe Personalized Nutrition Market Revenue (Million), by End User 2024 & 2032
- Figure 28: Europe Personalized Nutrition Market Volume (Billion), by End User 2024 & 2032
- Figure 29: Europe Personalized Nutrition Market Revenue Share (%), by End User 2024 & 2032
- Figure 30: Europe Personalized Nutrition Market Volume Share (%), by End User 2024 & 2032
- Figure 31: Europe Personalized Nutrition Market Revenue (Million), by Country 2024 & 2032
- Figure 32: Europe Personalized Nutrition Market Volume (Billion), by Country 2024 & 2032
- Figure 33: Europe Personalized Nutrition Market Revenue Share (%), by Country 2024 & 2032
- Figure 34: Europe Personalized Nutrition Market Volume Share (%), by Country 2024 & 2032
- Figure 35: Asia Pacific Personalized Nutrition Market Revenue (Million), by Product Type 2024 & 2032
- Figure 36: Asia Pacific Personalized Nutrition Market Volume (Billion), by Product Type 2024 & 2032
- Figure 37: Asia Pacific Personalized Nutrition Market Revenue Share (%), by Product Type 2024 & 2032
- Figure 38: Asia Pacific Personalized Nutrition Market Volume Share (%), by Product Type 2024 & 2032
- Figure 39: Asia Pacific Personalized Nutrition Market Revenue (Million), by Application 2024 & 2032
- Figure 40: Asia Pacific Personalized Nutrition Market Volume (Billion), by Application 2024 & 2032
- Figure 41: Asia Pacific Personalized Nutrition Market Revenue Share (%), by Application 2024 & 2032
- Figure 42: Asia Pacific Personalized Nutrition Market Volume Share (%), by Application 2024 & 2032
- Figure 43: Asia Pacific Personalized Nutrition Market Revenue (Million), by End User 2024 & 2032
- Figure 44: Asia Pacific Personalized Nutrition Market Volume (Billion), by End User 2024 & 2032
- Figure 45: Asia Pacific Personalized Nutrition Market Revenue Share (%), by End User 2024 & 2032
- Figure 46: Asia Pacific Personalized Nutrition Market Volume Share (%), by End User 2024 & 2032
- Figure 47: Asia Pacific Personalized Nutrition Market Revenue (Million), by Country 2024 & 2032
- Figure 48: Asia Pacific Personalized Nutrition Market Volume (Billion), by Country 2024 & 2032
- Figure 49: Asia Pacific Personalized Nutrition Market Revenue Share (%), by Country 2024 & 2032
- Figure 50: Asia Pacific Personalized Nutrition Market Volume Share (%), by Country 2024 & 2032
- Figure 51: Middle East and Africa Personalized Nutrition Market Revenue (Million), by Product Type 2024 & 2032
- Figure 52: Middle East and Africa Personalized Nutrition Market Volume (Billion), by Product Type 2024 & 2032
- Figure 53: Middle East and Africa Personalized Nutrition Market Revenue Share (%), by Product Type 2024 & 2032
- Figure 54: Middle East and Africa Personalized Nutrition Market Volume Share (%), by Product Type 2024 & 2032
- Figure 55: Middle East and Africa Personalized Nutrition Market Revenue (Million), by Application 2024 & 2032
- Figure 56: Middle East and Africa Personalized Nutrition Market Volume (Billion), by Application 2024 & 2032
- Figure 57: Middle East and Africa Personalized Nutrition Market Revenue Share (%), by Application 2024 & 2032
- Figure 58: Middle East and Africa Personalized Nutrition Market Volume Share (%), by Application 2024 & 2032
- Figure 59: Middle East and Africa Personalized Nutrition Market Revenue (Million), by End User 2024 & 2032
- Figure 60: Middle East and Africa Personalized Nutrition Market Volume (Billion), by End User 2024 & 2032
- Figure 61: Middle East and Africa Personalized Nutrition Market Revenue Share (%), by End User 2024 & 2032
- Figure 62: Middle East and Africa Personalized Nutrition Market Volume Share (%), by End User 2024 & 2032
- Figure 63: Middle East and Africa Personalized Nutrition Market Revenue (Million), by Country 2024 & 2032
- Figure 64: Middle East and Africa Personalized Nutrition Market Volume (Billion), by Country 2024 & 2032
- Figure 65: Middle East and Africa Personalized Nutrition Market Revenue Share (%), by Country 2024 & 2032
- Figure 66: Middle East and Africa Personalized Nutrition Market Volume Share (%), by Country 2024 & 2032
- Figure 67: South America Personalized Nutrition Market Revenue (Million), by Product Type 2024 & 2032
- Figure 68: South America Personalized Nutrition Market Volume (Billion), by Product Type 2024 & 2032
- Figure 69: South America Personalized Nutrition Market Revenue Share (%), by Product Type 2024 & 2032
- Figure 70: South America Personalized Nutrition Market Volume Share (%), by Product Type 2024 & 2032
- Figure 71: South America Personalized Nutrition Market Revenue (Million), by Application 2024 & 2032
- Figure 72: South America Personalized Nutrition Market Volume (Billion), by Application 2024 & 2032
- Figure 73: South America Personalized Nutrition Market Revenue Share (%), by Application 2024 & 2032
- Figure 74: South America Personalized Nutrition Market Volume Share (%), by Application 2024 & 2032
- Figure 75: South America Personalized Nutrition Market Revenue (Million), by End User 2024 & 2032
- Figure 76: South America Personalized Nutrition Market Volume (Billion), by End User 2024 & 2032
- Figure 77: South America Personalized Nutrition Market Revenue Share (%), by End User 2024 & 2032
- Figure 78: South America Personalized Nutrition Market Volume Share (%), by End User 2024 & 2032
- Figure 79: South America Personalized Nutrition Market Revenue (Million), by Country 2024 & 2032
- Figure 80: South America Personalized Nutrition Market Volume (Billion), by Country 2024 & 2032
- Figure 81: South America Personalized Nutrition Market Revenue Share (%), by Country 2024 & 2032
- Figure 82: South America Personalized Nutrition Market Volume Share (%), by Country 2024 & 2032
List of Tables
- Table 1: Global Personalized Nutrition Market Revenue Million Forecast, by Region 2019 & 2032
- Table 2: Global Personalized Nutrition Market Volume Billion Forecast, by Region 2019 & 2032
- Table 3: Global Personalized Nutrition Market Revenue Million Forecast, by Product Type 2019 & 2032
- Table 4: Global Personalized Nutrition Market Volume Billion Forecast, by Product Type 2019 & 2032
- Table 5: Global Personalized Nutrition Market Revenue Million Forecast, by Application 2019 & 2032
- Table 6: Global Personalized Nutrition Market Volume Billion Forecast, by Application 2019 & 2032
- Table 7: Global Personalized Nutrition Market Revenue Million Forecast, by End User 2019 & 2032
- Table 8: Global Personalized Nutrition Market Volume Billion Forecast, by End User 2019 & 2032
- Table 9: Global Personalized Nutrition Market Revenue Million Forecast, by Region 2019 & 2032
- Table 10: Global Personalized Nutrition Market Volume Billion Forecast, by Region 2019 & 2032
- Table 11: Global Personalized Nutrition Market Revenue Million Forecast, by Product Type 2019 & 2032
- Table 12: Global Personalized Nutrition Market Volume Billion Forecast, by Product Type 2019 & 2032
- Table 13: Global Personalized Nutrition Market Revenue Million Forecast, by Application 2019 & 2032
- Table 14: Global Personalized Nutrition Market Volume Billion Forecast, by Application 2019 & 2032
- Table 15: Global Personalized Nutrition Market Revenue Million Forecast, by End User 2019 & 2032
- Table 16: Global Personalized Nutrition Market Volume Billion Forecast, by End User 2019 & 2032
- Table 17: Global Personalized Nutrition Market Revenue Million Forecast, by Country 2019 & 2032
- Table 18: Global Personalized Nutrition Market Volume Billion Forecast, by Country 2019 & 2032
- Table 19: United States Personalized Nutrition Market Revenue (Million) Forecast, by Application 2019 & 2032
- Table 20: United States Personalized Nutrition Market Volume (Billion) Forecast, by Application 2019 & 2032
- Table 21: Canada Personalized Nutrition Market Revenue (Million) Forecast, by Application 2019 & 2032
- Table 22: Canada Personalized Nutrition Market Volume (Billion) Forecast, by Application 2019 & 2032
- Table 23: Mexico Personalized Nutrition Market Revenue (Million) Forecast, by Application 2019 & 2032
- Table 24: Mexico Personalized Nutrition Market Volume (Billion) Forecast, by Application 2019 & 2032
- Table 25: Global Personalized Nutrition Market Revenue Million Forecast, by Product Type 2019 & 2032
- Table 26: Global Personalized Nutrition Market Volume Billion Forecast, by Product Type 2019 & 2032
- Table 27: Global Personalized Nutrition Market Revenue Million Forecast, by Application 2019 & 2032
- Table 28: Global Personalized Nutrition Market Volume Billion Forecast, by Application 2019 & 2032
- Table 29: Global Personalized Nutrition Market Revenue Million Forecast, by End User 2019 & 2032
- Table 30: Global Personalized Nutrition Market Volume Billion Forecast, by End User 2019 & 2032
- Table 31: Global Personalized Nutrition Market Revenue Million Forecast, by Country 2019 & 2032
- Table 32: Global Personalized Nutrition Market Volume Billion Forecast, by Country 2019 & 2032
- Table 33: Germany Personalized Nutrition Market Revenue (Million) Forecast, by Application 2019 & 2032
- Table 34: Germany Personalized Nutrition Market Volume (Billion) Forecast, by Application 2019 & 2032
- Table 35: United Kingdom Personalized Nutrition Market Revenue (Million) Forecast, by Application 2019 & 2032
- Table 36: United Kingdom Personalized Nutrition Market Volume (Billion) Forecast, by Application 2019 & 2032
- Table 37: France Personalized Nutrition Market Revenue (Million) Forecast, by Application 2019 & 2032
- Table 38: France Personalized Nutrition Market Volume (Billion) Forecast, by Application 2019 & 2032
- Table 39: Italy Personalized Nutrition Market Revenue (Million) Forecast, by Application 2019 & 2032
- Table 40: Italy Personalized Nutrition Market Volume (Billion) Forecast, by Application 2019 & 2032
- Table 41: Spain Personalized Nutrition Market Revenue (Million) Forecast, by Application 2019 & 2032
- Table 42: Spain Personalized Nutrition Market Volume (Billion) Forecast, by Application 2019 & 2032
- Table 43: Rest of Europe Personalized Nutrition Market Revenue (Million) Forecast, by Application 2019 & 2032
- Table 44: Rest of Europe Personalized Nutrition Market Volume (Billion) Forecast, by Application 2019 & 2032
- Table 45: Global Personalized Nutrition Market Revenue Million Forecast, by Product Type 2019 & 2032
- Table 46: Global Personalized Nutrition Market Volume Billion Forecast, by Product Type 2019 & 2032
- Table 47: Global Personalized Nutrition Market Revenue Million Forecast, by Application 2019 & 2032
- Table 48: Global Personalized Nutrition Market Volume Billion Forecast, by Application 2019 & 2032
- Table 49: Global Personalized Nutrition Market Revenue Million Forecast, by End User 2019 & 2032
- Table 50: Global Personalized Nutrition Market Volume Billion Forecast, by End User 2019 & 2032
- Table 51: Global Personalized Nutrition Market Revenue Million Forecast, by Country 2019 & 2032
- Table 52: Global Personalized Nutrition Market Volume Billion Forecast, by Country 2019 & 2032
- Table 53: China Personalized Nutrition Market Revenue (Million) Forecast, by Application 2019 & 2032
- Table 54: China Personalized Nutrition Market Volume (Billion) Forecast, by Application 2019 & 2032
- Table 55: Japan Personalized Nutrition Market Revenue (Million) Forecast, by Application 2019 & 2032
- Table 56: Japan Personalized Nutrition Market Volume (Billion) Forecast, by Application 2019 & 2032
- Table 57: India Personalized Nutrition Market Revenue (Million) Forecast, by Application 2019 & 2032
- Table 58: India Personalized Nutrition Market Volume (Billion) Forecast, by Application 2019 & 2032
- Table 59: Australia Personalized Nutrition Market Revenue (Million) Forecast, by Application 2019 & 2032
- Table 60: Australia Personalized Nutrition Market Volume (Billion) Forecast, by Application 2019 & 2032
- Table 61: South Korea Personalized Nutrition Market Revenue (Million) Forecast, by Application 2019 & 2032
- Table 62: South Korea Personalized Nutrition Market Volume (Billion) Forecast, by Application 2019 & 2032
- Table 63: Rest of Asia Pacific Personalized Nutrition Market Revenue (Million) Forecast, by Application 2019 & 2032
- Table 64: Rest of Asia Pacific Personalized Nutrition Market Volume (Billion) Forecast, by Application 2019 & 2032
- Table 65: Global Personalized Nutrition Market Revenue Million Forecast, by Product Type 2019 & 2032
- Table 66: Global Personalized Nutrition Market Volume Billion Forecast, by Product Type 2019 & 2032
- Table 67: Global Personalized Nutrition Market Revenue Million Forecast, by Application 2019 & 2032
- Table 68: Global Personalized Nutrition Market Volume Billion Forecast, by Application 2019 & 2032
- Table 69: Global Personalized Nutrition Market Revenue Million Forecast, by End User 2019 & 2032
- Table 70: Global Personalized Nutrition Market Volume Billion Forecast, by End User 2019 & 2032
- Table 71: Global Personalized Nutrition Market Revenue Million Forecast, by Country 2019 & 2032
- Table 72: Global Personalized Nutrition Market Volume Billion Forecast, by Country 2019 & 2032
- Table 73: GCC Personalized Nutrition Market Revenue (Million) Forecast, by Application 2019 & 2032
- Table 74: GCC Personalized Nutrition Market Volume (Billion) Forecast, by Application 2019 & 2032
- Table 75: South Africa Personalized Nutrition Market Revenue (Million) Forecast, by Application 2019 & 2032
- Table 76: South Africa Personalized Nutrition Market Volume (Billion) Forecast, by Application 2019 & 2032
- Table 77: Rest of Middle East and Africa Personalized Nutrition Market Revenue (Million) Forecast, by Application 2019 & 2032
- Table 78: Rest of Middle East and Africa Personalized Nutrition Market Volume (Billion) Forecast, by Application 2019 & 2032
- Table 79: Global Personalized Nutrition Market Revenue Million Forecast, by Product Type 2019 & 2032
- Table 80: Global Personalized Nutrition Market Volume Billion Forecast, by Product Type 2019 & 2032
- Table 81: Global Personalized Nutrition Market Revenue Million Forecast, by Application 2019 & 2032
- Table 82: Global Personalized Nutrition Market Volume Billion Forecast, by Application 2019 & 2032
- Table 83: Global Personalized Nutrition Market Revenue Million Forecast, by End User 2019 & 2032
- Table 84: Global Personalized Nutrition Market Volume Billion Forecast, by End User 2019 & 2032
- Table 85: Global Personalized Nutrition Market Revenue Million Forecast, by Country 2019 & 2032
- Table 86: Global Personalized Nutrition Market Volume Billion Forecast, by Country 2019 & 2032
- Table 87: Brazil Personalized Nutrition Market Revenue (Million) Forecast, by Application 2019 & 2032
- Table 88: Brazil Personalized Nutrition Market Volume (Billion) Forecast, by Application 2019 & 2032
- Table 89: Argentina Personalized Nutrition Market Revenue (Million) Forecast, by Application 2019 & 2032
- Table 90: Argentina Personalized Nutrition Market Volume (Billion) Forecast, by Application 2019 & 2032
- Table 91: Rest of South America Personalized Nutrition Market Revenue (Million) Forecast, by Application 2019 & 2032
- Table 92: Rest of South America Personalized Nutrition Market Volume (Billion) Forecast, by Application 2019 & 2032
Frequently Asked Questions
1. What is the projected Compound Annual Growth Rate (CAGR) of the Personalized Nutrition Market?
The projected CAGR is approximately 14.34%.
2. Which companies are prominent players in the Personalized Nutrition Market?
Key companies in the market include Amway Corp, Abbott, Superior Supplement Manufacturing, Herbalife International of America Inc, Metagenics Inc, GX Sciences LLC, Nutralliance, Divine Design Manufacturing, Archer Daniels Midland Company (ADM), Viome Life Sciences Inc *List Not Exhaustive.
3. What are the main segments of the Personalized Nutrition Market?
The market segments include Product Type, Application, End User.
4. Can you provide details about the market size?
The market size is estimated to be USD 14.27 Million as of 2022.
5. What are some drivers contributing to market growth?
Shift in Consumer Preference Due to a Rise in Health Awareness; Increasing Burden of Chronic Diseases and Geriatric Population; Technological Advancements and Growing Trend of Digital Healthcare.
6. What are the notable trends driving market growth?
Disease-based Segment Expected to Hold a Significant Share Over the Forecast Period.
7. Are there any restraints impacting market growth?
Shift in Consumer Preference Due to a Rise in Health Awareness; Increasing Burden of Chronic Diseases and Geriatric Population; Technological Advancements and Growing Trend of Digital Healthcare.
8. Can you provide examples of recent developments in the market?
September 2024: Bioniq announced its partnership with healthcare reimbursement and HSA/FSA spending solution Truemed. This partnership signifies that Bioniq’s unique pharmaceutical-grade nutritional supplements can be medically necessary, allowing for HSA and FSA to spend on the preventative healthcare routine.February 2024: Riise, a Berlin-based supplement startup, introduced its personalized microgranule nutrient blends, catering to individual nutritional needs and health objectives, thus eliminating the necessity for multiple pills and capsules.
9. What pricing options are available for accessing the report?
Pricing options include single-user, multi-user, and enterprise licenses priced at USD 4750, USD 5250, and USD 8750 respectively.
10. Is the market size provided in terms of value or volume?
The market size is provided in terms of value, measured in Million and volume, measured in Billion.
11. Are there any specific market keywords associated with the report?
Yes, the market keyword associated with the report is "Personalized Nutrition Market," which aids in identifying and referencing the specific market segment covered.
12. How do I determine which pricing option suits my needs best?
The pricing options vary based on user requirements and access needs. Individual users may opt for single-user licenses, while businesses requiring broader access may choose multi-user or enterprise licenses for cost-effective access to the report.
13. Are there any additional resources or data provided in the Personalized Nutrition Market report?
While the report offers comprehensive insights, it's advisable to review the specific contents or supplementary materials provided to ascertain if additional resources or data are available.
14. How can I stay updated on further developments or reports in the Personalized Nutrition Market?
To stay informed about further developments, trends, and reports in the Personalized Nutrition Market, consider subscribing to industry newsletters, following relevant companies and organizations, or regularly checking reputable industry news sources and publications.
Methodology
Step 1 - Identification of Relevant Samples Size from Population Database


Step 2 - Approaches for Defining Global Market Size (Value, Volume* & Price*)

Note*: In applicable scenarios
Step 3 - Data Sources
Primary Research
- Web Analytics
- Survey Reports
- Research Institute
- Latest Research Reports
- Opinion Leaders
Secondary Research
- Annual Reports
- White Paper
- Latest Press Release
- Industry Association
- Paid Database
- Investor Presentations

Step 4 - Data Triangulation
Involves using different sources of information in order to increase the validity of a study
These sources are likely to be stakeholders in a program - participants, other researchers, program staff, other community members, and so on.
Then we put all data in single framework & apply various statistical tools to find out the dynamic on the market.
During the analysis stage, feedback from the stakeholder groups would be compared to determine areas of agreement as well as areas of divergence
