

Key Insights
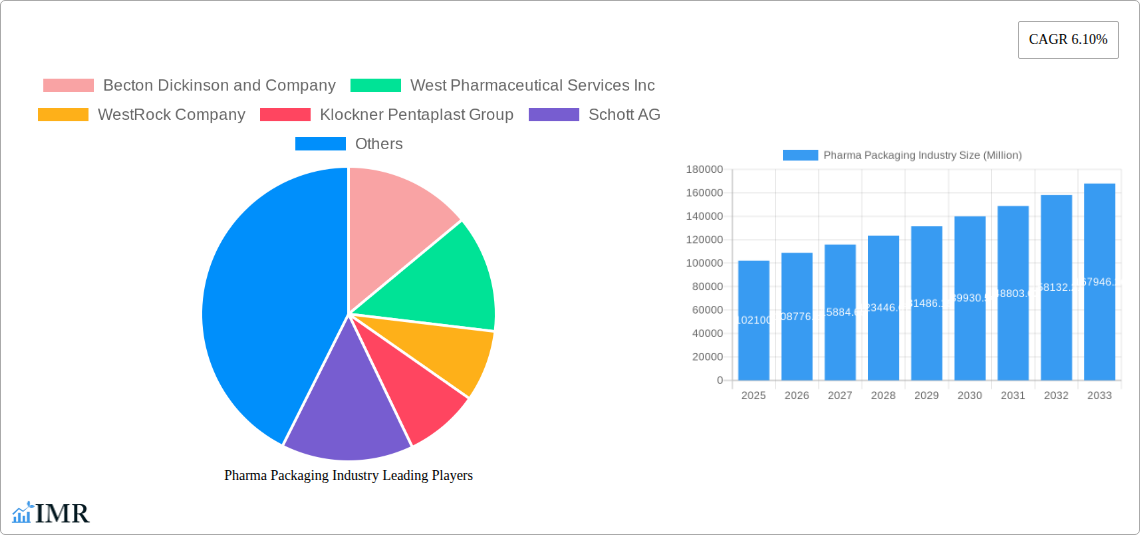
The pharmaceutical packaging market, valued at $102.10 billion in 2025, is projected to experience robust growth, driven by several key factors. The increasing demand for pharmaceutical products globally, coupled with stringent regulatory requirements for drug safety and efficacy, fuels the need for sophisticated and reliable packaging solutions. Advancements in packaging technologies, such as the incorporation of tamper-evident features, improved barrier properties to protect drug integrity, and the use of sustainable materials like biodegradable plastics, are further propelling market expansion. The rising prevalence of chronic diseases and the growing geriatric population contribute to increased drug consumption, creating a significant demand for packaging across various dosage forms, including bottles, syringes, vials, ampoules, and tubes. Furthermore, the pharmaceutical industry's continuous focus on supply chain optimization and efficient drug delivery systems is driving the adoption of innovative packaging solutions, such as smart packaging with integrated sensors for real-time monitoring and track-and-trace capabilities. This segment is witnessing a significant shift towards customized packaging solutions designed to meet specific drug characteristics and patient needs.
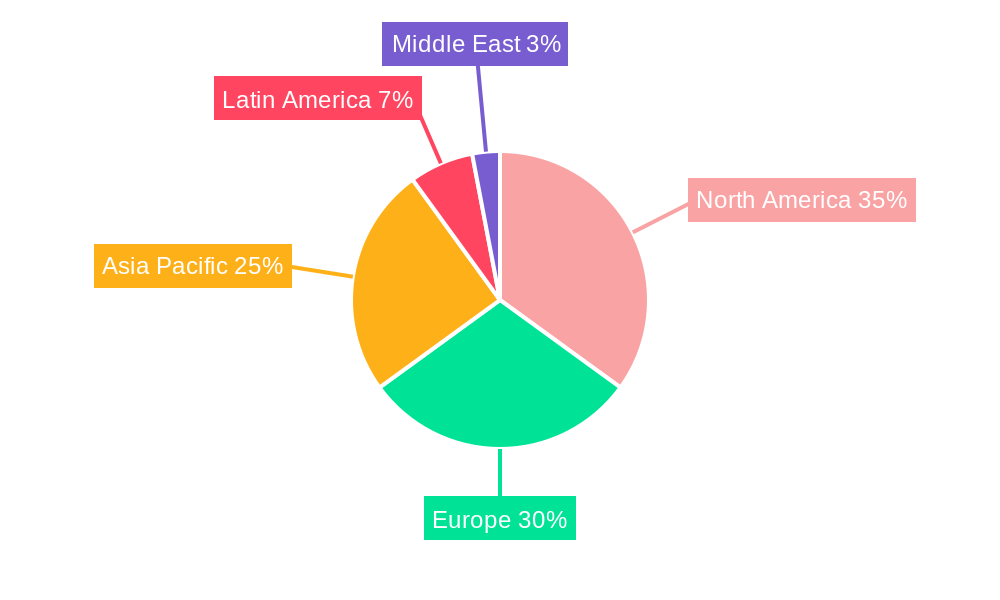
Market segmentation reveals a diverse landscape. Plastics dominate the material segment due to their cost-effectiveness, versatility, and ease of processing. However, growing environmental concerns are driving increasing adoption of alternative materials, including glass and sustainable polymers. The product type segment is dominated by bottles and syringes, driven by their widespread use in various drug formulations. However, other product types, such as vials, ampoules, tubes, caps and closures, and labels are also experiencing significant growth, driven by specific drug delivery requirements and enhanced drug protection. Geographically, North America and Europe currently hold the largest market share, driven by established pharmaceutical industries and robust regulatory frameworks. However, Asia-Pacific is expected to witness the fastest growth rate due to rapid economic expansion, increasing healthcare spending, and rising demand for pharmaceuticals in emerging markets. Competitive landscape analysis shows that the market is characterized by both large multinational corporations and smaller specialized packaging companies, each offering a unique portfolio of products and services. The projected CAGR of 6.10% indicates continued substantial growth through 2033, reflecting the industry's dynamic nature and the crucial role of packaging in ensuring drug quality and patient safety.
Pharma Packaging Industry Market Report: 2019-2033
This comprehensive report provides a detailed analysis of the global Pharma Packaging market, encompassing market size, growth trends, competitive landscape, and future outlook. The study period covers 2019-2033, with a base year of 2025 and a forecast period of 2025-2033. The report segments the market by material (Plastics, Glass, Other Materials) and product type (Bottles, Syringes, Vials and Ampoules, Tubes, Caps and Closures, Labels, Other Product Types), offering granular insights into key industry dynamics. Key players such as Becton Dickinson and Company, West Pharmaceutical Services Inc, WestRock Company, and others are analyzed, providing a complete view of this vital sector. This report is essential for pharmaceutical companies, packaging manufacturers, investors, and industry professionals seeking to understand and capitalize on the opportunities within the pharma packaging market.
Estimated Market Value (Million Units): xx
Study Period: 2019-2033 Base Year: 2025 Estimated Year: 2025 Forecast Period: 2025-2033 Historical Period: 2019-2024
Pharma Packaging Industry Market Dynamics & Structure
The pharma packaging market is characterized by moderate concentration, with several large players dominating alongside numerous smaller niche players. Technological innovation, driven by advancements in materials science and automation, is a key growth driver. Stringent regulatory frameworks, including GMP and other international standards, significantly impact market dynamics. Competitive substitutes, such as alternative packaging materials, continually challenge the status quo. End-user demographics, influenced by the aging population and increasing prevalence of chronic diseases, fuel demand. M&A activity remains significant, with large players seeking to expand their market share and product portfolios through acquisitions.
- Market Concentration: Moderately concentrated, with top 5 players holding approximately xx% market share in 2024.
- Technological Innovation: Focus on sustainable materials, barrier technologies, and advanced automation.
- Regulatory Landscape: Stringent regulations driving demand for compliant and traceable packaging solutions.
- Competitive Substitutes: Biodegradable plastics and alternative materials pose challenges.
- End-User Demographics: Aging populations and increasing chronic disease prevalence drive demand.
- M&A Activity: High level of mergers and acquisitions, consolidating market share. xx M&A deals recorded between 2019-2024.
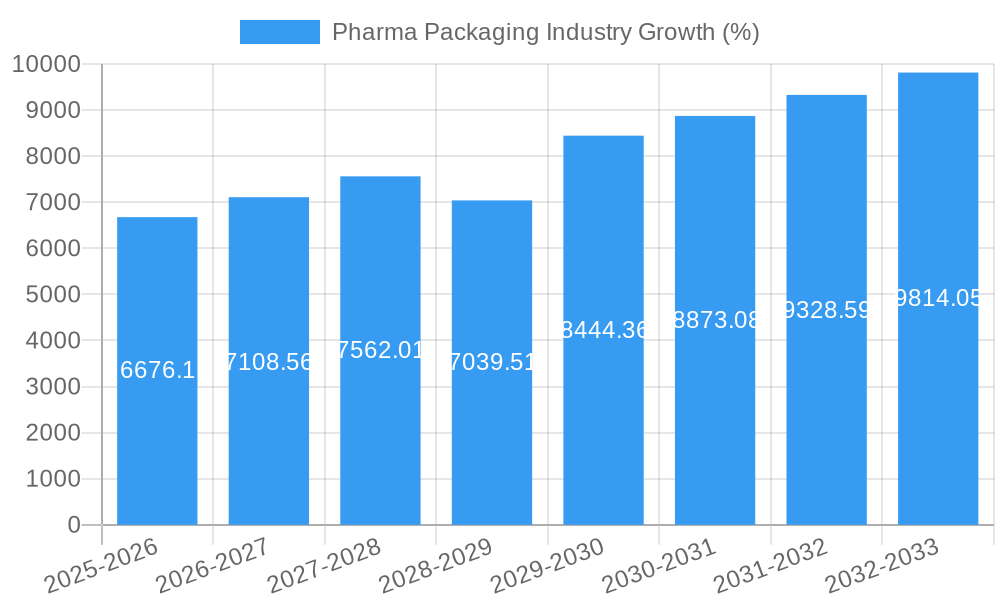
Pharma Packaging Industry Growth Trends & Insights
The global pharma packaging market exhibited a CAGR of xx% during 2019-2024, driven by factors such as the rising demand for pharmaceuticals, increasing focus on drug safety and efficacy, and advancements in packaging technologies. The market is expected to continue its growth trajectory, reaching xx million units by 2033, with a projected CAGR of xx% during 2025-2033. This growth is fueled by technological advancements such as the adoption of smart packaging and the increasing demand for sustainable packaging solutions. Consumer behavior is also shifting towards preference for convenience and tamper-evident packaging. Market penetration of innovative packaging solutions, like active and intelligent packaging is steadily increasing.
Dominant Regions, Countries, or Segments in Pharma Packaging Industry
North America and Europe currently dominate the pharma packaging market, driven by robust pharmaceutical industries and high healthcare expenditure. However, Asia-Pacific is witnessing significant growth, propelled by rapid economic development and expanding healthcare infrastructure.
By Material: Plastics segment holds the largest market share due to cost-effectiveness and versatility. Glass maintains significant presence due to its inert nature for sensitive drugs.
- North America: High adoption rates of advanced packaging solutions and stringent regulatory standards.
- Europe: Established pharmaceutical industry and strong focus on sustainable packaging.
- Asia-Pacific: Rapid growth fueled by economic development and increasing healthcare spending.
By Product Type: Bottles, syringes, vials and ampoules constitute a significant portion of the market driven by high demand for injectable drugs.
- Bottles: Large market share due to versatility across drug formulations.
- Syringes: Significant demand driven by increased use of injectables.
- Vials and Ampoules: High demand for sensitive and sterile pharmaceutical products.
- Caps and Closures: Essential components providing tamper-evidence and sterility.
Pharma Packaging Industry Product Landscape
The pharma packaging landscape is marked by continuous innovation, with a focus on enhancing product safety, efficacy, and convenience. This includes the development of advanced barrier materials, tamper-evident closures, and sustainable packaging solutions. Smart packaging incorporating RFID technology and other sensors is gaining traction, offering enhanced traceability and anti-counterfeiting measures. Unique selling propositions often center on superior barrier properties, enhanced convenience features, and sustainable material choices.
Key Drivers, Barriers & Challenges in Pharma Packaging Industry
Key Drivers: Increasing demand for pharmaceuticals, stringent regulatory requirements, technological advancements, and growing focus on patient safety are propelling market growth.
Challenges: Fluctuating raw material prices, stringent regulatory compliance, and competition from substitute materials pose significant challenges. Supply chain disruptions have resulted in xx% increase in lead times for some packaging materials in 2022.
Emerging Opportunities in Pharma Packaging Industry
Emerging opportunities lie in the development of sustainable packaging solutions, smart packaging technologies, and personalized medicine packaging. Untapped markets in developing economies offer significant growth potential. The focus on drug delivery systems and customized packaging designs presents innovative opportunities.
Growth Accelerators in the Pharma Packaging Industry
Technological advancements in materials science and automation are key growth catalysts. Strategic partnerships between packaging manufacturers and pharmaceutical companies are driving innovation. Expansion into emerging markets and increasing focus on sustainable packaging are significant drivers.
Key Players Shaping the Pharma Packaging Industry Market
- Becton Dickinson and Company
- West Pharmaceutical Services Inc
- WestRock Company
- Klockner Pentaplast Group
- Schott AG
- Nipro Corporation
- W L Gore & Associates Inc
- AptarGroup Inc
- Berry Global Group Inc
- 3M Company
- Vetter Pharma International GmbH
- Amcor PLC
- CCL Industries Inc
- FlexiTuff International Ltd
- Catalent Inc
- McKesson Corporation
- Gerresheimer AG
Notable Milestones in Pharma Packaging Industry Sector
- January 2023: Amcor acquired Shanghai-based MDK, a medical device packaging leader with USD 50 million in annual sales, strengthening Amcor's Asia-Pacific healthcare platform.
- June 2022: Catalent installed a high-speed blister packaging line in Japan, enhancing its clinical supply services and global customer access.
In-Depth Pharma Packaging Industry Market Outlook
The pharma packaging market is poised for continued growth, driven by technological innovation and expanding healthcare needs. Strategic partnerships, sustainable solutions, and penetration into emerging markets will shape future market dynamics. Opportunities abound for companies that can provide innovative, cost-effective, and sustainable packaging solutions to meet the evolving demands of the pharmaceutical industry.
Pharma Packaging Industry Segmentation
-
1. Material
- 1.1. Plastics
- 1.2. Glass
- 1.3. Other Materials
-
2. Product Type
- 2.1. Bottles
- 2.2. Syringes
- 2.3. Vials and Ampoules
- 2.4. Tubes
- 2.5. Caps and Closures
- 2.6. Labels
- 2.7. Other Product Types
Pharma Packaging Industry Segmentation By Geography
-
1. North America
- 1.1. United States
- 1.2. Canada
-
2. Europe
- 2.1. Germany
- 2.2. United Kingdom
- 2.3. France
- 2.4. Italy
- 2.5. Spain
- 2.6. Rest of Europe
-
3. Asia Pacific
- 3.1. China
- 3.2. Japan
- 3.3. India
- 3.4. South Korea
- 3.5. Rest of Asia Pacific
-
4. Latin America
- 4.1. Brazil
- 4.2. Mexico
- 4.3. Rest of Latin America
-
5. Middle East and Africa
- 5.1. United Arab Emirates
- 5.2. Saudi Arabia
- 5.3. South Africa
- 5.4. Rest of Middle East and Africa
Pharma Packaging Industry REPORT HIGHLIGHTS
| Aspects | Details |
|---|---|
| Study Period | 2019-2033 |
| Base Year | 2024 |
| Estimated Year | 2025 |
| Forecast Period | 2025-2033 |
| Historical Period | 2019-2024 |
| Growth Rate | CAGR of 6.10% from 2019-2033 |
| Segmentation |
|
Table of Contents
- 1. Introduction
- 1.1. Research Scope
- 1.2. Market Segmentation
- 1.3. Research Methodology
- 1.4. Definitions and Assumptions
- 2. Executive Summary
- 2.1. Introduction
- 3. Market Dynamics
- 3.1. Introduction
- 3.2. Market Drivers
- 3.2.1. Regulatory Standards on Packaging and Stringent Norms against Counterfeit Products; Impact of Nanotechnology due to Innovative and New- generation Packaging Solutions
- 3.3. Market Restrains
- 3.3.1. Stringent Government Regulations in Developed Countries
- 3.4. Market Trends
- 3.4.1. Plastic Packaging Holds a Significant Market Share
- 4. Market Factor Analysis
- 4.1. Porters Five Forces
- 4.2. Supply/Value Chain
- 4.3. PESTEL analysis
- 4.4. Market Entropy
- 4.5. Patent/Trademark Analysis
- 5. Global Pharma Packaging Industry Analysis, Insights and Forecast, 2019-2031
- 5.1. Market Analysis, Insights and Forecast - by Material
- 5.1.1. Plastics
- 5.1.2. Glass
- 5.1.3. Other Materials
- 5.2. Market Analysis, Insights and Forecast - by Product Type
- 5.2.1. Bottles
- 5.2.2. Syringes
- 5.2.3. Vials and Ampoules
- 5.2.4. Tubes
- 5.2.5. Caps and Closures
- 5.2.6. Labels
- 5.2.7. Other Product Types
- 5.3. Market Analysis, Insights and Forecast - by Region
- 5.3.1. North America
- 5.3.2. Europe
- 5.3.3. Asia Pacific
- 5.3.4. Latin America
- 5.3.5. Middle East and Africa
- 5.1. Market Analysis, Insights and Forecast - by Material
- 6. North America Pharma Packaging Industry Analysis, Insights and Forecast, 2019-2031
- 6.1. Market Analysis, Insights and Forecast - by Material
- 6.1.1. Plastics
- 6.1.2. Glass
- 6.1.3. Other Materials
- 6.2. Market Analysis, Insights and Forecast - by Product Type
- 6.2.1. Bottles
- 6.2.2. Syringes
- 6.2.3. Vials and Ampoules
- 6.2.4. Tubes
- 6.2.5. Caps and Closures
- 6.2.6. Labels
- 6.2.7. Other Product Types
- 6.1. Market Analysis, Insights and Forecast - by Material
- 7. Europe Pharma Packaging Industry Analysis, Insights and Forecast, 2019-2031
- 7.1. Market Analysis, Insights and Forecast - by Material
- 7.1.1. Plastics
- 7.1.2. Glass
- 7.1.3. Other Materials
- 7.2. Market Analysis, Insights and Forecast - by Product Type
- 7.2.1. Bottles
- 7.2.2. Syringes
- 7.2.3. Vials and Ampoules
- 7.2.4. Tubes
- 7.2.5. Caps and Closures
- 7.2.6. Labels
- 7.2.7. Other Product Types
- 7.1. Market Analysis, Insights and Forecast - by Material
- 8. Asia Pacific Pharma Packaging Industry Analysis, Insights and Forecast, 2019-2031
- 8.1. Market Analysis, Insights and Forecast - by Material
- 8.1.1. Plastics
- 8.1.2. Glass
- 8.1.3. Other Materials
- 8.2. Market Analysis, Insights and Forecast - by Product Type
- 8.2.1. Bottles
- 8.2.2. Syringes
- 8.2.3. Vials and Ampoules
- 8.2.4. Tubes
- 8.2.5. Caps and Closures
- 8.2.6. Labels
- 8.2.7. Other Product Types
- 8.1. Market Analysis, Insights and Forecast - by Material
- 9. Latin America Pharma Packaging Industry Analysis, Insights and Forecast, 2019-2031
- 9.1. Market Analysis, Insights and Forecast - by Material
- 9.1.1. Plastics
- 9.1.2. Glass
- 9.1.3. Other Materials
- 9.2. Market Analysis, Insights and Forecast - by Product Type
- 9.2.1. Bottles
- 9.2.2. Syringes
- 9.2.3. Vials and Ampoules
- 9.2.4. Tubes
- 9.2.5. Caps and Closures
- 9.2.6. Labels
- 9.2.7. Other Product Types
- 9.1. Market Analysis, Insights and Forecast - by Material
- 10. Middle East and Africa Pharma Packaging Industry Analysis, Insights and Forecast, 2019-2031
- 10.1. Market Analysis, Insights and Forecast - by Material
- 10.1.1. Plastics
- 10.1.2. Glass
- 10.1.3. Other Materials
- 10.2. Market Analysis, Insights and Forecast - by Product Type
- 10.2.1. Bottles
- 10.2.2. Syringes
- 10.2.3. Vials and Ampoules
- 10.2.4. Tubes
- 10.2.5. Caps and Closures
- 10.2.6. Labels
- 10.2.7. Other Product Types
- 10.1. Market Analysis, Insights and Forecast - by Material
- 11. North America Pharma Packaging Industry Analysis, Insights and Forecast, 2019-2031
- 11.1. Market Analysis, Insights and Forecast - By Country/Sub-region
- 11.1.1 United States
- 11.1.2 Canada
- 12. Europe Pharma Packaging Industry Analysis, Insights and Forecast, 2019-2031
- 12.1. Market Analysis, Insights and Forecast - By Country/Sub-region
- 12.1.1 Germany
- 12.1.2 United Kingdom
- 12.1.3 France
- 12.1.4 Italy
- 12.1.5 Spain
- 12.1.6 Rest of Europe
- 13. Asia Pacific Pharma Packaging Industry Analysis, Insights and Forecast, 2019-2031
- 13.1. Market Analysis, Insights and Forecast - By Country/Sub-region
- 13.1.1 China
- 13.1.2 Japan
- 13.1.3 India
- 13.1.4 South Korea
- 13.1.5 Rest of Asia Pacific
- 14. Latin America Pharma Packaging Industry Analysis, Insights and Forecast, 2019-2031
- 14.1. Market Analysis, Insights and Forecast - By Country/Sub-region
- 14.1.1 Brazil
- 14.1.2 Mexico
- 14.1.3 Rest of Latin America
- 15. Middle East Pharma Packaging Industry Analysis, Insights and Forecast, 2019-2031
- 15.1. Market Analysis, Insights and Forecast - By Country/Sub-region
- 15.1.1.
- 16. United Arab Emirates Pharma Packaging Industry Analysis, Insights and Forecast, 2019-2031
- 16.1. Market Analysis, Insights and Forecast - By Country/Sub-region
- 16.1.1 Saudi Arabia
- 16.1.2 South Africa
- 16.1.3 Rest of Middle East
- 17. Competitive Analysis
- 17.1. Global Market Share Analysis 2024
- 17.2. Company Profiles
- 17.2.1 Becton Dickinson and Company
- 17.2.1.1. Overview
- 17.2.1.2. Products
- 17.2.1.3. SWOT Analysis
- 17.2.1.4. Recent Developments
- 17.2.1.5. Financials (Based on Availability)
- 17.2.2 West Pharmaceutical Services Inc
- 17.2.2.1. Overview
- 17.2.2.2. Products
- 17.2.2.3. SWOT Analysis
- 17.2.2.4. Recent Developments
- 17.2.2.5. Financials (Based on Availability)
- 17.2.3 WestRock Company
- 17.2.3.1. Overview
- 17.2.3.2. Products
- 17.2.3.3. SWOT Analysis
- 17.2.3.4. Recent Developments
- 17.2.3.5. Financials (Based on Availability)
- 17.2.4 Klockner Pentaplast Group
- 17.2.4.1. Overview
- 17.2.4.2. Products
- 17.2.4.3. SWOT Analysis
- 17.2.4.4. Recent Developments
- 17.2.4.5. Financials (Based on Availability)
- 17.2.5 Schott AG
- 17.2.5.1. Overview
- 17.2.5.2. Products
- 17.2.5.3. SWOT Analysis
- 17.2.5.4. Recent Developments
- 17.2.5.5. Financials (Based on Availability)
- 17.2.6 Nipro Corporation*List Not Exhaustive
- 17.2.6.1. Overview
- 17.2.6.2. Products
- 17.2.6.3. SWOT Analysis
- 17.2.6.4. Recent Developments
- 17.2.6.5. Financials (Based on Availability)
- 17.2.7 W L Gore & Associates Inc
- 17.2.7.1. Overview
- 17.2.7.2. Products
- 17.2.7.3. SWOT Analysis
- 17.2.7.4. Recent Developments
- 17.2.7.5. Financials (Based on Availability)
- 17.2.8 AptarGroup Inc
- 17.2.8.1. Overview
- 17.2.8.2. Products
- 17.2.8.3. SWOT Analysis
- 17.2.8.4. Recent Developments
- 17.2.8.5. Financials (Based on Availability)
- 17.2.9 Berry Global Group Inc
- 17.2.9.1. Overview
- 17.2.9.2. Products
- 17.2.9.3. SWOT Analysis
- 17.2.9.4. Recent Developments
- 17.2.9.5. Financials (Based on Availability)
- 17.2.10 3M Company
- 17.2.10.1. Overview
- 17.2.10.2. Products
- 17.2.10.3. SWOT Analysis
- 17.2.10.4. Recent Developments
- 17.2.10.5. Financials (Based on Availability)
- 17.2.11 Vetter Pharma International GmbH
- 17.2.11.1. Overview
- 17.2.11.2. Products
- 17.2.11.3. SWOT Analysis
- 17.2.11.4. Recent Developments
- 17.2.11.5. Financials (Based on Availability)
- 17.2.12 Amcor PLC
- 17.2.12.1. Overview
- 17.2.12.2. Products
- 17.2.12.3. SWOT Analysis
- 17.2.12.4. Recent Developments
- 17.2.12.5. Financials (Based on Availability)
- 17.2.13 CCL Industries Inc
- 17.2.13.1. Overview
- 17.2.13.2. Products
- 17.2.13.3. SWOT Analysis
- 17.2.13.4. Recent Developments
- 17.2.13.5. Financials (Based on Availability)
- 17.2.14 FlexiTuff International Ltd
- 17.2.14.1. Overview
- 17.2.14.2. Products
- 17.2.14.3. SWOT Analysis
- 17.2.14.4. Recent Developments
- 17.2.14.5. Financials (Based on Availability)
- 17.2.15 Catalent Inc
- 17.2.15.1. Overview
- 17.2.15.2. Products
- 17.2.15.3. SWOT Analysis
- 17.2.15.4. Recent Developments
- 17.2.15.5. Financials (Based on Availability)
- 17.2.16 McKesson Corporation
- 17.2.16.1. Overview
- 17.2.16.2. Products
- 17.2.16.3. SWOT Analysis
- 17.2.16.4. Recent Developments
- 17.2.16.5. Financials (Based on Availability)
- 17.2.17 Gerresheimer AG
- 17.2.17.1. Overview
- 17.2.17.2. Products
- 17.2.17.3. SWOT Analysis
- 17.2.17.4. Recent Developments
- 17.2.17.5. Financials (Based on Availability)
- 17.2.1 Becton Dickinson and Company
List of Figures
- Figure 1: Global Pharma Packaging Industry Revenue Breakdown (Million, %) by Region 2024 & 2032
- Figure 2: North America Pharma Packaging Industry Revenue (Million), by Country 2024 & 2032
- Figure 3: North America Pharma Packaging Industry Revenue Share (%), by Country 2024 & 2032
- Figure 4: Europe Pharma Packaging Industry Revenue (Million), by Country 2024 & 2032
- Figure 5: Europe Pharma Packaging Industry Revenue Share (%), by Country 2024 & 2032
- Figure 6: Asia Pacific Pharma Packaging Industry Revenue (Million), by Country 2024 & 2032
- Figure 7: Asia Pacific Pharma Packaging Industry Revenue Share (%), by Country 2024 & 2032
- Figure 8: Latin America Pharma Packaging Industry Revenue (Million), by Country 2024 & 2032
- Figure 9: Latin America Pharma Packaging Industry Revenue Share (%), by Country 2024 & 2032
- Figure 10: Middle East Pharma Packaging Industry Revenue (Million), by Country 2024 & 2032
- Figure 11: Middle East Pharma Packaging Industry Revenue Share (%), by Country 2024 & 2032
- Figure 12: United Arab Emirates Pharma Packaging Industry Revenue (Million), by Country 2024 & 2032
- Figure 13: United Arab Emirates Pharma Packaging Industry Revenue Share (%), by Country 2024 & 2032
- Figure 14: North America Pharma Packaging Industry Revenue (Million), by Material 2024 & 2032
- Figure 15: North America Pharma Packaging Industry Revenue Share (%), by Material 2024 & 2032
- Figure 16: North America Pharma Packaging Industry Revenue (Million), by Product Type 2024 & 2032
- Figure 17: North America Pharma Packaging Industry Revenue Share (%), by Product Type 2024 & 2032
- Figure 18: North America Pharma Packaging Industry Revenue (Million), by Country 2024 & 2032
- Figure 19: North America Pharma Packaging Industry Revenue Share (%), by Country 2024 & 2032
- Figure 20: Europe Pharma Packaging Industry Revenue (Million), by Material 2024 & 2032
- Figure 21: Europe Pharma Packaging Industry Revenue Share (%), by Material 2024 & 2032
- Figure 22: Europe Pharma Packaging Industry Revenue (Million), by Product Type 2024 & 2032
- Figure 23: Europe Pharma Packaging Industry Revenue Share (%), by Product Type 2024 & 2032
- Figure 24: Europe Pharma Packaging Industry Revenue (Million), by Country 2024 & 2032
- Figure 25: Europe Pharma Packaging Industry Revenue Share (%), by Country 2024 & 2032
- Figure 26: Asia Pacific Pharma Packaging Industry Revenue (Million), by Material 2024 & 2032
- Figure 27: Asia Pacific Pharma Packaging Industry Revenue Share (%), by Material 2024 & 2032
- Figure 28: Asia Pacific Pharma Packaging Industry Revenue (Million), by Product Type 2024 & 2032
- Figure 29: Asia Pacific Pharma Packaging Industry Revenue Share (%), by Product Type 2024 & 2032
- Figure 30: Asia Pacific Pharma Packaging Industry Revenue (Million), by Country 2024 & 2032
- Figure 31: Asia Pacific Pharma Packaging Industry Revenue Share (%), by Country 2024 & 2032
- Figure 32: Latin America Pharma Packaging Industry Revenue (Million), by Material 2024 & 2032
- Figure 33: Latin America Pharma Packaging Industry Revenue Share (%), by Material 2024 & 2032
- Figure 34: Latin America Pharma Packaging Industry Revenue (Million), by Product Type 2024 & 2032
- Figure 35: Latin America Pharma Packaging Industry Revenue Share (%), by Product Type 2024 & 2032
- Figure 36: Latin America Pharma Packaging Industry Revenue (Million), by Country 2024 & 2032
- Figure 37: Latin America Pharma Packaging Industry Revenue Share (%), by Country 2024 & 2032
- Figure 38: Middle East and Africa Pharma Packaging Industry Revenue (Million), by Material 2024 & 2032
- Figure 39: Middle East and Africa Pharma Packaging Industry Revenue Share (%), by Material 2024 & 2032
- Figure 40: Middle East and Africa Pharma Packaging Industry Revenue (Million), by Product Type 2024 & 2032
- Figure 41: Middle East and Africa Pharma Packaging Industry Revenue Share (%), by Product Type 2024 & 2032
- Figure 42: Middle East and Africa Pharma Packaging Industry Revenue (Million), by Country 2024 & 2032
- Figure 43: Middle East and Africa Pharma Packaging Industry Revenue Share (%), by Country 2024 & 2032
List of Tables
- Table 1: Global Pharma Packaging Industry Revenue Million Forecast, by Region 2019 & 2032
- Table 2: Global Pharma Packaging Industry Revenue Million Forecast, by Material 2019 & 2032
- Table 3: Global Pharma Packaging Industry Revenue Million Forecast, by Product Type 2019 & 2032
- Table 4: Global Pharma Packaging Industry Revenue Million Forecast, by Region 2019 & 2032
- Table 5: Global Pharma Packaging Industry Revenue Million Forecast, by Country 2019 & 2032
- Table 6: United States Pharma Packaging Industry Revenue (Million) Forecast, by Application 2019 & 2032
- Table 7: Canada Pharma Packaging Industry Revenue (Million) Forecast, by Application 2019 & 2032
- Table 8: Global Pharma Packaging Industry Revenue Million Forecast, by Country 2019 & 2032
- Table 9: Germany Pharma Packaging Industry Revenue (Million) Forecast, by Application 2019 & 2032
- Table 10: United Kingdom Pharma Packaging Industry Revenue (Million) Forecast, by Application 2019 & 2032
- Table 11: France Pharma Packaging Industry Revenue (Million) Forecast, by Application 2019 & 2032
- Table 12: Italy Pharma Packaging Industry Revenue (Million) Forecast, by Application 2019 & 2032
- Table 13: Spain Pharma Packaging Industry Revenue (Million) Forecast, by Application 2019 & 2032
- Table 14: Rest of Europe Pharma Packaging Industry Revenue (Million) Forecast, by Application 2019 & 2032
- Table 15: Global Pharma Packaging Industry Revenue Million Forecast, by Country 2019 & 2032
- Table 16: China Pharma Packaging Industry Revenue (Million) Forecast, by Application 2019 & 2032
- Table 17: Japan Pharma Packaging Industry Revenue (Million) Forecast, by Application 2019 & 2032
- Table 18: India Pharma Packaging Industry Revenue (Million) Forecast, by Application 2019 & 2032
- Table 19: South Korea Pharma Packaging Industry Revenue (Million) Forecast, by Application 2019 & 2032
- Table 20: Rest of Asia Pacific Pharma Packaging Industry Revenue (Million) Forecast, by Application 2019 & 2032
- Table 21: Global Pharma Packaging Industry Revenue Million Forecast, by Country 2019 & 2032
- Table 22: Brazil Pharma Packaging Industry Revenue (Million) Forecast, by Application 2019 & 2032
- Table 23: Mexico Pharma Packaging Industry Revenue (Million) Forecast, by Application 2019 & 2032
- Table 24: Rest of Latin America Pharma Packaging Industry Revenue (Million) Forecast, by Application 2019 & 2032
- Table 25: Global Pharma Packaging Industry Revenue Million Forecast, by Country 2019 & 2032
- Table 26: Pharma Packaging Industry Revenue (Million) Forecast, by Application 2019 & 2032
- Table 27: Global Pharma Packaging Industry Revenue Million Forecast, by Country 2019 & 2032
- Table 28: Saudi Arabia Pharma Packaging Industry Revenue (Million) Forecast, by Application 2019 & 2032
- Table 29: South Africa Pharma Packaging Industry Revenue (Million) Forecast, by Application 2019 & 2032
- Table 30: Rest of Middle East Pharma Packaging Industry Revenue (Million) Forecast, by Application 2019 & 2032
- Table 31: Global Pharma Packaging Industry Revenue Million Forecast, by Material 2019 & 2032
- Table 32: Global Pharma Packaging Industry Revenue Million Forecast, by Product Type 2019 & 2032
- Table 33: Global Pharma Packaging Industry Revenue Million Forecast, by Country 2019 & 2032
- Table 34: United States Pharma Packaging Industry Revenue (Million) Forecast, by Application 2019 & 2032
- Table 35: Canada Pharma Packaging Industry Revenue (Million) Forecast, by Application 2019 & 2032
- Table 36: Global Pharma Packaging Industry Revenue Million Forecast, by Material 2019 & 2032
- Table 37: Global Pharma Packaging Industry Revenue Million Forecast, by Product Type 2019 & 2032
- Table 38: Global Pharma Packaging Industry Revenue Million Forecast, by Country 2019 & 2032
- Table 39: Germany Pharma Packaging Industry Revenue (Million) Forecast, by Application 2019 & 2032
- Table 40: United Kingdom Pharma Packaging Industry Revenue (Million) Forecast, by Application 2019 & 2032
- Table 41: France Pharma Packaging Industry Revenue (Million) Forecast, by Application 2019 & 2032
- Table 42: Italy Pharma Packaging Industry Revenue (Million) Forecast, by Application 2019 & 2032
- Table 43: Spain Pharma Packaging Industry Revenue (Million) Forecast, by Application 2019 & 2032
- Table 44: Rest of Europe Pharma Packaging Industry Revenue (Million) Forecast, by Application 2019 & 2032
- Table 45: Global Pharma Packaging Industry Revenue Million Forecast, by Material 2019 & 2032
- Table 46: Global Pharma Packaging Industry Revenue Million Forecast, by Product Type 2019 & 2032
- Table 47: Global Pharma Packaging Industry Revenue Million Forecast, by Country 2019 & 2032
- Table 48: China Pharma Packaging Industry Revenue (Million) Forecast, by Application 2019 & 2032
- Table 49: Japan Pharma Packaging Industry Revenue (Million) Forecast, by Application 2019 & 2032
- Table 50: India Pharma Packaging Industry Revenue (Million) Forecast, by Application 2019 & 2032
- Table 51: South Korea Pharma Packaging Industry Revenue (Million) Forecast, by Application 2019 & 2032
- Table 52: Rest of Asia Pacific Pharma Packaging Industry Revenue (Million) Forecast, by Application 2019 & 2032
- Table 53: Global Pharma Packaging Industry Revenue Million Forecast, by Material 2019 & 2032
- Table 54: Global Pharma Packaging Industry Revenue Million Forecast, by Product Type 2019 & 2032
- Table 55: Global Pharma Packaging Industry Revenue Million Forecast, by Country 2019 & 2032
- Table 56: Brazil Pharma Packaging Industry Revenue (Million) Forecast, by Application 2019 & 2032
- Table 57: Mexico Pharma Packaging Industry Revenue (Million) Forecast, by Application 2019 & 2032
- Table 58: Rest of Latin America Pharma Packaging Industry Revenue (Million) Forecast, by Application 2019 & 2032
- Table 59: Global Pharma Packaging Industry Revenue Million Forecast, by Material 2019 & 2032
- Table 60: Global Pharma Packaging Industry Revenue Million Forecast, by Product Type 2019 & 2032
- Table 61: Global Pharma Packaging Industry Revenue Million Forecast, by Country 2019 & 2032
- Table 62: United Arab Emirates Pharma Packaging Industry Revenue (Million) Forecast, by Application 2019 & 2032
- Table 63: Saudi Arabia Pharma Packaging Industry Revenue (Million) Forecast, by Application 2019 & 2032
- Table 64: South Africa Pharma Packaging Industry Revenue (Million) Forecast, by Application 2019 & 2032
- Table 65: Rest of Middle East and Africa Pharma Packaging Industry Revenue (Million) Forecast, by Application 2019 & 2032
Frequently Asked Questions
1. What is the projected Compound Annual Growth Rate (CAGR) of the Pharma Packaging Industry?
The projected CAGR is approximately 6.10%.
2. Which companies are prominent players in the Pharma Packaging Industry?
Key companies in the market include Becton Dickinson and Company, West Pharmaceutical Services Inc, WestRock Company, Klockner Pentaplast Group, Schott AG, Nipro Corporation*List Not Exhaustive, W L Gore & Associates Inc, AptarGroup Inc, Berry Global Group Inc, 3M Company, Vetter Pharma International GmbH, Amcor PLC, CCL Industries Inc, FlexiTuff International Ltd, Catalent Inc, McKesson Corporation, Gerresheimer AG.
3. What are the main segments of the Pharma Packaging Industry?
The market segments include Material, Product Type.
4. Can you provide details about the market size?
The market size is estimated to be USD 102.10 Million as of 2022.
5. What are some drivers contributing to market growth?
Regulatory Standards on Packaging and Stringent Norms against Counterfeit Products; Impact of Nanotechnology due to Innovative and New- generation Packaging Solutions.
6. What are the notable trends driving market growth?
Plastic Packaging Holds a Significant Market Share.
7. Are there any restraints impacting market growth?
Stringent Government Regulations in Developed Countries.
8. Can you provide examples of recent developments in the market?
January 2023: Amcor announced the acquisition of Shanghai-based MDK. MDK, a market leader in medical device packaging and a key priority growth area for Amcor, has annual sales of about USD 50 million. The addition of MDK will strengthen Amcor's already strong healthcare platform in the Asia-Pacific region as it continues to focus its emphasis on higher growth priority categories.
9. What pricing options are available for accessing the report?
Pricing options include single-user, multi-user, and enterprise licenses priced at USD 4750, USD 5250, and USD 8750 respectively.
10. Is the market size provided in terms of value or volume?
The market size is provided in terms of value, measured in Million.
11. Are there any specific market keywords associated with the report?
Yes, the market keyword associated with the report is "Pharma Packaging Industry," which aids in identifying and referencing the specific market segment covered.
12. How do I determine which pricing option suits my needs best?
The pricing options vary based on user requirements and access needs. Individual users may opt for single-user licenses, while businesses requiring broader access may choose multi-user or enterprise licenses for cost-effective access to the report.
13. Are there any additional resources or data provided in the Pharma Packaging Industry report?
While the report offers comprehensive insights, it's advisable to review the specific contents or supplementary materials provided to ascertain if additional resources or data are available.
14. How can I stay updated on further developments or reports in the Pharma Packaging Industry?
To stay informed about further developments, trends, and reports in the Pharma Packaging Industry, consider subscribing to industry newsletters, following relevant companies and organizations, or regularly checking reputable industry news sources and publications.
Methodology
Step 1 - Identification of Relevant Samples Size from Population Database


Step 2 - Approaches for Defining Global Market Size (Value, Volume* & Price*)

Note*: In applicable scenarios
Step 3 - Data Sources
Primary Research
- Web Analytics
- Survey Reports
- Research Institute
- Latest Research Reports
- Opinion Leaders
Secondary Research
- Annual Reports
- White Paper
- Latest Press Release
- Industry Association
- Paid Database
- Investor Presentations

Step 4 - Data Triangulation
Involves using different sources of information in order to increase the validity of a study
These sources are likely to be stakeholders in a program - participants, other researchers, program staff, other community members, and so on.
Then we put all data in single framework & apply various statistical tools to find out the dynamic on the market.
During the analysis stage, feedback from the stakeholder groups would be compared to determine areas of agreement as well as areas of divergence
