

Key Insights
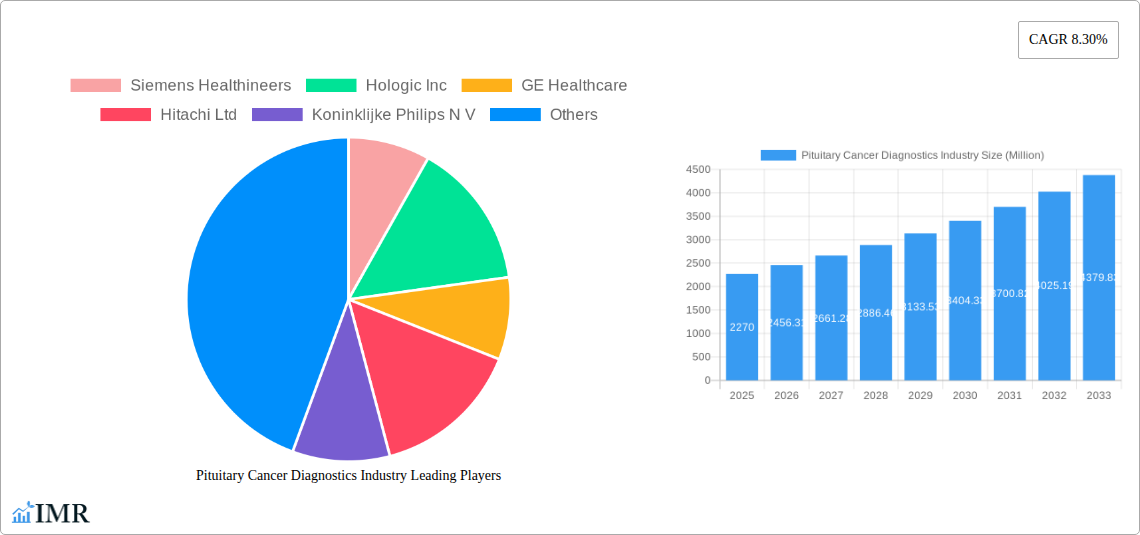
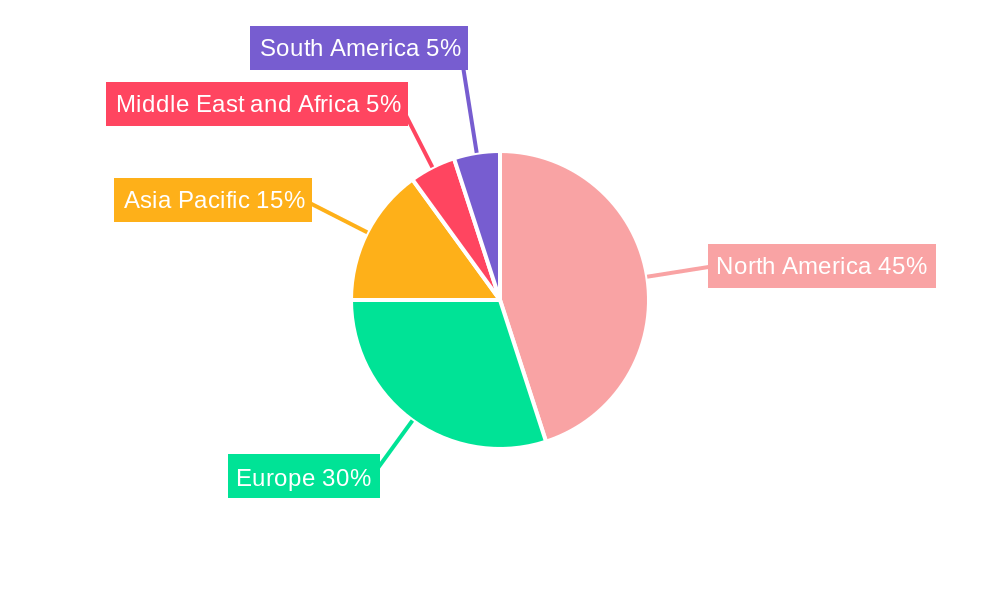
The global pituitary cancer diagnostics market, valued at approximately $2.27 billion in 2025, is projected to experience robust growth, driven by several key factors. Increasing prevalence of pituitary tumors, advancements in diagnostic technologies like MRI and PET scans offering improved accuracy and earlier detection, and a growing geriatric population (increasing susceptibility to pituitary adenomas) are significant contributors to market expansion. The rising adoption of minimally invasive surgical techniques also contributes positively, as better surgical options necessitate more precise diagnostics. Furthermore, the increasing awareness among patients and healthcare professionals about the importance of early diagnosis and treatment fuels demand for advanced diagnostic tools. The market is segmented by tumor type (metastatic, meningioma, glioblastoma, pituitary adenoma, others), end-user (hospitals, diagnostic centers, others), and diagnostic type (imaging tests, lumbar puncture, biopsy, molecular testing, others). The North American market currently holds a significant share, attributable to high healthcare expenditure and technological advancements. However, Asia Pacific is expected to witness substantial growth due to rising healthcare infrastructure development and increasing awareness about the disease. Competitive dynamics involve established players like Siemens Healthineers, Hologic Inc., and GE Healthcare, along with emerging players focusing on innovative diagnostic solutions.
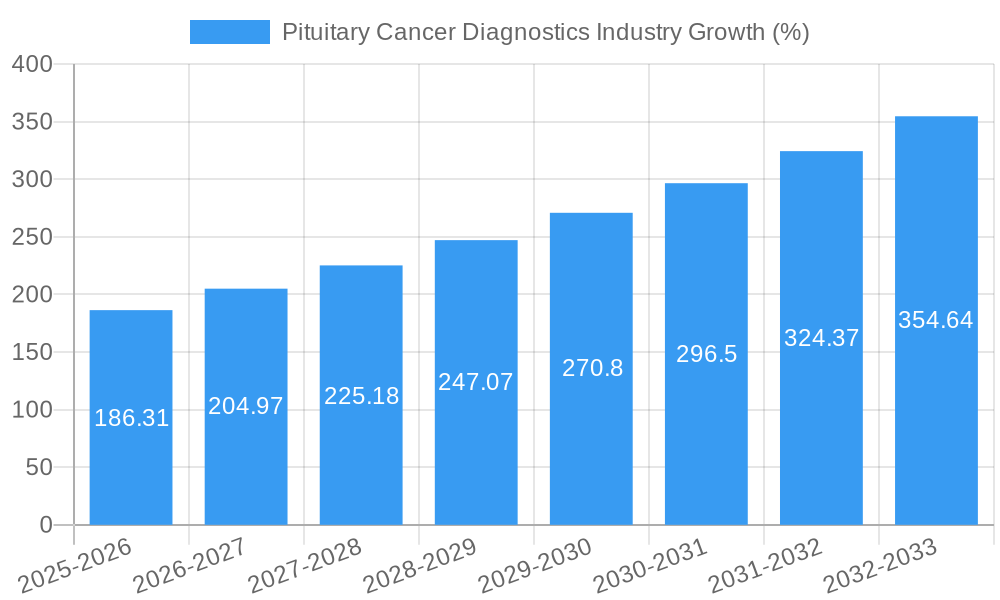
The market's Compound Annual Growth Rate (CAGR) of 8.30% from 2025 to 2033 indicates a significant expansion. However, challenges remain, including the high cost of advanced diagnostic procedures, which limits accessibility in some regions. Furthermore, the complexity of diagnosing pituitary tumors, often requiring multiple tests, poses a hurdle. Despite these constraints, continuous technological innovations, particularly in molecular diagnostics and imaging techniques, are expected to drive market growth, enhancing the accuracy and speed of diagnosis. This, coupled with the growing focus on personalized medicine, will shape the future landscape of pituitary cancer diagnostics.
Pituitary Cancer Diagnostics Market Report: 2019-2033
This comprehensive report provides a detailed analysis of the Pituitary Cancer Diagnostics market, encompassing market size, growth trends, competitive landscape, and future outlook. Focusing on the parent market of Brain Cancer Diagnostics and the child market of Pituitary Cancer Diagnostics, this report offers invaluable insights for industry professionals, investors, and stakeholders. The study period covers 2019-2033, with 2025 as the base and estimated year.
Study Period: 2019-2033 Base Year: 2025 Estimated Year: 2025 Forecast Period: 2025-2033 Historical Period: 2019-2024
Pituitary Cancer Diagnostics Industry Market Dynamics & Structure
The Pituitary Cancer Diagnostics market is characterized by moderate concentration, with key players like Siemens Healthineers, Hologic Inc, GE Healthcare, Hitachi Ltd, Koninklijke Philips N.V., Fujifilm Corporation, Thermo Fisher Scientific, and NantOmics vying for market share. Technological innovation, particularly in molecular diagnostics and advanced imaging, is a significant driver. Stringent regulatory frameworks, including FDA approvals for new diagnostic tools, influence market access and growth. Competitive substitutes exist, particularly in imaging modalities. The end-user demographics are primarily hospitals and diagnostics centers, with a growing contribution from other specialized facilities. M&A activity has been moderate, with xx deals recorded between 2019 and 2024, resulting in a market share shift of approximately xx%.
- Market Concentration: Moderately Concentrated
- Technological Innovation: Significant driver, focusing on molecular diagnostics and advanced imaging.
- Regulatory Frameworks: Stringent, impacting market access.
- Competitive Substitutes: Presence of alternative diagnostic methods.
- End-User Demographics: Hospitals and diagnostic centers dominate.
- M&A Activity: xx deals (2019-2024), resulting in xx% market share shift.
- Innovation Barriers: High R&D costs and regulatory hurdles.
Pituitary Cancer Diagnostics Industry Growth Trends & Insights
The Pituitary Cancer Diagnostics market exhibited a CAGR of xx% during the historical period (2019-2024), reaching a market size of xx million units in 2024. The market is projected to grow at a CAGR of xx% during the forecast period (2025-2033), driven by factors such as increasing prevalence of pituitary tumors, technological advancements in diagnostic techniques, and rising healthcare expenditure. Market penetration of advanced diagnostic tools is increasing, particularly in developed regions. Consumer behavior shifts toward personalized medicine and early detection are contributing to market growth. The adoption rate of molecular testing is expected to increase significantly, reaching xx% by 2033.
Dominant Regions, Countries, or Segments in Pituitary Cancer Diagnostics Industry
North America currently holds the largest market share in the Pituitary Cancer Diagnostics industry, driven by factors such as high healthcare spending, advanced healthcare infrastructure, and early adoption of new technologies. Within this region, the United States dominates due to high incidence rates and readily available advanced diagnostic facilities. The Meningioma segment holds the largest share within Tumor Type, attributed to its higher prevalence compared to other pituitary tumor types. Hospitals account for the largest portion of end users, owing to their comprehensive diagnostic capabilities. Imaging tests represent the largest share within diagnostic type, due to their widespread availability and utility.
- Key Drivers (North America): High healthcare expenditure, advanced infrastructure, early technology adoption.
- Key Drivers (Meningioma Segment): High prevalence compared to other tumor types.
- Key Drivers (Hospitals): Comprehensive diagnostic capabilities.
- Key Drivers (Imaging Tests): Widespread availability and utility.
- Growth Potential: Emerging markets in Asia-Pacific and Latin America show significant growth potential due to rising healthcare awareness and increasing diagnostic infrastructure.
Pituitary Cancer Diagnostics Industry Product Landscape
The Pituitary Cancer Diagnostics market offers a diverse range of products, including advanced imaging techniques (MRI, CT scans), molecular tests (PCR, Next-Generation Sequencing), and biopsy analysis. Recent innovations focus on improving sensitivity, specificity, and speed of diagnosis. Unique selling propositions include minimally invasive procedures, rapid turnaround times, and enhanced accuracy in identifying tumor types and subtypes. Technological advancements such as AI-powered image analysis are enhancing diagnostic capabilities.
Key Drivers, Barriers & Challenges in Pituitary Cancer Diagnostics Industry
Key Drivers:
- Increasing prevalence of pituitary tumors.
- Technological advancements in diagnostic techniques (e.g., liquid biopsies).
- Rising healthcare expenditure and insurance coverage.
- Growing awareness about early detection and personalized medicine.
Challenges and Restraints:
- High cost of advanced diagnostic technologies.
- Stringent regulatory approvals for new diagnostic tools.
- Limited access to advanced diagnostic facilities in low-income countries.
- Competition among existing and emerging players. This leads to price pressures and reduced profit margins impacting smaller companies disproportionately. (Estimated impact: xx% reduction in market profitability by 2033).
Emerging Opportunities in Pituitary Cancer Diagnostics Industry
- Development of point-of-care diagnostic tests for rapid diagnosis in remote areas.
- Integration of AI and machine learning for improved diagnostic accuracy and efficiency.
- Expansion into emerging markets with growing healthcare infrastructure.
- Development of personalized diagnostic approaches based on patient-specific genetic profiles.
Growth Accelerators in the Pituitary Cancer Diagnostics Industry
Technological advancements, particularly in liquid biopsies and AI-powered diagnostics, are key growth accelerators. Strategic partnerships between diagnostic companies and research institutions are fostering innovation. Expansion into emerging markets with unmet diagnostic needs is another significant growth driver. Government initiatives promoting early cancer detection and improved healthcare access also contribute to market expansion.
Key Players Shaping the Pituitary Cancer Diagnostics Market
- Siemens Healthineers
- Hologic Inc
- GE Healthcare
- Hitachi Ltd
- Koninklijke Philips N.V.
- Fujifilm Corporation
- Thermo Fisher Scientific
- NantOmics
Notable Milestones in Pituitary Cancer Diagnostics Industry Sector
- February 2023: Roche announced the launch of the IDH1 R132H (MRQ-67) Rabbit Monoclonal Primary Antibody and the ATRX Rabbit Polyclonal Antibody to identify mutation status in patients diagnosed with brain cancer. This expands diagnostic capabilities for a specific subset of brain cancers, potentially impacting the market for molecular diagnostics.
- January 2023: Datar Cancer Genetics Inc. received FDA breakthrough device designation for the TriNetra-Glio blood test to help in the diagnosis of brain tumors. This accelerated the approval process for a new blood-based test, potentially increasing market access and adoption.
In-Depth Pituitary Cancer Diagnostics Industry Market Outlook
The Pituitary Cancer Diagnostics market is poised for significant growth driven by technological advancements, rising prevalence of pituitary tumors, and increased healthcare spending. Strategic partnerships, expansion into emerging markets, and the development of personalized diagnostic solutions present lucrative opportunities for market players. The market’s future potential lies in integrating advanced technologies like AI and developing non-invasive diagnostic methods. Early detection strategies and improved access to diagnostics in underserved regions will be crucial in driving long-term market expansion.
Pituitary Cancer Diagnostics Industry Segmentation
-
1. Diagnostic Type
-
1.1. Imaging Test
- 1.1.1. MRI
- 1.1.2. CT Scan
- 1.1.3. Other
- 1.2. Lumbar Puncture
- 1.3. Biopsy
- 1.4. Molecular Testing
- 1.5. Others
-
1.1. Imaging Test
-
2. Tumor Type
- 2.1. Metastatic
- 2.2. Meningioma
- 2.3. Glioblastoma
- 2.4. Pituitary Endoma
- 2.5. Others
-
3. End User
- 3.1. Hospitals
- 3.2. Diagnostics Centers
- 3.3. Others
Pituitary Cancer Diagnostics Industry Segmentation By Geography
-
1. North America
- 1.1. United States
- 1.2. Canada
- 1.3. Mexico
-
2. Europe
- 2.1. Germany
- 2.2. United Kingdom
- 2.3. France
- 2.4. Italy
- 2.5. Spain
- 2.6. Rest of Europe
-
3. Asia Pacific
- 3.1. China
- 3.2. Japan
- 3.3. India
- 3.4. Australia
- 3.5. South Korea
- 3.6. Rest of Asia Pacific
-
4. Middle East and Africa
- 4.1. GCC
- 4.2. South Africa
- 4.3. Rest of Middle East and Africa
-
5. South America
- 5.1. Brazil
- 5.2. Argentina
- 5.3. Rest of South America
Pituitary Cancer Diagnostics Industry REPORT HIGHLIGHTS
| Aspects | Details |
|---|---|
| Study Period | 2019-2033 |
| Base Year | 2024 |
| Estimated Year | 2025 |
| Forecast Period | 2025-2033 |
| Historical Period | 2019-2024 |
| Growth Rate | CAGR of 8.30% from 2019-2033 |
| Segmentation |
|
Table of Contents
- 1. Introduction
- 1.1. Research Scope
- 1.2. Market Segmentation
- 1.3. Research Methodology
- 1.4. Definitions and Assumptions
- 2. Executive Summary
- 2.1. Introduction
- 3. Market Dynamics
- 3.1. Introduction
- 3.2. Market Drivers
- 3.2.1. Increasing Prevalence of Neurological Disorders and Cancers; Rising Number of Smokers
- 3.3. Market Restrains
- 3.3.1. High Costs Associated with Diagnosis
- 3.4. Market Trends
- 3.4.1. MRI segment is Expected to Hold a Significant Share in the Brain Tumor Diagnostics Market
- 4. Market Factor Analysis
- 4.1. Porters Five Forces
- 4.2. Supply/Value Chain
- 4.3. PESTEL analysis
- 4.4. Market Entropy
- 4.5. Patent/Trademark Analysis
- 5. Global Pituitary Cancer Diagnostics Industry Analysis, Insights and Forecast, 2019-2031
- 5.1. Market Analysis, Insights and Forecast - by Diagnostic Type
- 5.1.1. Imaging Test
- 5.1.1.1. MRI
- 5.1.1.2. CT Scan
- 5.1.1.3. Other
- 5.1.2. Lumbar Puncture
- 5.1.3. Biopsy
- 5.1.4. Molecular Testing
- 5.1.5. Others
- 5.1.1. Imaging Test
- 5.2. Market Analysis, Insights and Forecast - by Tumor Type
- 5.2.1. Metastatic
- 5.2.2. Meningioma
- 5.2.3. Glioblastoma
- 5.2.4. Pituitary Endoma
- 5.2.5. Others
- 5.3. Market Analysis, Insights and Forecast - by End User
- 5.3.1. Hospitals
- 5.3.2. Diagnostics Centers
- 5.3.3. Others
- 5.4. Market Analysis, Insights and Forecast - by Region
- 5.4.1. North America
- 5.4.2. Europe
- 5.4.3. Asia Pacific
- 5.4.4. Middle East and Africa
- 5.4.5. South America
- 5.1. Market Analysis, Insights and Forecast - by Diagnostic Type
- 6. North America Pituitary Cancer Diagnostics Industry Analysis, Insights and Forecast, 2019-2031
- 6.1. Market Analysis, Insights and Forecast - by Diagnostic Type
- 6.1.1. Imaging Test
- 6.1.1.1. MRI
- 6.1.1.2. CT Scan
- 6.1.1.3. Other
- 6.1.2. Lumbar Puncture
- 6.1.3. Biopsy
- 6.1.4. Molecular Testing
- 6.1.5. Others
- 6.1.1. Imaging Test
- 6.2. Market Analysis, Insights and Forecast - by Tumor Type
- 6.2.1. Metastatic
- 6.2.2. Meningioma
- 6.2.3. Glioblastoma
- 6.2.4. Pituitary Endoma
- 6.2.5. Others
- 6.3. Market Analysis, Insights and Forecast - by End User
- 6.3.1. Hospitals
- 6.3.2. Diagnostics Centers
- 6.3.3. Others
- 6.1. Market Analysis, Insights and Forecast - by Diagnostic Type
- 7. Europe Pituitary Cancer Diagnostics Industry Analysis, Insights and Forecast, 2019-2031
- 7.1. Market Analysis, Insights and Forecast - by Diagnostic Type
- 7.1.1. Imaging Test
- 7.1.1.1. MRI
- 7.1.1.2. CT Scan
- 7.1.1.3. Other
- 7.1.2. Lumbar Puncture
- 7.1.3. Biopsy
- 7.1.4. Molecular Testing
- 7.1.5. Others
- 7.1.1. Imaging Test
- 7.2. Market Analysis, Insights and Forecast - by Tumor Type
- 7.2.1. Metastatic
- 7.2.2. Meningioma
- 7.2.3. Glioblastoma
- 7.2.4. Pituitary Endoma
- 7.2.5. Others
- 7.3. Market Analysis, Insights and Forecast - by End User
- 7.3.1. Hospitals
- 7.3.2. Diagnostics Centers
- 7.3.3. Others
- 7.1. Market Analysis, Insights and Forecast - by Diagnostic Type
- 8. Asia Pacific Pituitary Cancer Diagnostics Industry Analysis, Insights and Forecast, 2019-2031
- 8.1. Market Analysis, Insights and Forecast - by Diagnostic Type
- 8.1.1. Imaging Test
- 8.1.1.1. MRI
- 8.1.1.2. CT Scan
- 8.1.1.3. Other
- 8.1.2. Lumbar Puncture
- 8.1.3. Biopsy
- 8.1.4. Molecular Testing
- 8.1.5. Others
- 8.1.1. Imaging Test
- 8.2. Market Analysis, Insights and Forecast - by Tumor Type
- 8.2.1. Metastatic
- 8.2.2. Meningioma
- 8.2.3. Glioblastoma
- 8.2.4. Pituitary Endoma
- 8.2.5. Others
- 8.3. Market Analysis, Insights and Forecast - by End User
- 8.3.1. Hospitals
- 8.3.2. Diagnostics Centers
- 8.3.3. Others
- 8.1. Market Analysis, Insights and Forecast - by Diagnostic Type
- 9. Middle East and Africa Pituitary Cancer Diagnostics Industry Analysis, Insights and Forecast, 2019-2031
- 9.1. Market Analysis, Insights and Forecast - by Diagnostic Type
- 9.1.1. Imaging Test
- 9.1.1.1. MRI
- 9.1.1.2. CT Scan
- 9.1.1.3. Other
- 9.1.2. Lumbar Puncture
- 9.1.3. Biopsy
- 9.1.4. Molecular Testing
- 9.1.5. Others
- 9.1.1. Imaging Test
- 9.2. Market Analysis, Insights and Forecast - by Tumor Type
- 9.2.1. Metastatic
- 9.2.2. Meningioma
- 9.2.3. Glioblastoma
- 9.2.4. Pituitary Endoma
- 9.2.5. Others
- 9.3. Market Analysis, Insights and Forecast - by End User
- 9.3.1. Hospitals
- 9.3.2. Diagnostics Centers
- 9.3.3. Others
- 9.1. Market Analysis, Insights and Forecast - by Diagnostic Type
- 10. South America Pituitary Cancer Diagnostics Industry Analysis, Insights and Forecast, 2019-2031
- 10.1. Market Analysis, Insights and Forecast - by Diagnostic Type
- 10.1.1. Imaging Test
- 10.1.1.1. MRI
- 10.1.1.2. CT Scan
- 10.1.1.3. Other
- 10.1.2. Lumbar Puncture
- 10.1.3. Biopsy
- 10.1.4. Molecular Testing
- 10.1.5. Others
- 10.1.1. Imaging Test
- 10.2. Market Analysis, Insights and Forecast - by Tumor Type
- 10.2.1. Metastatic
- 10.2.2. Meningioma
- 10.2.3. Glioblastoma
- 10.2.4. Pituitary Endoma
- 10.2.5. Others
- 10.3. Market Analysis, Insights and Forecast - by End User
- 10.3.1. Hospitals
- 10.3.2. Diagnostics Centers
- 10.3.3. Others
- 10.1. Market Analysis, Insights and Forecast - by Diagnostic Type
- 11. North America Pituitary Cancer Diagnostics Industry Analysis, Insights and Forecast, 2019-2031
- 11.1. Market Analysis, Insights and Forecast - By Country/Sub-region
- 11.1.1 United States
- 11.1.2 Canada
- 11.1.3 Mexico
- 12. Europe Pituitary Cancer Diagnostics Industry Analysis, Insights and Forecast, 2019-2031
- 12.1. Market Analysis, Insights and Forecast - By Country/Sub-region
- 12.1.1 Germany
- 12.1.2 United Kingdom
- 12.1.3 France
- 12.1.4 Italy
- 12.1.5 Spain
- 12.1.6 Rest of Europe
- 13. Asia Pacific Pituitary Cancer Diagnostics Industry Analysis, Insights and Forecast, 2019-2031
- 13.1. Market Analysis, Insights and Forecast - By Country/Sub-region
- 13.1.1 China
- 13.1.2 Japan
- 13.1.3 India
- 13.1.4 Australia
- 13.1.5 South Korea
- 13.1.6 Rest of Asia Pacific
- 14. Middle East and Africa Pituitary Cancer Diagnostics Industry Analysis, Insights and Forecast, 2019-2031
- 14.1. Market Analysis, Insights and Forecast - By Country/Sub-region
- 14.1.1 GCC
- 14.1.2 South Africa
- 14.1.3 Rest of Middle East and Africa
- 15. South America Pituitary Cancer Diagnostics Industry Analysis, Insights and Forecast, 2019-2031
- 15.1. Market Analysis, Insights and Forecast - By Country/Sub-region
- 15.1.1 Brazil
- 15.1.2 Argentina
- 15.1.3 Rest of South America
- 16. Competitive Analysis
- 16.1. Global Market Share Analysis 2024
- 16.2. Company Profiles
- 16.2.1 Siemens Healthineers
- 16.2.1.1. Overview
- 16.2.1.2. Products
- 16.2.1.3. SWOT Analysis
- 16.2.1.4. Recent Developments
- 16.2.1.5. Financials (Based on Availability)
- 16.2.2 Hologic Inc
- 16.2.2.1. Overview
- 16.2.2.2. Products
- 16.2.2.3. SWOT Analysis
- 16.2.2.4. Recent Developments
- 16.2.2.5. Financials (Based on Availability)
- 16.2.3 GE Healthcare
- 16.2.3.1. Overview
- 16.2.3.2. Products
- 16.2.3.3. SWOT Analysis
- 16.2.3.4. Recent Developments
- 16.2.3.5. Financials (Based on Availability)
- 16.2.4 Hitachi Ltd
- 16.2.4.1. Overview
- 16.2.4.2. Products
- 16.2.4.3. SWOT Analysis
- 16.2.4.4. Recent Developments
- 16.2.4.5. Financials (Based on Availability)
- 16.2.5 Koninklijke Philips N V
- 16.2.5.1. Overview
- 16.2.5.2. Products
- 16.2.5.3. SWOT Analysis
- 16.2.5.4. Recent Developments
- 16.2.5.5. Financials (Based on Availability)
- 16.2.6 Fujifilm Corporation
- 16.2.6.1. Overview
- 16.2.6.2. Products
- 16.2.6.3. SWOT Analysis
- 16.2.6.4. Recent Developments
- 16.2.6.5. Financials (Based on Availability)
- 16.2.7 Thermo Fisher Scientific
- 16.2.7.1. Overview
- 16.2.7.2. Products
- 16.2.7.3. SWOT Analysis
- 16.2.7.4. Recent Developments
- 16.2.7.5. Financials (Based on Availability)
- 16.2.8 NantOmics
- 16.2.8.1. Overview
- 16.2.8.2. Products
- 16.2.8.3. SWOT Analysis
- 16.2.8.4. Recent Developments
- 16.2.8.5. Financials (Based on Availability)
- 16.2.1 Siemens Healthineers
List of Figures
- Figure 1: Global Pituitary Cancer Diagnostics Industry Revenue Breakdown (Million, %) by Region 2024 & 2032
- Figure 2: North America Pituitary Cancer Diagnostics Industry Revenue (Million), by Country 2024 & 2032
- Figure 3: North America Pituitary Cancer Diagnostics Industry Revenue Share (%), by Country 2024 & 2032
- Figure 4: Europe Pituitary Cancer Diagnostics Industry Revenue (Million), by Country 2024 & 2032
- Figure 5: Europe Pituitary Cancer Diagnostics Industry Revenue Share (%), by Country 2024 & 2032
- Figure 6: Asia Pacific Pituitary Cancer Diagnostics Industry Revenue (Million), by Country 2024 & 2032
- Figure 7: Asia Pacific Pituitary Cancer Diagnostics Industry Revenue Share (%), by Country 2024 & 2032
- Figure 8: Middle East and Africa Pituitary Cancer Diagnostics Industry Revenue (Million), by Country 2024 & 2032
- Figure 9: Middle East and Africa Pituitary Cancer Diagnostics Industry Revenue Share (%), by Country 2024 & 2032
- Figure 10: South America Pituitary Cancer Diagnostics Industry Revenue (Million), by Country 2024 & 2032
- Figure 11: South America Pituitary Cancer Diagnostics Industry Revenue Share (%), by Country 2024 & 2032
- Figure 12: North America Pituitary Cancer Diagnostics Industry Revenue (Million), by Diagnostic Type 2024 & 2032
- Figure 13: North America Pituitary Cancer Diagnostics Industry Revenue Share (%), by Diagnostic Type 2024 & 2032
- Figure 14: North America Pituitary Cancer Diagnostics Industry Revenue (Million), by Tumor Type 2024 & 2032
- Figure 15: North America Pituitary Cancer Diagnostics Industry Revenue Share (%), by Tumor Type 2024 & 2032
- Figure 16: North America Pituitary Cancer Diagnostics Industry Revenue (Million), by End User 2024 & 2032
- Figure 17: North America Pituitary Cancer Diagnostics Industry Revenue Share (%), by End User 2024 & 2032
- Figure 18: North America Pituitary Cancer Diagnostics Industry Revenue (Million), by Country 2024 & 2032
- Figure 19: North America Pituitary Cancer Diagnostics Industry Revenue Share (%), by Country 2024 & 2032
- Figure 20: Europe Pituitary Cancer Diagnostics Industry Revenue (Million), by Diagnostic Type 2024 & 2032
- Figure 21: Europe Pituitary Cancer Diagnostics Industry Revenue Share (%), by Diagnostic Type 2024 & 2032
- Figure 22: Europe Pituitary Cancer Diagnostics Industry Revenue (Million), by Tumor Type 2024 & 2032
- Figure 23: Europe Pituitary Cancer Diagnostics Industry Revenue Share (%), by Tumor Type 2024 & 2032
- Figure 24: Europe Pituitary Cancer Diagnostics Industry Revenue (Million), by End User 2024 & 2032
- Figure 25: Europe Pituitary Cancer Diagnostics Industry Revenue Share (%), by End User 2024 & 2032
- Figure 26: Europe Pituitary Cancer Diagnostics Industry Revenue (Million), by Country 2024 & 2032
- Figure 27: Europe Pituitary Cancer Diagnostics Industry Revenue Share (%), by Country 2024 & 2032
- Figure 28: Asia Pacific Pituitary Cancer Diagnostics Industry Revenue (Million), by Diagnostic Type 2024 & 2032
- Figure 29: Asia Pacific Pituitary Cancer Diagnostics Industry Revenue Share (%), by Diagnostic Type 2024 & 2032
- Figure 30: Asia Pacific Pituitary Cancer Diagnostics Industry Revenue (Million), by Tumor Type 2024 & 2032
- Figure 31: Asia Pacific Pituitary Cancer Diagnostics Industry Revenue Share (%), by Tumor Type 2024 & 2032
- Figure 32: Asia Pacific Pituitary Cancer Diagnostics Industry Revenue (Million), by End User 2024 & 2032
- Figure 33: Asia Pacific Pituitary Cancer Diagnostics Industry Revenue Share (%), by End User 2024 & 2032
- Figure 34: Asia Pacific Pituitary Cancer Diagnostics Industry Revenue (Million), by Country 2024 & 2032
- Figure 35: Asia Pacific Pituitary Cancer Diagnostics Industry Revenue Share (%), by Country 2024 & 2032
- Figure 36: Middle East and Africa Pituitary Cancer Diagnostics Industry Revenue (Million), by Diagnostic Type 2024 & 2032
- Figure 37: Middle East and Africa Pituitary Cancer Diagnostics Industry Revenue Share (%), by Diagnostic Type 2024 & 2032
- Figure 38: Middle East and Africa Pituitary Cancer Diagnostics Industry Revenue (Million), by Tumor Type 2024 & 2032
- Figure 39: Middle East and Africa Pituitary Cancer Diagnostics Industry Revenue Share (%), by Tumor Type 2024 & 2032
- Figure 40: Middle East and Africa Pituitary Cancer Diagnostics Industry Revenue (Million), by End User 2024 & 2032
- Figure 41: Middle East and Africa Pituitary Cancer Diagnostics Industry Revenue Share (%), by End User 2024 & 2032
- Figure 42: Middle East and Africa Pituitary Cancer Diagnostics Industry Revenue (Million), by Country 2024 & 2032
- Figure 43: Middle East and Africa Pituitary Cancer Diagnostics Industry Revenue Share (%), by Country 2024 & 2032
- Figure 44: South America Pituitary Cancer Diagnostics Industry Revenue (Million), by Diagnostic Type 2024 & 2032
- Figure 45: South America Pituitary Cancer Diagnostics Industry Revenue Share (%), by Diagnostic Type 2024 & 2032
- Figure 46: South America Pituitary Cancer Diagnostics Industry Revenue (Million), by Tumor Type 2024 & 2032
- Figure 47: South America Pituitary Cancer Diagnostics Industry Revenue Share (%), by Tumor Type 2024 & 2032
- Figure 48: South America Pituitary Cancer Diagnostics Industry Revenue (Million), by End User 2024 & 2032
- Figure 49: South America Pituitary Cancer Diagnostics Industry Revenue Share (%), by End User 2024 & 2032
- Figure 50: South America Pituitary Cancer Diagnostics Industry Revenue (Million), by Country 2024 & 2032
- Figure 51: South America Pituitary Cancer Diagnostics Industry Revenue Share (%), by Country 2024 & 2032
List of Tables
- Table 1: Global Pituitary Cancer Diagnostics Industry Revenue Million Forecast, by Region 2019 & 2032
- Table 2: Global Pituitary Cancer Diagnostics Industry Revenue Million Forecast, by Diagnostic Type 2019 & 2032
- Table 3: Global Pituitary Cancer Diagnostics Industry Revenue Million Forecast, by Tumor Type 2019 & 2032
- Table 4: Global Pituitary Cancer Diagnostics Industry Revenue Million Forecast, by End User 2019 & 2032
- Table 5: Global Pituitary Cancer Diagnostics Industry Revenue Million Forecast, by Region 2019 & 2032
- Table 6: Global Pituitary Cancer Diagnostics Industry Revenue Million Forecast, by Country 2019 & 2032
- Table 7: United States Pituitary Cancer Diagnostics Industry Revenue (Million) Forecast, by Application 2019 & 2032
- Table 8: Canada Pituitary Cancer Diagnostics Industry Revenue (Million) Forecast, by Application 2019 & 2032
- Table 9: Mexico Pituitary Cancer Diagnostics Industry Revenue (Million) Forecast, by Application 2019 & 2032
- Table 10: Global Pituitary Cancer Diagnostics Industry Revenue Million Forecast, by Country 2019 & 2032
- Table 11: Germany Pituitary Cancer Diagnostics Industry Revenue (Million) Forecast, by Application 2019 & 2032
- Table 12: United Kingdom Pituitary Cancer Diagnostics Industry Revenue (Million) Forecast, by Application 2019 & 2032
- Table 13: France Pituitary Cancer Diagnostics Industry Revenue (Million) Forecast, by Application 2019 & 2032
- Table 14: Italy Pituitary Cancer Diagnostics Industry Revenue (Million) Forecast, by Application 2019 & 2032
- Table 15: Spain Pituitary Cancer Diagnostics Industry Revenue (Million) Forecast, by Application 2019 & 2032
- Table 16: Rest of Europe Pituitary Cancer Diagnostics Industry Revenue (Million) Forecast, by Application 2019 & 2032
- Table 17: Global Pituitary Cancer Diagnostics Industry Revenue Million Forecast, by Country 2019 & 2032
- Table 18: China Pituitary Cancer Diagnostics Industry Revenue (Million) Forecast, by Application 2019 & 2032
- Table 19: Japan Pituitary Cancer Diagnostics Industry Revenue (Million) Forecast, by Application 2019 & 2032
- Table 20: India Pituitary Cancer Diagnostics Industry Revenue (Million) Forecast, by Application 2019 & 2032
- Table 21: Australia Pituitary Cancer Diagnostics Industry Revenue (Million) Forecast, by Application 2019 & 2032
- Table 22: South Korea Pituitary Cancer Diagnostics Industry Revenue (Million) Forecast, by Application 2019 & 2032
- Table 23: Rest of Asia Pacific Pituitary Cancer Diagnostics Industry Revenue (Million) Forecast, by Application 2019 & 2032
- Table 24: Global Pituitary Cancer Diagnostics Industry Revenue Million Forecast, by Country 2019 & 2032
- Table 25: GCC Pituitary Cancer Diagnostics Industry Revenue (Million) Forecast, by Application 2019 & 2032
- Table 26: South Africa Pituitary Cancer Diagnostics Industry Revenue (Million) Forecast, by Application 2019 & 2032
- Table 27: Rest of Middle East and Africa Pituitary Cancer Diagnostics Industry Revenue (Million) Forecast, by Application 2019 & 2032
- Table 28: Global Pituitary Cancer Diagnostics Industry Revenue Million Forecast, by Country 2019 & 2032
- Table 29: Brazil Pituitary Cancer Diagnostics Industry Revenue (Million) Forecast, by Application 2019 & 2032
- Table 30: Argentina Pituitary Cancer Diagnostics Industry Revenue (Million) Forecast, by Application 2019 & 2032
- Table 31: Rest of South America Pituitary Cancer Diagnostics Industry Revenue (Million) Forecast, by Application 2019 & 2032
- Table 32: Global Pituitary Cancer Diagnostics Industry Revenue Million Forecast, by Diagnostic Type 2019 & 2032
- Table 33: Global Pituitary Cancer Diagnostics Industry Revenue Million Forecast, by Tumor Type 2019 & 2032
- Table 34: Global Pituitary Cancer Diagnostics Industry Revenue Million Forecast, by End User 2019 & 2032
- Table 35: Global Pituitary Cancer Diagnostics Industry Revenue Million Forecast, by Country 2019 & 2032
- Table 36: United States Pituitary Cancer Diagnostics Industry Revenue (Million) Forecast, by Application 2019 & 2032
- Table 37: Canada Pituitary Cancer Diagnostics Industry Revenue (Million) Forecast, by Application 2019 & 2032
- Table 38: Mexico Pituitary Cancer Diagnostics Industry Revenue (Million) Forecast, by Application 2019 & 2032
- Table 39: Global Pituitary Cancer Diagnostics Industry Revenue Million Forecast, by Diagnostic Type 2019 & 2032
- Table 40: Global Pituitary Cancer Diagnostics Industry Revenue Million Forecast, by Tumor Type 2019 & 2032
- Table 41: Global Pituitary Cancer Diagnostics Industry Revenue Million Forecast, by End User 2019 & 2032
- Table 42: Global Pituitary Cancer Diagnostics Industry Revenue Million Forecast, by Country 2019 & 2032
- Table 43: Germany Pituitary Cancer Diagnostics Industry Revenue (Million) Forecast, by Application 2019 & 2032
- Table 44: United Kingdom Pituitary Cancer Diagnostics Industry Revenue (Million) Forecast, by Application 2019 & 2032
- Table 45: France Pituitary Cancer Diagnostics Industry Revenue (Million) Forecast, by Application 2019 & 2032
- Table 46: Italy Pituitary Cancer Diagnostics Industry Revenue (Million) Forecast, by Application 2019 & 2032
- Table 47: Spain Pituitary Cancer Diagnostics Industry Revenue (Million) Forecast, by Application 2019 & 2032
- Table 48: Rest of Europe Pituitary Cancer Diagnostics Industry Revenue (Million) Forecast, by Application 2019 & 2032
- Table 49: Global Pituitary Cancer Diagnostics Industry Revenue Million Forecast, by Diagnostic Type 2019 & 2032
- Table 50: Global Pituitary Cancer Diagnostics Industry Revenue Million Forecast, by Tumor Type 2019 & 2032
- Table 51: Global Pituitary Cancer Diagnostics Industry Revenue Million Forecast, by End User 2019 & 2032
- Table 52: Global Pituitary Cancer Diagnostics Industry Revenue Million Forecast, by Country 2019 & 2032
- Table 53: China Pituitary Cancer Diagnostics Industry Revenue (Million) Forecast, by Application 2019 & 2032
- Table 54: Japan Pituitary Cancer Diagnostics Industry Revenue (Million) Forecast, by Application 2019 & 2032
- Table 55: India Pituitary Cancer Diagnostics Industry Revenue (Million) Forecast, by Application 2019 & 2032
- Table 56: Australia Pituitary Cancer Diagnostics Industry Revenue (Million) Forecast, by Application 2019 & 2032
- Table 57: South Korea Pituitary Cancer Diagnostics Industry Revenue (Million) Forecast, by Application 2019 & 2032
- Table 58: Rest of Asia Pacific Pituitary Cancer Diagnostics Industry Revenue (Million) Forecast, by Application 2019 & 2032
- Table 59: Global Pituitary Cancer Diagnostics Industry Revenue Million Forecast, by Diagnostic Type 2019 & 2032
- Table 60: Global Pituitary Cancer Diagnostics Industry Revenue Million Forecast, by Tumor Type 2019 & 2032
- Table 61: Global Pituitary Cancer Diagnostics Industry Revenue Million Forecast, by End User 2019 & 2032
- Table 62: Global Pituitary Cancer Diagnostics Industry Revenue Million Forecast, by Country 2019 & 2032
- Table 63: GCC Pituitary Cancer Diagnostics Industry Revenue (Million) Forecast, by Application 2019 & 2032
- Table 64: South Africa Pituitary Cancer Diagnostics Industry Revenue (Million) Forecast, by Application 2019 & 2032
- Table 65: Rest of Middle East and Africa Pituitary Cancer Diagnostics Industry Revenue (Million) Forecast, by Application 2019 & 2032
- Table 66: Global Pituitary Cancer Diagnostics Industry Revenue Million Forecast, by Diagnostic Type 2019 & 2032
- Table 67: Global Pituitary Cancer Diagnostics Industry Revenue Million Forecast, by Tumor Type 2019 & 2032
- Table 68: Global Pituitary Cancer Diagnostics Industry Revenue Million Forecast, by End User 2019 & 2032
- Table 69: Global Pituitary Cancer Diagnostics Industry Revenue Million Forecast, by Country 2019 & 2032
- Table 70: Brazil Pituitary Cancer Diagnostics Industry Revenue (Million) Forecast, by Application 2019 & 2032
- Table 71: Argentina Pituitary Cancer Diagnostics Industry Revenue (Million) Forecast, by Application 2019 & 2032
- Table 72: Rest of South America Pituitary Cancer Diagnostics Industry Revenue (Million) Forecast, by Application 2019 & 2032
Frequently Asked Questions
1. What is the projected Compound Annual Growth Rate (CAGR) of the Pituitary Cancer Diagnostics Industry?
The projected CAGR is approximately 8.30%.
2. Which companies are prominent players in the Pituitary Cancer Diagnostics Industry?
Key companies in the market include Siemens Healthineers, Hologic Inc, GE Healthcare, Hitachi Ltd, Koninklijke Philips N V, Fujifilm Corporation, Thermo Fisher Scientific, NantOmics.
3. What are the main segments of the Pituitary Cancer Diagnostics Industry?
The market segments include Diagnostic Type, Tumor Type, End User.
4. Can you provide details about the market size?
The market size is estimated to be USD 2.27 Million as of 2022.
5. What are some drivers contributing to market growth?
Increasing Prevalence of Neurological Disorders and Cancers; Rising Number of Smokers.
6. What are the notable trends driving market growth?
MRI segment is Expected to Hold a Significant Share in the Brain Tumor Diagnostics Market.
7. Are there any restraints impacting market growth?
High Costs Associated with Diagnosis.
8. Can you provide examples of recent developments in the market?
February 2023: Roche announced the launch of the IDH1 R132H (MRQ-67) Rabbit Monoclonal Primary Antibody and the ATRX Rabbit Polyclonal Antibody to identify mutation status in patients diagnosed with brain cancer.
9. What pricing options are available for accessing the report?
Pricing options include single-user, multi-user, and enterprise licenses priced at USD 4750, USD 5250, and USD 8750 respectively.
10. Is the market size provided in terms of value or volume?
The market size is provided in terms of value, measured in Million.
11. Are there any specific market keywords associated with the report?
Yes, the market keyword associated with the report is "Pituitary Cancer Diagnostics Industry," which aids in identifying and referencing the specific market segment covered.
12. How do I determine which pricing option suits my needs best?
The pricing options vary based on user requirements and access needs. Individual users may opt for single-user licenses, while businesses requiring broader access may choose multi-user or enterprise licenses for cost-effective access to the report.
13. Are there any additional resources or data provided in the Pituitary Cancer Diagnostics Industry report?
While the report offers comprehensive insights, it's advisable to review the specific contents or supplementary materials provided to ascertain if additional resources or data are available.
14. How can I stay updated on further developments or reports in the Pituitary Cancer Diagnostics Industry?
To stay informed about further developments, trends, and reports in the Pituitary Cancer Diagnostics Industry, consider subscribing to industry newsletters, following relevant companies and organizations, or regularly checking reputable industry news sources and publications.
Methodology
Step 1 - Identification of Relevant Samples Size from Population Database


Step 2 - Approaches for Defining Global Market Size (Value, Volume* & Price*)

Note*: In applicable scenarios
Step 3 - Data Sources
Primary Research
- Web Analytics
- Survey Reports
- Research Institute
- Latest Research Reports
- Opinion Leaders
Secondary Research
- Annual Reports
- White Paper
- Latest Press Release
- Industry Association
- Paid Database
- Investor Presentations

Step 4 - Data Triangulation
Involves using different sources of information in order to increase the validity of a study
These sources are likely to be stakeholders in a program - participants, other researchers, program staff, other community members, and so on.
Then we put all data in single framework & apply various statistical tools to find out the dynamic on the market.
During the analysis stage, feedback from the stakeholder groups would be compared to determine areas of agreement as well as areas of divergence
