

Key Insights
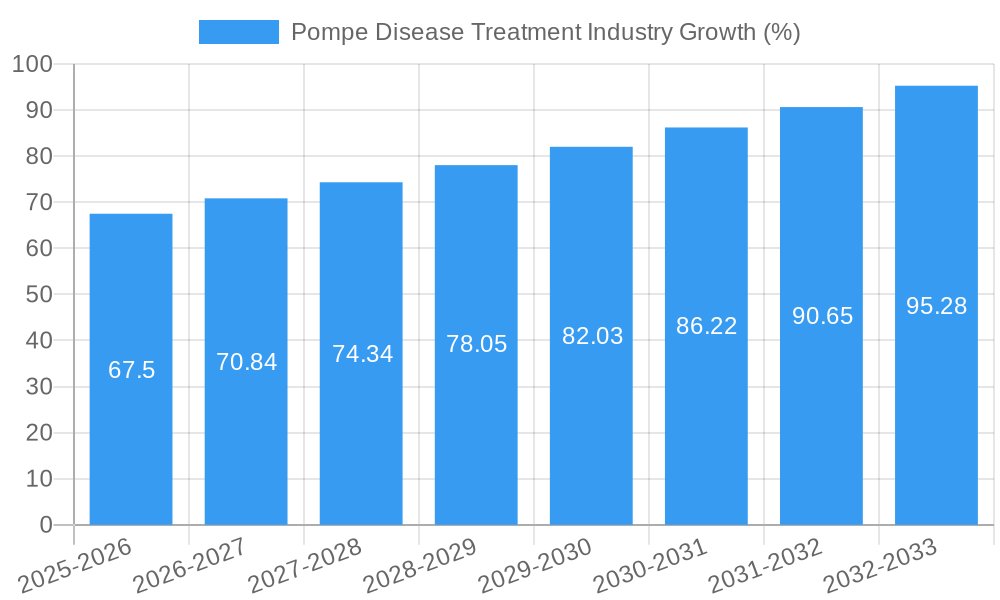
The Pompe Disease Treatment market, valued at approximately $1.5 billion in 2025, is projected to experience robust growth, exhibiting a Compound Annual Growth Rate (CAGR) of 4.50% from 2025 to 2033. This expansion is fueled by several key factors. Firstly, an increasing awareness and diagnosis rate of Pompe disease, a rare genetic disorder, are leading to a larger addressable patient population. Secondly, advancements in treatment modalities, particularly Enzyme Replacement Therapy (ERT) and Substrate Reduction Therapy (SRT), are offering improved efficacy and patient outcomes, driving market adoption. The Parenteral route of administration currently dominates the market, reflecting the established efficacy of intravenous therapies, although oral formulations are emerging as a promising area of research and development. Hospitals and Ambulatory Surgical Centers represent the primary end-users, given the specialized nature of Pompe disease treatment. Geographically, North America holds a significant market share due to higher healthcare spending, advanced infrastructure, and a relatively large patient population. However, the Asia Pacific region is expected to witness substantial growth in the forecast period, driven by increasing healthcare expenditure and rising awareness of rare diseases. Despite this positive outlook, market growth is somewhat restrained by the high cost of treatment, limiting accessibility in certain regions and among patients lacking appropriate insurance coverage. Competition among established pharmaceutical companies and emerging biotech firms further shapes the market dynamics.
The competitive landscape is characterized by a mix of large pharmaceutical companies such as Astellas Pharma, Sanofi, and Amicus Therapeutics, alongside smaller, more specialized companies like AVROBIO Inc. and EpiVax Inc. focused on innovative therapies. The presence of these diverse players fosters innovation, with ongoing research and development efforts targeting improved treatment efficacy, safety profiles, and convenient administration routes. Future market trends will likely be influenced by the emergence of novel therapeutic approaches, including gene therapy, and the expansion of access to treatment in underserved populations. The ongoing development and regulatory approval of new therapies will significantly influence market growth and shape the competitive dynamics in the coming years. Successful clinical trials and favorable regulatory outcomes for new treatments will accelerate market expansion and contribute to significant revenue generation within this niche but critical therapeutic area.

Pompe Disease Treatment Industry Market Report: 2019-2033
This comprehensive report provides a detailed analysis of the Pompe Disease Treatment industry, encompassing market dynamics, growth trends, competitive landscape, and future outlook. The study period covers 2019-2033, with a base year of 2025 and a forecast period of 2025-2033. The report is essential for industry professionals, investors, and researchers seeking a deep understanding of this rapidly evolving market. The parent market is the Rare Disease Treatment market, while the child market is specifically Pompe Disease therapies.
Pompe Disease Treatment Industry Market Dynamics & Structure
The Pompe Disease Treatment market is characterized by a moderately concentrated landscape with key players such as Astellas Pharma, Amicus Therapeutics, and Sanofi holding significant market share. Technological innovation, particularly in Enzyme Replacement Therapy (ERT) and Substrate Reduction Therapy (SRT), is a major driver, alongside the increasing prevalence of Pompe disease and growing awareness among healthcare professionals. Stringent regulatory frameworks govern the approval and marketing of new treatments. The market also faces competition from emerging therapies and potential substitutes. Mergers and acquisitions (M&A) activity has been moderate, with xx deals recorded between 2019 and 2024, reflecting strategic consolidation within the industry.
- Market Concentration: Moderately concentrated, with top 3 players holding xx% market share in 2024.
- Technological Innovation: Focus on ERT advancements and SRT development.
- Regulatory Landscape: Stringent approvals processes impacting market entry.
- Competitive Substitutes: Emerging therapies and potential alternative treatments pose a challenge.
- M&A Activity: xx deals recorded between 2019-2024, driven by strategic consolidation.
- End-User Demographics: Primarily hospitals and specialized centers.
Pompe Disease Treatment Industry Growth Trends & Insights
The Pompe Disease Treatment market is projected to experience significant growth during the forecast period, driven by several factors. The increasing prevalence of Pompe disease globally contributes to higher demand for effective therapies. Technological advancements, particularly in ERT and SRT, are expanding treatment options and improving patient outcomes. Growing awareness among healthcare professionals and patients is leading to increased diagnosis and treatment rates. The market experienced a CAGR of xx% during the historical period (2019-2024) and is projected to maintain a CAGR of xx% between 2025 and 2033. Market penetration for ERT is estimated to reach xx% by 2033, driven by improved efficacy and accessibility. Technological disruptions, such as the development of novel drug delivery systems, are also expected to impact market growth positively. Changes in consumer behavior, such as increased patient advocacy, may drive adoption of new treatment modalities.
Dominant Regions, Countries, or Segments in Pompe Disease Treatment Industry
North America currently dominates the Pompe Disease Treatment market, accounting for xx% of global revenue in 2024, followed by Europe at xx%. This dominance is attributed to factors such as higher healthcare expenditure, advanced healthcare infrastructure, and strong regulatory support. Within the segments, Enzyme Replacement Therapy (ERT) holds the largest market share (xx%) due to its established efficacy and wider availability compared to Substrate Reduction Therapy (SRT). Hospitals constitute the largest end-user segment (xx%), reflecting the specialized care required for Pompe disease management.
- Key Drivers: High healthcare expenditure, developed healthcare infrastructure, strong regulatory support in North America and Europe.
- Dominant Segments: ERT (Treatment Type) and Hospitals (End-User).
- Growth Potential: Emerging markets in Asia-Pacific offer significant growth opportunities.
Pompe Disease Treatment Industry Product Landscape
The Pompe Disease Treatment market features a range of ERT and SRT products, each with unique characteristics and therapeutic benefits. Innovations focus on improving drug delivery systems, enhancing efficacy, and reducing side effects. Recent advancements include the introduction of next-generation ERT formulations with improved pharmacokinetic profiles, leading to enhanced patient outcomes. The focus is shifting towards personalized medicine, tailoring treatment approaches to individual patient needs.
Key Drivers, Barriers & Challenges in Pompe Disease Treatment Industry
Key Drivers:
- Increasing prevalence of Pompe disease.
- Advancements in ERT and SRT technologies.
- Growing awareness and improved diagnostics.
Challenges & Restraints:
- High treatment costs limiting accessibility.
- Complex regulatory pathways hindering market entry.
- Potential side effects of current therapies. The high cost of treatment, estimated at $XX million per patient annually for ERT, significantly impacts affordability and market penetration. Regulatory hurdles and lengthy approval processes also hinder the introduction of new therapies.
Emerging Opportunities in Pompe Disease Treatment Industry
Emerging opportunities lie in the development of novel therapies, including gene therapy and gene editing approaches. Untapped markets in developing countries with high disease burden also present significant growth potential. Furthermore, focus on personalized medicine and biomarker-driven treatment strategies presents promising avenues.
Growth Accelerators in the Pompe Disease Treatment Industry
Long-term growth will be fueled by continued research and development, leading to more effective and accessible treatments. Strategic partnerships between pharmaceutical companies and research institutions are accelerating innovation. Expansion into emerging markets will also contribute significantly to future growth. The development of more affordable therapies will increase accessibility and positively impact the market's growth trajectory.
Key Players Shaping the Pompe Disease Treatment Industry Market
- Astellas Pharma
- Amicus Therapeutics
- Sanofi
- EpiVax Inc
- AVROBIO Inc
- Genethon
- Oxyrane
Notable Milestones in Pompe Disease Treatment Industry Sector
- June 2022: European Commission approves Nexvia Dyme (alglucosidase alfa) for Pompe disease treatment. This significantly expands treatment options.
- February 2022: Maze Therapeutics reports preclinical data supporting MZE001, a novel approach to reduce glycogen accumulation. This indicates potential for a new therapeutic modality.
In-Depth Pompe Disease Treatment Industry Market Outlook
The Pompe Disease Treatment market is poised for substantial growth, driven by ongoing innovation and unmet medical needs. Strategic partnerships and investments in R&D will further accelerate market expansion. Focusing on expanding access to affordable therapies in underserved regions will be key to unlocking the market's full potential. The continued development of novel treatment modalities offers significant opportunities for future growth and improved patient outcomes.
Pompe Disease Treatment Industry Segmentation
-
1. Route of Administration
- 1.1. Oral
- 1.2. Parenteral
-
2. Treatment Type
- 2.1. Substrate Reduction Therapy (SRT)
- 2.2. Enzyme Replacement Therapy (ERT)
- 2.3. Other Treatment Types
-
3. End-User
- 3.1. Hospitals
- 3.2. Ambulatory Surgical Centers
- 3.3. Other End-Users
Pompe Disease Treatment Industry Segmentation By Geography
-
1. North America
- 1.1. United States
- 1.2. Canada
- 1.3. Mexico
-
2. Europe
- 2.1. Germany
- 2.2. United Kingdom
- 2.3. France
- 2.4. Italy
- 2.5. Spain
- 2.6. Rest of Europe
-
3. Asia Pacific
- 3.1. China
- 3.2. Japan
- 3.3. India
- 3.4. Australia
- 3.5. South Korea
- 3.6. Rest of Asia Pacific
-
4. Middle East and Africa
- 4.1. GCC
- 4.2. South Africa
- 4.3. Rest of Middle East and Africa
-
5. South America
- 5.1. Brazil
- 5.2. Argentina
- 5.3. Rest of South America

Pompe Disease Treatment Industry REPORT HIGHLIGHTS
| Aspects | Details |
|---|---|
| Study Period | 2019-2033 |
| Base Year | 2024 |
| Estimated Year | 2025 |
| Forecast Period | 2025-2033 |
| Historical Period | 2019-2024 |
| Growth Rate | CAGR of 4.50% from 2019-2033 |
| Segmentation |
|
Table of Contents
- 1. Introduction
- 1.1. Research Scope
- 1.2. Market Segmentation
- 1.3. Research Methodology
- 1.4. Definitions and Assumptions
- 2. Executive Summary
- 2.1. Introduction
- 3. Market Dynamics
- 3.1. Introduction
- 3.2. Market Drivers
- 3.2.1. Launch of Novel Drugs; Continued Uptake of Long Term Therapies
- 3.3. Market Restrains
- 3.3.1. High Treatment Cost
- 3.4. Market Trends
- 3.4.1. Enzyme Replacement Therapy (ERT) Segment is Estimated to Witness a Considerable Growth Over the Forecast Period
- 4. Market Factor Analysis
- 4.1. Porters Five Forces
- 4.2. Supply/Value Chain
- 4.3. PESTEL analysis
- 4.4. Market Entropy
- 4.5. Patent/Trademark Analysis
- 5. Global Pompe Disease Treatment Industry Analysis, Insights and Forecast, 2019-2031
- 5.1. Market Analysis, Insights and Forecast - by Route of Administration
- 5.1.1. Oral
- 5.1.2. Parenteral
- 5.2. Market Analysis, Insights and Forecast - by Treatment Type
- 5.2.1. Substrate Reduction Therapy (SRT)
- 5.2.2. Enzyme Replacement Therapy (ERT)
- 5.2.3. Other Treatment Types
- 5.3. Market Analysis, Insights and Forecast - by End-User
- 5.3.1. Hospitals
- 5.3.2. Ambulatory Surgical Centers
- 5.3.3. Other End-Users
- 5.4. Market Analysis, Insights and Forecast - by Region
- 5.4.1. North America
- 5.4.2. Europe
- 5.4.3. Asia Pacific
- 5.4.4. Middle East and Africa
- 5.4.5. South America
- 5.1. Market Analysis, Insights and Forecast - by Route of Administration
- 6. North America Pompe Disease Treatment Industry Analysis, Insights and Forecast, 2019-2031
- 6.1. Market Analysis, Insights and Forecast - by Route of Administration
- 6.1.1. Oral
- 6.1.2. Parenteral
- 6.2. Market Analysis, Insights and Forecast - by Treatment Type
- 6.2.1. Substrate Reduction Therapy (SRT)
- 6.2.2. Enzyme Replacement Therapy (ERT)
- 6.2.3. Other Treatment Types
- 6.3. Market Analysis, Insights and Forecast - by End-User
- 6.3.1. Hospitals
- 6.3.2. Ambulatory Surgical Centers
- 6.3.3. Other End-Users
- 6.1. Market Analysis, Insights and Forecast - by Route of Administration
- 7. Europe Pompe Disease Treatment Industry Analysis, Insights and Forecast, 2019-2031
- 7.1. Market Analysis, Insights and Forecast - by Route of Administration
- 7.1.1. Oral
- 7.1.2. Parenteral
- 7.2. Market Analysis, Insights and Forecast - by Treatment Type
- 7.2.1. Substrate Reduction Therapy (SRT)
- 7.2.2. Enzyme Replacement Therapy (ERT)
- 7.2.3. Other Treatment Types
- 7.3. Market Analysis, Insights and Forecast - by End-User
- 7.3.1. Hospitals
- 7.3.2. Ambulatory Surgical Centers
- 7.3.3. Other End-Users
- 7.1. Market Analysis, Insights and Forecast - by Route of Administration
- 8. Asia Pacific Pompe Disease Treatment Industry Analysis, Insights and Forecast, 2019-2031
- 8.1. Market Analysis, Insights and Forecast - by Route of Administration
- 8.1.1. Oral
- 8.1.2. Parenteral
- 8.2. Market Analysis, Insights and Forecast - by Treatment Type
- 8.2.1. Substrate Reduction Therapy (SRT)
- 8.2.2. Enzyme Replacement Therapy (ERT)
- 8.2.3. Other Treatment Types
- 8.3. Market Analysis, Insights and Forecast - by End-User
- 8.3.1. Hospitals
- 8.3.2. Ambulatory Surgical Centers
- 8.3.3. Other End-Users
- 8.1. Market Analysis, Insights and Forecast - by Route of Administration
- 9. Middle East and Africa Pompe Disease Treatment Industry Analysis, Insights and Forecast, 2019-2031
- 9.1. Market Analysis, Insights and Forecast - by Route of Administration
- 9.1.1. Oral
- 9.1.2. Parenteral
- 9.2. Market Analysis, Insights and Forecast - by Treatment Type
- 9.2.1. Substrate Reduction Therapy (SRT)
- 9.2.2. Enzyme Replacement Therapy (ERT)
- 9.2.3. Other Treatment Types
- 9.3. Market Analysis, Insights and Forecast - by End-User
- 9.3.1. Hospitals
- 9.3.2. Ambulatory Surgical Centers
- 9.3.3. Other End-Users
- 9.1. Market Analysis, Insights and Forecast - by Route of Administration
- 10. South America Pompe Disease Treatment Industry Analysis, Insights and Forecast, 2019-2031
- 10.1. Market Analysis, Insights and Forecast - by Route of Administration
- 10.1.1. Oral
- 10.1.2. Parenteral
- 10.2. Market Analysis, Insights and Forecast - by Treatment Type
- 10.2.1. Substrate Reduction Therapy (SRT)
- 10.2.2. Enzyme Replacement Therapy (ERT)
- 10.2.3. Other Treatment Types
- 10.3. Market Analysis, Insights and Forecast - by End-User
- 10.3.1. Hospitals
- 10.3.2. Ambulatory Surgical Centers
- 10.3.3. Other End-Users
- 10.1. Market Analysis, Insights and Forecast - by Route of Administration
- 11. North America Pompe Disease Treatment Industry Analysis, Insights and Forecast, 2019-2031
- 11.1. Market Analysis, Insights and Forecast - By Country/Sub-region
- 11.1.1 United States
- 11.1.2 Canada
- 11.1.3 Mexico
- 12. Europe Pompe Disease Treatment Industry Analysis, Insights and Forecast, 2019-2031
- 12.1. Market Analysis, Insights and Forecast - By Country/Sub-region
- 12.1.1 Germany
- 12.1.2 United Kingdom
- 12.1.3 France
- 12.1.4 Italy
- 12.1.5 Spain
- 12.1.6 Rest of Europe
- 13. Asia Pacific Pompe Disease Treatment Industry Analysis, Insights and Forecast, 2019-2031
- 13.1. Market Analysis, Insights and Forecast - By Country/Sub-region
- 13.1.1 China
- 13.1.2 Japan
- 13.1.3 India
- 13.1.4 Australia
- 13.1.5 South Korea
- 13.1.6 Rest of Asia Pacific
- 14. Middle East and Africa Pompe Disease Treatment Industry Analysis, Insights and Forecast, 2019-2031
- 14.1. Market Analysis, Insights and Forecast - By Country/Sub-region
- 14.1.1 GCC
- 14.1.2 South Africa
- 14.1.3 Rest of Middle East and Africa
- 15. South America Pompe Disease Treatment Industry Analysis, Insights and Forecast, 2019-2031
- 15.1. Market Analysis, Insights and Forecast - By Country/Sub-region
- 15.1.1 Brazil
- 15.1.2 Argentina
- 15.1.3 Rest of South America
- 16. Competitive Analysis
- 16.1. Global Market Share Analysis 2024
- 16.2. Company Profiles
- 16.2.1 Astellas Pharma
- 16.2.1.1. Overview
- 16.2.1.2. Products
- 16.2.1.3. SWOT Analysis
- 16.2.1.4. Recent Developments
- 16.2.1.5. Financials (Based on Availability)
- 16.2.2 Amicus Therapeutics
- 16.2.2.1. Overview
- 16.2.2.2. Products
- 16.2.2.3. SWOT Analysis
- 16.2.2.4. Recent Developments
- 16.2.2.5. Financials (Based on Availability)
- 16.2.3 Sanofi
- 16.2.3.1. Overview
- 16.2.3.2. Products
- 16.2.3.3. SWOT Analysis
- 16.2.3.4. Recent Developments
- 16.2.3.5. Financials (Based on Availability)
- 16.2.4 EpiVax Inc
- 16.2.4.1. Overview
- 16.2.4.2. Products
- 16.2.4.3. SWOT Analysis
- 16.2.4.4. Recent Developments
- 16.2.4.5. Financials (Based on Availability)
- 16.2.5 AVROBIO Inc
- 16.2.5.1. Overview
- 16.2.5.2. Products
- 16.2.5.3. SWOT Analysis
- 16.2.5.4. Recent Developments
- 16.2.5.5. Financials (Based on Availability)
- 16.2.6 Genethon
- 16.2.6.1. Overview
- 16.2.6.2. Products
- 16.2.6.3. SWOT Analysis
- 16.2.6.4. Recent Developments
- 16.2.6.5. Financials (Based on Availability)
- 16.2.7 Oxyrane
- 16.2.7.1. Overview
- 16.2.7.2. Products
- 16.2.7.3. SWOT Analysis
- 16.2.7.4. Recent Developments
- 16.2.7.5. Financials (Based on Availability)
- 16.2.1 Astellas Pharma
List of Figures
- Figure 1: Global Pompe Disease Treatment Industry Revenue Breakdown (Million, %) by Region 2024 & 2032
- Figure 2: Global Pompe Disease Treatment Industry Volume Breakdown (K Unit, %) by Region 2024 & 2032
- Figure 3: North America Pompe Disease Treatment Industry Revenue (Million), by Country 2024 & 2032
- Figure 4: North America Pompe Disease Treatment Industry Volume (K Unit), by Country 2024 & 2032
- Figure 5: North America Pompe Disease Treatment Industry Revenue Share (%), by Country 2024 & 2032
- Figure 6: North America Pompe Disease Treatment Industry Volume Share (%), by Country 2024 & 2032
- Figure 7: Europe Pompe Disease Treatment Industry Revenue (Million), by Country 2024 & 2032
- Figure 8: Europe Pompe Disease Treatment Industry Volume (K Unit), by Country 2024 & 2032
- Figure 9: Europe Pompe Disease Treatment Industry Revenue Share (%), by Country 2024 & 2032
- Figure 10: Europe Pompe Disease Treatment Industry Volume Share (%), by Country 2024 & 2032
- Figure 11: Asia Pacific Pompe Disease Treatment Industry Revenue (Million), by Country 2024 & 2032
- Figure 12: Asia Pacific Pompe Disease Treatment Industry Volume (K Unit), by Country 2024 & 2032
- Figure 13: Asia Pacific Pompe Disease Treatment Industry Revenue Share (%), by Country 2024 & 2032
- Figure 14: Asia Pacific Pompe Disease Treatment Industry Volume Share (%), by Country 2024 & 2032
- Figure 15: Middle East and Africa Pompe Disease Treatment Industry Revenue (Million), by Country 2024 & 2032
- Figure 16: Middle East and Africa Pompe Disease Treatment Industry Volume (K Unit), by Country 2024 & 2032
- Figure 17: Middle East and Africa Pompe Disease Treatment Industry Revenue Share (%), by Country 2024 & 2032
- Figure 18: Middle East and Africa Pompe Disease Treatment Industry Volume Share (%), by Country 2024 & 2032
- Figure 19: South America Pompe Disease Treatment Industry Revenue (Million), by Country 2024 & 2032
- Figure 20: South America Pompe Disease Treatment Industry Volume (K Unit), by Country 2024 & 2032
- Figure 21: South America Pompe Disease Treatment Industry Revenue Share (%), by Country 2024 & 2032
- Figure 22: South America Pompe Disease Treatment Industry Volume Share (%), by Country 2024 & 2032
- Figure 23: North America Pompe Disease Treatment Industry Revenue (Million), by Route of Administration 2024 & 2032
- Figure 24: North America Pompe Disease Treatment Industry Volume (K Unit), by Route of Administration 2024 & 2032
- Figure 25: North America Pompe Disease Treatment Industry Revenue Share (%), by Route of Administration 2024 & 2032
- Figure 26: North America Pompe Disease Treatment Industry Volume Share (%), by Route of Administration 2024 & 2032
- Figure 27: North America Pompe Disease Treatment Industry Revenue (Million), by Treatment Type 2024 & 2032
- Figure 28: North America Pompe Disease Treatment Industry Volume (K Unit), by Treatment Type 2024 & 2032
- Figure 29: North America Pompe Disease Treatment Industry Revenue Share (%), by Treatment Type 2024 & 2032
- Figure 30: North America Pompe Disease Treatment Industry Volume Share (%), by Treatment Type 2024 & 2032
- Figure 31: North America Pompe Disease Treatment Industry Revenue (Million), by End-User 2024 & 2032
- Figure 32: North America Pompe Disease Treatment Industry Volume (K Unit), by End-User 2024 & 2032
- Figure 33: North America Pompe Disease Treatment Industry Revenue Share (%), by End-User 2024 & 2032
- Figure 34: North America Pompe Disease Treatment Industry Volume Share (%), by End-User 2024 & 2032
- Figure 35: North America Pompe Disease Treatment Industry Revenue (Million), by Country 2024 & 2032
- Figure 36: North America Pompe Disease Treatment Industry Volume (K Unit), by Country 2024 & 2032
- Figure 37: North America Pompe Disease Treatment Industry Revenue Share (%), by Country 2024 & 2032
- Figure 38: North America Pompe Disease Treatment Industry Volume Share (%), by Country 2024 & 2032
- Figure 39: Europe Pompe Disease Treatment Industry Revenue (Million), by Route of Administration 2024 & 2032
- Figure 40: Europe Pompe Disease Treatment Industry Volume (K Unit), by Route of Administration 2024 & 2032
- Figure 41: Europe Pompe Disease Treatment Industry Revenue Share (%), by Route of Administration 2024 & 2032
- Figure 42: Europe Pompe Disease Treatment Industry Volume Share (%), by Route of Administration 2024 & 2032
- Figure 43: Europe Pompe Disease Treatment Industry Revenue (Million), by Treatment Type 2024 & 2032
- Figure 44: Europe Pompe Disease Treatment Industry Volume (K Unit), by Treatment Type 2024 & 2032
- Figure 45: Europe Pompe Disease Treatment Industry Revenue Share (%), by Treatment Type 2024 & 2032
- Figure 46: Europe Pompe Disease Treatment Industry Volume Share (%), by Treatment Type 2024 & 2032
- Figure 47: Europe Pompe Disease Treatment Industry Revenue (Million), by End-User 2024 & 2032
- Figure 48: Europe Pompe Disease Treatment Industry Volume (K Unit), by End-User 2024 & 2032
- Figure 49: Europe Pompe Disease Treatment Industry Revenue Share (%), by End-User 2024 & 2032
- Figure 50: Europe Pompe Disease Treatment Industry Volume Share (%), by End-User 2024 & 2032
- Figure 51: Europe Pompe Disease Treatment Industry Revenue (Million), by Country 2024 & 2032
- Figure 52: Europe Pompe Disease Treatment Industry Volume (K Unit), by Country 2024 & 2032
- Figure 53: Europe Pompe Disease Treatment Industry Revenue Share (%), by Country 2024 & 2032
- Figure 54: Europe Pompe Disease Treatment Industry Volume Share (%), by Country 2024 & 2032
- Figure 55: Asia Pacific Pompe Disease Treatment Industry Revenue (Million), by Route of Administration 2024 & 2032
- Figure 56: Asia Pacific Pompe Disease Treatment Industry Volume (K Unit), by Route of Administration 2024 & 2032
- Figure 57: Asia Pacific Pompe Disease Treatment Industry Revenue Share (%), by Route of Administration 2024 & 2032
- Figure 58: Asia Pacific Pompe Disease Treatment Industry Volume Share (%), by Route of Administration 2024 & 2032
- Figure 59: Asia Pacific Pompe Disease Treatment Industry Revenue (Million), by Treatment Type 2024 & 2032
- Figure 60: Asia Pacific Pompe Disease Treatment Industry Volume (K Unit), by Treatment Type 2024 & 2032
- Figure 61: Asia Pacific Pompe Disease Treatment Industry Revenue Share (%), by Treatment Type 2024 & 2032
- Figure 62: Asia Pacific Pompe Disease Treatment Industry Volume Share (%), by Treatment Type 2024 & 2032
- Figure 63: Asia Pacific Pompe Disease Treatment Industry Revenue (Million), by End-User 2024 & 2032
- Figure 64: Asia Pacific Pompe Disease Treatment Industry Volume (K Unit), by End-User 2024 & 2032
- Figure 65: Asia Pacific Pompe Disease Treatment Industry Revenue Share (%), by End-User 2024 & 2032
- Figure 66: Asia Pacific Pompe Disease Treatment Industry Volume Share (%), by End-User 2024 & 2032
- Figure 67: Asia Pacific Pompe Disease Treatment Industry Revenue (Million), by Country 2024 & 2032
- Figure 68: Asia Pacific Pompe Disease Treatment Industry Volume (K Unit), by Country 2024 & 2032
- Figure 69: Asia Pacific Pompe Disease Treatment Industry Revenue Share (%), by Country 2024 & 2032
- Figure 70: Asia Pacific Pompe Disease Treatment Industry Volume Share (%), by Country 2024 & 2032
- Figure 71: Middle East and Africa Pompe Disease Treatment Industry Revenue (Million), by Route of Administration 2024 & 2032
- Figure 72: Middle East and Africa Pompe Disease Treatment Industry Volume (K Unit), by Route of Administration 2024 & 2032
- Figure 73: Middle East and Africa Pompe Disease Treatment Industry Revenue Share (%), by Route of Administration 2024 & 2032
- Figure 74: Middle East and Africa Pompe Disease Treatment Industry Volume Share (%), by Route of Administration 2024 & 2032
- Figure 75: Middle East and Africa Pompe Disease Treatment Industry Revenue (Million), by Treatment Type 2024 & 2032
- Figure 76: Middle East and Africa Pompe Disease Treatment Industry Volume (K Unit), by Treatment Type 2024 & 2032
- Figure 77: Middle East and Africa Pompe Disease Treatment Industry Revenue Share (%), by Treatment Type 2024 & 2032
- Figure 78: Middle East and Africa Pompe Disease Treatment Industry Volume Share (%), by Treatment Type 2024 & 2032
- Figure 79: Middle East and Africa Pompe Disease Treatment Industry Revenue (Million), by End-User 2024 & 2032
- Figure 80: Middle East and Africa Pompe Disease Treatment Industry Volume (K Unit), by End-User 2024 & 2032
- Figure 81: Middle East and Africa Pompe Disease Treatment Industry Revenue Share (%), by End-User 2024 & 2032
- Figure 82: Middle East and Africa Pompe Disease Treatment Industry Volume Share (%), by End-User 2024 & 2032
- Figure 83: Middle East and Africa Pompe Disease Treatment Industry Revenue (Million), by Country 2024 & 2032
- Figure 84: Middle East and Africa Pompe Disease Treatment Industry Volume (K Unit), by Country 2024 & 2032
- Figure 85: Middle East and Africa Pompe Disease Treatment Industry Revenue Share (%), by Country 2024 & 2032
- Figure 86: Middle East and Africa Pompe Disease Treatment Industry Volume Share (%), by Country 2024 & 2032
- Figure 87: South America Pompe Disease Treatment Industry Revenue (Million), by Route of Administration 2024 & 2032
- Figure 88: South America Pompe Disease Treatment Industry Volume (K Unit), by Route of Administration 2024 & 2032
- Figure 89: South America Pompe Disease Treatment Industry Revenue Share (%), by Route of Administration 2024 & 2032
- Figure 90: South America Pompe Disease Treatment Industry Volume Share (%), by Route of Administration 2024 & 2032
- Figure 91: South America Pompe Disease Treatment Industry Revenue (Million), by Treatment Type 2024 & 2032
- Figure 92: South America Pompe Disease Treatment Industry Volume (K Unit), by Treatment Type 2024 & 2032
- Figure 93: South America Pompe Disease Treatment Industry Revenue Share (%), by Treatment Type 2024 & 2032
- Figure 94: South America Pompe Disease Treatment Industry Volume Share (%), by Treatment Type 2024 & 2032
- Figure 95: South America Pompe Disease Treatment Industry Revenue (Million), by End-User 2024 & 2032
- Figure 96: South America Pompe Disease Treatment Industry Volume (K Unit), by End-User 2024 & 2032
- Figure 97: South America Pompe Disease Treatment Industry Revenue Share (%), by End-User 2024 & 2032
- Figure 98: South America Pompe Disease Treatment Industry Volume Share (%), by End-User 2024 & 2032
- Figure 99: South America Pompe Disease Treatment Industry Revenue (Million), by Country 2024 & 2032
- Figure 100: South America Pompe Disease Treatment Industry Volume (K Unit), by Country 2024 & 2032
- Figure 101: South America Pompe Disease Treatment Industry Revenue Share (%), by Country 2024 & 2032
- Figure 102: South America Pompe Disease Treatment Industry Volume Share (%), by Country 2024 & 2032
List of Tables
- Table 1: Global Pompe Disease Treatment Industry Revenue Million Forecast, by Region 2019 & 2032
- Table 2: Global Pompe Disease Treatment Industry Volume K Unit Forecast, by Region 2019 & 2032
- Table 3: Global Pompe Disease Treatment Industry Revenue Million Forecast, by Route of Administration 2019 & 2032
- Table 4: Global Pompe Disease Treatment Industry Volume K Unit Forecast, by Route of Administration 2019 & 2032
- Table 5: Global Pompe Disease Treatment Industry Revenue Million Forecast, by Treatment Type 2019 & 2032
- Table 6: Global Pompe Disease Treatment Industry Volume K Unit Forecast, by Treatment Type 2019 & 2032
- Table 7: Global Pompe Disease Treatment Industry Revenue Million Forecast, by End-User 2019 & 2032
- Table 8: Global Pompe Disease Treatment Industry Volume K Unit Forecast, by End-User 2019 & 2032
- Table 9: Global Pompe Disease Treatment Industry Revenue Million Forecast, by Region 2019 & 2032
- Table 10: Global Pompe Disease Treatment Industry Volume K Unit Forecast, by Region 2019 & 2032
- Table 11: Global Pompe Disease Treatment Industry Revenue Million Forecast, by Country 2019 & 2032
- Table 12: Global Pompe Disease Treatment Industry Volume K Unit Forecast, by Country 2019 & 2032
- Table 13: United States Pompe Disease Treatment Industry Revenue (Million) Forecast, by Application 2019 & 2032
- Table 14: United States Pompe Disease Treatment Industry Volume (K Unit) Forecast, by Application 2019 & 2032
- Table 15: Canada Pompe Disease Treatment Industry Revenue (Million) Forecast, by Application 2019 & 2032
- Table 16: Canada Pompe Disease Treatment Industry Volume (K Unit) Forecast, by Application 2019 & 2032
- Table 17: Mexico Pompe Disease Treatment Industry Revenue (Million) Forecast, by Application 2019 & 2032
- Table 18: Mexico Pompe Disease Treatment Industry Volume (K Unit) Forecast, by Application 2019 & 2032
- Table 19: Global Pompe Disease Treatment Industry Revenue Million Forecast, by Country 2019 & 2032
- Table 20: Global Pompe Disease Treatment Industry Volume K Unit Forecast, by Country 2019 & 2032
- Table 21: Germany Pompe Disease Treatment Industry Revenue (Million) Forecast, by Application 2019 & 2032
- Table 22: Germany Pompe Disease Treatment Industry Volume (K Unit) Forecast, by Application 2019 & 2032
- Table 23: United Kingdom Pompe Disease Treatment Industry Revenue (Million) Forecast, by Application 2019 & 2032
- Table 24: United Kingdom Pompe Disease Treatment Industry Volume (K Unit) Forecast, by Application 2019 & 2032
- Table 25: France Pompe Disease Treatment Industry Revenue (Million) Forecast, by Application 2019 & 2032
- Table 26: France Pompe Disease Treatment Industry Volume (K Unit) Forecast, by Application 2019 & 2032
- Table 27: Italy Pompe Disease Treatment Industry Revenue (Million) Forecast, by Application 2019 & 2032
- Table 28: Italy Pompe Disease Treatment Industry Volume (K Unit) Forecast, by Application 2019 & 2032
- Table 29: Spain Pompe Disease Treatment Industry Revenue (Million) Forecast, by Application 2019 & 2032
- Table 30: Spain Pompe Disease Treatment Industry Volume (K Unit) Forecast, by Application 2019 & 2032
- Table 31: Rest of Europe Pompe Disease Treatment Industry Revenue (Million) Forecast, by Application 2019 & 2032
- Table 32: Rest of Europe Pompe Disease Treatment Industry Volume (K Unit) Forecast, by Application 2019 & 2032
- Table 33: Global Pompe Disease Treatment Industry Revenue Million Forecast, by Country 2019 & 2032
- Table 34: Global Pompe Disease Treatment Industry Volume K Unit Forecast, by Country 2019 & 2032
- Table 35: China Pompe Disease Treatment Industry Revenue (Million) Forecast, by Application 2019 & 2032
- Table 36: China Pompe Disease Treatment Industry Volume (K Unit) Forecast, by Application 2019 & 2032
- Table 37: Japan Pompe Disease Treatment Industry Revenue (Million) Forecast, by Application 2019 & 2032
- Table 38: Japan Pompe Disease Treatment Industry Volume (K Unit) Forecast, by Application 2019 & 2032
- Table 39: India Pompe Disease Treatment Industry Revenue (Million) Forecast, by Application 2019 & 2032
- Table 40: India Pompe Disease Treatment Industry Volume (K Unit) Forecast, by Application 2019 & 2032
- Table 41: Australia Pompe Disease Treatment Industry Revenue (Million) Forecast, by Application 2019 & 2032
- Table 42: Australia Pompe Disease Treatment Industry Volume (K Unit) Forecast, by Application 2019 & 2032
- Table 43: South Korea Pompe Disease Treatment Industry Revenue (Million) Forecast, by Application 2019 & 2032
- Table 44: South Korea Pompe Disease Treatment Industry Volume (K Unit) Forecast, by Application 2019 & 2032
- Table 45: Rest of Asia Pacific Pompe Disease Treatment Industry Revenue (Million) Forecast, by Application 2019 & 2032
- Table 46: Rest of Asia Pacific Pompe Disease Treatment Industry Volume (K Unit) Forecast, by Application 2019 & 2032
- Table 47: Global Pompe Disease Treatment Industry Revenue Million Forecast, by Country 2019 & 2032
- Table 48: Global Pompe Disease Treatment Industry Volume K Unit Forecast, by Country 2019 & 2032
- Table 49: GCC Pompe Disease Treatment Industry Revenue (Million) Forecast, by Application 2019 & 2032
- Table 50: GCC Pompe Disease Treatment Industry Volume (K Unit) Forecast, by Application 2019 & 2032
- Table 51: South Africa Pompe Disease Treatment Industry Revenue (Million) Forecast, by Application 2019 & 2032
- Table 52: South Africa Pompe Disease Treatment Industry Volume (K Unit) Forecast, by Application 2019 & 2032
- Table 53: Rest of Middle East and Africa Pompe Disease Treatment Industry Revenue (Million) Forecast, by Application 2019 & 2032
- Table 54: Rest of Middle East and Africa Pompe Disease Treatment Industry Volume (K Unit) Forecast, by Application 2019 & 2032
- Table 55: Global Pompe Disease Treatment Industry Revenue Million Forecast, by Country 2019 & 2032
- Table 56: Global Pompe Disease Treatment Industry Volume K Unit Forecast, by Country 2019 & 2032
- Table 57: Brazil Pompe Disease Treatment Industry Revenue (Million) Forecast, by Application 2019 & 2032
- Table 58: Brazil Pompe Disease Treatment Industry Volume (K Unit) Forecast, by Application 2019 & 2032
- Table 59: Argentina Pompe Disease Treatment Industry Revenue (Million) Forecast, by Application 2019 & 2032
- Table 60: Argentina Pompe Disease Treatment Industry Volume (K Unit) Forecast, by Application 2019 & 2032
- Table 61: Rest of South America Pompe Disease Treatment Industry Revenue (Million) Forecast, by Application 2019 & 2032
- Table 62: Rest of South America Pompe Disease Treatment Industry Volume (K Unit) Forecast, by Application 2019 & 2032
- Table 63: Global Pompe Disease Treatment Industry Revenue Million Forecast, by Route of Administration 2019 & 2032
- Table 64: Global Pompe Disease Treatment Industry Volume K Unit Forecast, by Route of Administration 2019 & 2032
- Table 65: Global Pompe Disease Treatment Industry Revenue Million Forecast, by Treatment Type 2019 & 2032
- Table 66: Global Pompe Disease Treatment Industry Volume K Unit Forecast, by Treatment Type 2019 & 2032
- Table 67: Global Pompe Disease Treatment Industry Revenue Million Forecast, by End-User 2019 & 2032
- Table 68: Global Pompe Disease Treatment Industry Volume K Unit Forecast, by End-User 2019 & 2032
- Table 69: Global Pompe Disease Treatment Industry Revenue Million Forecast, by Country 2019 & 2032
- Table 70: Global Pompe Disease Treatment Industry Volume K Unit Forecast, by Country 2019 & 2032
- Table 71: United States Pompe Disease Treatment Industry Revenue (Million) Forecast, by Application 2019 & 2032
- Table 72: United States Pompe Disease Treatment Industry Volume (K Unit) Forecast, by Application 2019 & 2032
- Table 73: Canada Pompe Disease Treatment Industry Revenue (Million) Forecast, by Application 2019 & 2032
- Table 74: Canada Pompe Disease Treatment Industry Volume (K Unit) Forecast, by Application 2019 & 2032
- Table 75: Mexico Pompe Disease Treatment Industry Revenue (Million) Forecast, by Application 2019 & 2032
- Table 76: Mexico Pompe Disease Treatment Industry Volume (K Unit) Forecast, by Application 2019 & 2032
- Table 77: Global Pompe Disease Treatment Industry Revenue Million Forecast, by Route of Administration 2019 & 2032
- Table 78: Global Pompe Disease Treatment Industry Volume K Unit Forecast, by Route of Administration 2019 & 2032
- Table 79: Global Pompe Disease Treatment Industry Revenue Million Forecast, by Treatment Type 2019 & 2032
- Table 80: Global Pompe Disease Treatment Industry Volume K Unit Forecast, by Treatment Type 2019 & 2032
- Table 81: Global Pompe Disease Treatment Industry Revenue Million Forecast, by End-User 2019 & 2032
- Table 82: Global Pompe Disease Treatment Industry Volume K Unit Forecast, by End-User 2019 & 2032
- Table 83: Global Pompe Disease Treatment Industry Revenue Million Forecast, by Country 2019 & 2032
- Table 84: Global Pompe Disease Treatment Industry Volume K Unit Forecast, by Country 2019 & 2032
- Table 85: Germany Pompe Disease Treatment Industry Revenue (Million) Forecast, by Application 2019 & 2032
- Table 86: Germany Pompe Disease Treatment Industry Volume (K Unit) Forecast, by Application 2019 & 2032
- Table 87: United Kingdom Pompe Disease Treatment Industry Revenue (Million) Forecast, by Application 2019 & 2032
- Table 88: United Kingdom Pompe Disease Treatment Industry Volume (K Unit) Forecast, by Application 2019 & 2032
- Table 89: France Pompe Disease Treatment Industry Revenue (Million) Forecast, by Application 2019 & 2032
- Table 90: France Pompe Disease Treatment Industry Volume (K Unit) Forecast, by Application 2019 & 2032
- Table 91: Italy Pompe Disease Treatment Industry Revenue (Million) Forecast, by Application 2019 & 2032
- Table 92: Italy Pompe Disease Treatment Industry Volume (K Unit) Forecast, by Application 2019 & 2032
- Table 93: Spain Pompe Disease Treatment Industry Revenue (Million) Forecast, by Application 2019 & 2032
- Table 94: Spain Pompe Disease Treatment Industry Volume (K Unit) Forecast, by Application 2019 & 2032
- Table 95: Rest of Europe Pompe Disease Treatment Industry Revenue (Million) Forecast, by Application 2019 & 2032
- Table 96: Rest of Europe Pompe Disease Treatment Industry Volume (K Unit) Forecast, by Application 2019 & 2032
- Table 97: Global Pompe Disease Treatment Industry Revenue Million Forecast, by Route of Administration 2019 & 2032
- Table 98: Global Pompe Disease Treatment Industry Volume K Unit Forecast, by Route of Administration 2019 & 2032
- Table 99: Global Pompe Disease Treatment Industry Revenue Million Forecast, by Treatment Type 2019 & 2032
- Table 100: Global Pompe Disease Treatment Industry Volume K Unit Forecast, by Treatment Type 2019 & 2032
- Table 101: Global Pompe Disease Treatment Industry Revenue Million Forecast, by End-User 2019 & 2032
- Table 102: Global Pompe Disease Treatment Industry Volume K Unit Forecast, by End-User 2019 & 2032
- Table 103: Global Pompe Disease Treatment Industry Revenue Million Forecast, by Country 2019 & 2032
- Table 104: Global Pompe Disease Treatment Industry Volume K Unit Forecast, by Country 2019 & 2032
- Table 105: China Pompe Disease Treatment Industry Revenue (Million) Forecast, by Application 2019 & 2032
- Table 106: China Pompe Disease Treatment Industry Volume (K Unit) Forecast, by Application 2019 & 2032
- Table 107: Japan Pompe Disease Treatment Industry Revenue (Million) Forecast, by Application 2019 & 2032
- Table 108: Japan Pompe Disease Treatment Industry Volume (K Unit) Forecast, by Application 2019 & 2032
- Table 109: India Pompe Disease Treatment Industry Revenue (Million) Forecast, by Application 2019 & 2032
- Table 110: India Pompe Disease Treatment Industry Volume (K Unit) Forecast, by Application 2019 & 2032
- Table 111: Australia Pompe Disease Treatment Industry Revenue (Million) Forecast, by Application 2019 & 2032
- Table 112: Australia Pompe Disease Treatment Industry Volume (K Unit) Forecast, by Application 2019 & 2032
- Table 113: South Korea Pompe Disease Treatment Industry Revenue (Million) Forecast, by Application 2019 & 2032
- Table 114: South Korea Pompe Disease Treatment Industry Volume (K Unit) Forecast, by Application 2019 & 2032
- Table 115: Rest of Asia Pacific Pompe Disease Treatment Industry Revenue (Million) Forecast, by Application 2019 & 2032
- Table 116: Rest of Asia Pacific Pompe Disease Treatment Industry Volume (K Unit) Forecast, by Application 2019 & 2032
- Table 117: Global Pompe Disease Treatment Industry Revenue Million Forecast, by Route of Administration 2019 & 2032
- Table 118: Global Pompe Disease Treatment Industry Volume K Unit Forecast, by Route of Administration 2019 & 2032
- Table 119: Global Pompe Disease Treatment Industry Revenue Million Forecast, by Treatment Type 2019 & 2032
- Table 120: Global Pompe Disease Treatment Industry Volume K Unit Forecast, by Treatment Type 2019 & 2032
- Table 121: Global Pompe Disease Treatment Industry Revenue Million Forecast, by End-User 2019 & 2032
- Table 122: Global Pompe Disease Treatment Industry Volume K Unit Forecast, by End-User 2019 & 2032
- Table 123: Global Pompe Disease Treatment Industry Revenue Million Forecast, by Country 2019 & 2032
- Table 124: Global Pompe Disease Treatment Industry Volume K Unit Forecast, by Country 2019 & 2032
- Table 125: GCC Pompe Disease Treatment Industry Revenue (Million) Forecast, by Application 2019 & 2032
- Table 126: GCC Pompe Disease Treatment Industry Volume (K Unit) Forecast, by Application 2019 & 2032
- Table 127: South Africa Pompe Disease Treatment Industry Revenue (Million) Forecast, by Application 2019 & 2032
- Table 128: South Africa Pompe Disease Treatment Industry Volume (K Unit) Forecast, by Application 2019 & 2032
- Table 129: Rest of Middle East and Africa Pompe Disease Treatment Industry Revenue (Million) Forecast, by Application 2019 & 2032
- Table 130: Rest of Middle East and Africa Pompe Disease Treatment Industry Volume (K Unit) Forecast, by Application 2019 & 2032
- Table 131: Global Pompe Disease Treatment Industry Revenue Million Forecast, by Route of Administration 2019 & 2032
- Table 132: Global Pompe Disease Treatment Industry Volume K Unit Forecast, by Route of Administration 2019 & 2032
- Table 133: Global Pompe Disease Treatment Industry Revenue Million Forecast, by Treatment Type 2019 & 2032
- Table 134: Global Pompe Disease Treatment Industry Volume K Unit Forecast, by Treatment Type 2019 & 2032
- Table 135: Global Pompe Disease Treatment Industry Revenue Million Forecast, by End-User 2019 & 2032
- Table 136: Global Pompe Disease Treatment Industry Volume K Unit Forecast, by End-User 2019 & 2032
- Table 137: Global Pompe Disease Treatment Industry Revenue Million Forecast, by Country 2019 & 2032
- Table 138: Global Pompe Disease Treatment Industry Volume K Unit Forecast, by Country 2019 & 2032
- Table 139: Brazil Pompe Disease Treatment Industry Revenue (Million) Forecast, by Application 2019 & 2032
- Table 140: Brazil Pompe Disease Treatment Industry Volume (K Unit) Forecast, by Application 2019 & 2032
- Table 141: Argentina Pompe Disease Treatment Industry Revenue (Million) Forecast, by Application 2019 & 2032
- Table 142: Argentina Pompe Disease Treatment Industry Volume (K Unit) Forecast, by Application 2019 & 2032
- Table 143: Rest of South America Pompe Disease Treatment Industry Revenue (Million) Forecast, by Application 2019 & 2032
- Table 144: Rest of South America Pompe Disease Treatment Industry Volume (K Unit) Forecast, by Application 2019 & 2032
Frequently Asked Questions
1. What is the projected Compound Annual Growth Rate (CAGR) of the Pompe Disease Treatment Industry?
The projected CAGR is approximately 4.50%.
2. Which companies are prominent players in the Pompe Disease Treatment Industry?
Key companies in the market include Astellas Pharma, Amicus Therapeutics, Sanofi, EpiVax Inc, AVROBIO Inc , Genethon, Oxyrane.
3. What are the main segments of the Pompe Disease Treatment Industry?
The market segments include Route of Administration, Treatment Type, End-User.
4. Can you provide details about the market size?
The market size is estimated to be USD XX Million as of 2022.
5. What are some drivers contributing to market growth?
Launch of Novel Drugs; Continued Uptake of Long Term Therapies.
6. What are the notable trends driving market growth?
Enzyme Replacement Therapy (ERT) Segment is Estimated to Witness a Considerable Growth Over the Forecast Period.
7. Are there any restraints impacting market growth?
High Treatment Cost.
8. Can you provide examples of recent developments in the market?
June 2022: The European Commission granted marketing authorization for Nexvia Dyme (alglucosidase alfa), an enzyme replacement therapy (ERT) for the long-term treatment of both late-onset and infantile-onset Pompe disease, a rare, progressive, and debilitating muscle disorder.
9. What pricing options are available for accessing the report?
Pricing options include single-user, multi-user, and enterprise licenses priced at USD 4750, USD 5250, and USD 8750 respectively.
10. Is the market size provided in terms of value or volume?
The market size is provided in terms of value, measured in Million and volume, measured in K Unit.
11. Are there any specific market keywords associated with the report?
Yes, the market keyword associated with the report is "Pompe Disease Treatment Industry," which aids in identifying and referencing the specific market segment covered.
12. How do I determine which pricing option suits my needs best?
The pricing options vary based on user requirements and access needs. Individual users may opt for single-user licenses, while businesses requiring broader access may choose multi-user or enterprise licenses for cost-effective access to the report.
13. Are there any additional resources or data provided in the Pompe Disease Treatment Industry report?
While the report offers comprehensive insights, it's advisable to review the specific contents or supplementary materials provided to ascertain if additional resources or data are available.
14. How can I stay updated on further developments or reports in the Pompe Disease Treatment Industry?
To stay informed about further developments, trends, and reports in the Pompe Disease Treatment Industry, consider subscribing to industry newsletters, following relevant companies and organizations, or regularly checking reputable industry news sources and publications.
Methodology
Step 1 - Identification of Relevant Samples Size from Population Database


Step 2 - Approaches for Defining Global Market Size (Value, Volume* & Price*)

Note*: In applicable scenarios
Step 3 - Data Sources
Primary Research
- Web Analytics
- Survey Reports
- Research Institute
- Latest Research Reports
- Opinion Leaders
Secondary Research
- Annual Reports
- White Paper
- Latest Press Release
- Industry Association
- Paid Database
- Investor Presentations

Step 4 - Data Triangulation
Involves using different sources of information in order to increase the validity of a study
These sources are likely to be stakeholders in a program - participants, other researchers, program staff, other community members, and so on.
Then we put all data in single framework & apply various statistical tools to find out the dynamic on the market.
During the analysis stage, feedback from the stakeholder groups would be compared to determine areas of agreement as well as areas of divergence
