

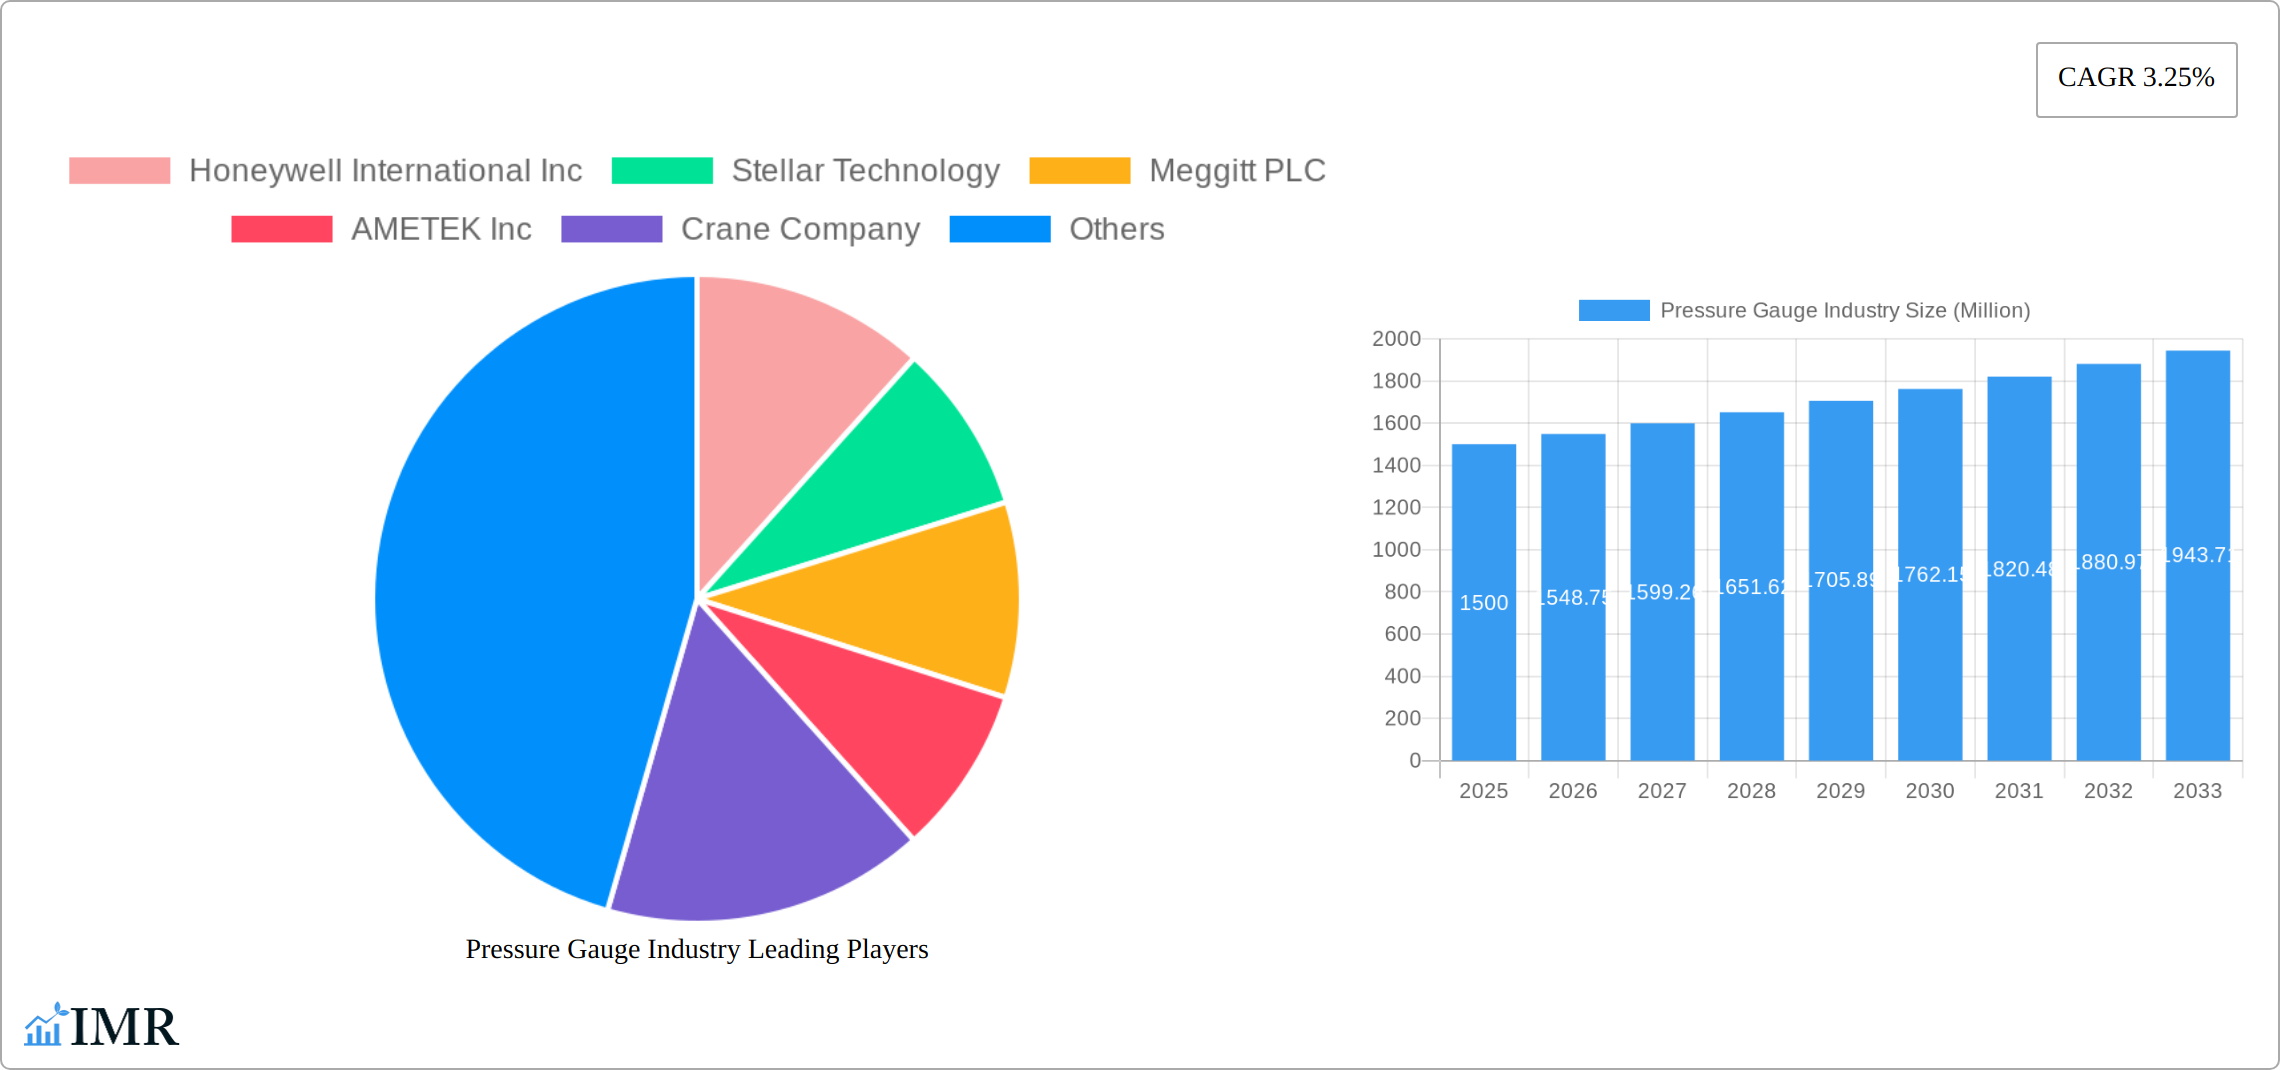
Key Insights
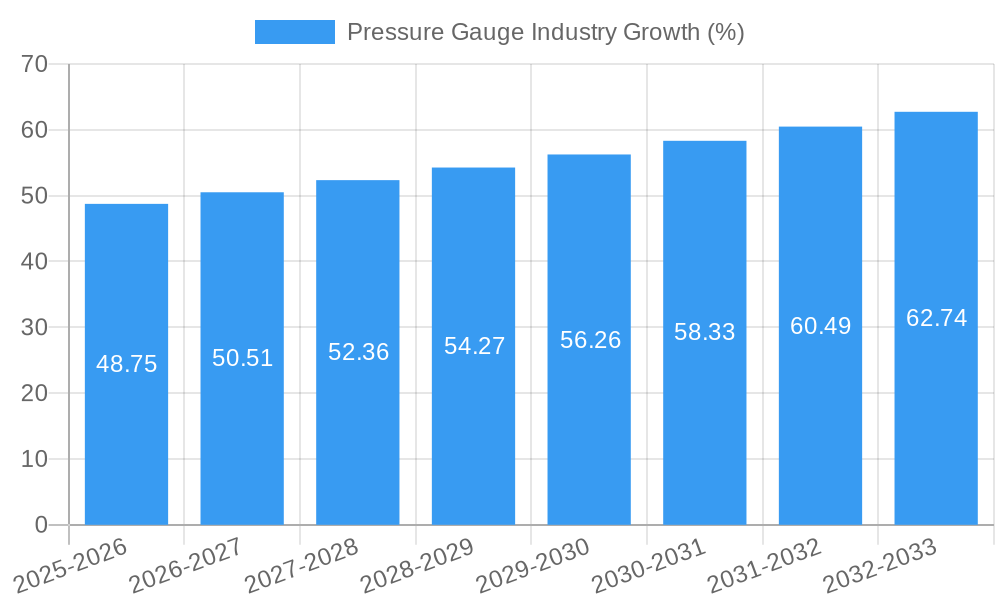
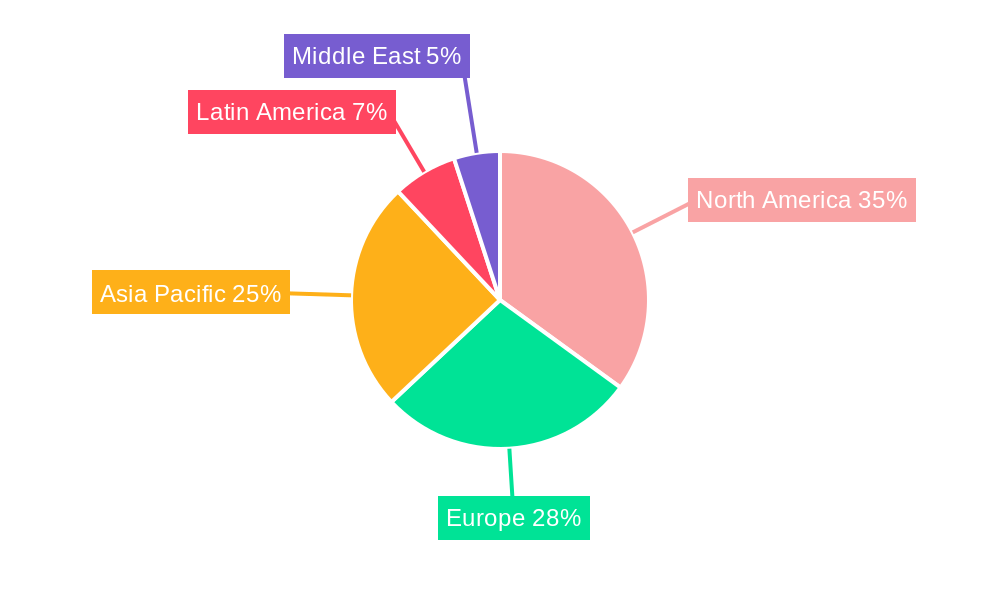
The global pressure gauge market, exhibiting a Compound Annual Growth Rate (CAGR) of 3.25%, is poised for substantial growth between 2025 and 2033. Driven by increasing industrial automation across diverse sectors like aerospace and defense, automotive, and healthcare, demand for accurate and reliable pressure measurement devices is steadily rising. Technological advancements, particularly in digital pressure gauges offering enhanced precision, connectivity, and data logging capabilities, are further fueling market expansion. The adoption of smart sensors and Industry 4.0 initiatives is creating opportunities for integrated pressure monitoring systems, boosting the overall market value. While challenges like the fluctuating prices of raw materials and potential supply chain disruptions exist, the long-term outlook remains positive. The market is segmented by output type (analog and digital) and application, with the aerospace and defense, and automotive sectors currently dominating. However, the healthcare and energy sectors are expected to show significant growth due to increasing demand for advanced pressure monitoring solutions in medical devices and energy infrastructure. Companies like Honeywell International Inc., AMETEK Inc., and Meggitt PLC are key players, constantly innovating to maintain their market share. Geographic expansion is also a key driver, with regions like Asia-Pacific expected to witness significant growth owing to industrialization and infrastructure development.
The pressure gauge market's growth trajectory is influenced by several factors. The ongoing trend towards miniaturization and improved accuracy in pressure gauges is driving demand across various applications. Furthermore, the increasing focus on safety and process optimization in industries like oil and gas, and chemical processing is bolstering adoption. Regulatory compliance requirements in several sectors further necessitate the use of precise pressure measurement devices. The competition among established players is intense, with manufacturers focusing on strategic partnerships, acquisitions, and product diversification to gain a competitive edge. The market's future trajectory will likely depend on technological innovations, geopolitical events, and the overall economic climate. The continued focus on sustainability and environmentally friendly manufacturing practices will also play a role in shaping market dynamics.
Pressure Gauge Industry Market Report: 2019-2033
This comprehensive report provides an in-depth analysis of the Pressure Gauge Industry, encompassing market dynamics, growth trends, regional performance, product landscape, key players, and future outlook. The report covers the period from 2019 to 2033, with 2025 as the base year and a forecast period of 2025-2033. The parent market is instrumentation, while the child market is pressure measurement devices. Market values are presented in million units.
Pressure Gauge Industry Market Dynamics & Structure
The pressure gauge market exhibits a moderately concentrated structure, with key players like Honeywell International Inc, AMETEK Inc, and Emerson Electric Co holding significant market share. Technological innovation, particularly in digital pressure gauges and wireless technologies, is a major driver. Stringent safety and accuracy regulations, varying across different applications (aerospace, automotive, etc.), significantly influence market dynamics. Competitive pressures arise from the availability of substitute technologies and the continuous entry of new players offering cost-effective solutions. End-user demographics, driven by industrial automation and increasing demand from diverse sectors like healthcare and energy, are expanding the market. M&A activity within the industry is moderate, with xx deals recorded in the historical period (2019-2024), primarily focused on strengthening technological capabilities and expanding market reach.
- Market Concentration: Moderately concentrated, with top 5 players holding approximately xx% market share.
- Technological Innovation: Strong emphasis on digitalization, wireless connectivity, and improved accuracy.
- Regulatory Framework: Stringent safety and accuracy standards vary by application (e.g., aerospace has stricter norms).
- Competitive Substitutes: Emerging technologies like MEMS-based sensors present competitive challenges.
- End-User Demographics: Growing demand from diverse sectors like automotive, healthcare, and energy.
- M&A Trends: Moderate M&A activity observed, focused on technology enhancement and market expansion (xx deals, 2019-2024).
Pressure Gauge Industry Growth Trends & Insights
The pressure gauge market witnessed robust growth during the historical period (2019-2024), driven by increasing industrial automation and rising demand across various applications. The market size expanded from xx million units in 2019 to xx million units in 2024, registering a CAGR of xx%. This growth is expected to continue in the forecast period (2025-2033), driven by factors like the rising adoption of digital pressure gauges, advancements in sensor technology, and the increasing demand for precision measurement across diverse industries. The market penetration rate for digital gauges is rising steadily, reaching xx% in 2024, and is projected to exceed xx% by 2033. Technological disruptions, such as the integration of IoT capabilities and AI-driven analytics, are reshaping the market landscape. Consumer behavior shifts are evident in the preference for user-friendly interfaces and wireless connectivity.
Dominant Regions, Countries, or Segments in Pressure Gauge Industry
North America currently dominates the pressure gauge market, followed by Europe and Asia-Pacific. Within the output type segment, the digital pressure gauge segment is experiencing faster growth due to its superior accuracy, connectivity features, and ease of integration with industrial control systems. The aerospace and defense segment presents the highest growth potential due to stringent safety regulations and the increasing complexity of modern aircraft. Other high-growth application segments include the automotive and energy industries.
- North America Dominance: Driven by robust industrial sector, technological advancements, and stringent safety regulations.
- Digital Segment Growth: Higher accuracy, connectivity, and ease of integration are key drivers.
- Aerospace & Defense Leadership: Stringent regulations and increasing aircraft complexity fuel high demand.
- Automotive and Energy Sector Growth: Expanding industrial automation and infrastructure development contribute to strong growth.
Pressure Gauge Industry Product Landscape
Pressure gauge innovation centers around enhanced accuracy, improved durability, wireless connectivity, and user-friendly interfaces. Digital pressure gauges, with their advanced features and data logging capabilities, are gaining significant traction. The integration of smart sensors and IoT capabilities is enhancing remote monitoring and predictive maintenance. Unique selling propositions focus on ease of use, reliability, precision, and data integration capabilities. Technological advancements revolve around miniaturization, improved material science, and sophisticated signal processing techniques.
Key Drivers, Barriers & Challenges in Pressure Gauge Industry
Key Drivers:
- Increasing industrial automation and digitization across various sectors.
- Growing demand for precise and reliable pressure measurement in diverse applications.
- Advancements in sensor technology and wireless communication.
- Stringent safety and environmental regulations promoting advanced solutions.
Challenges:
- High initial investment costs for advanced pressure gauges can limit adoption in certain segments.
- Supply chain disruptions impacting the availability of crucial components (e.g., semiconductors).
- Intense competition among existing players and the emergence of new entrants.
- Regulatory compliance requirements adding to manufacturing costs.
Emerging Opportunities in Pressure Gauge Industry
- Expansion into untapped markets in developing economies.
- Integration of pressure gauges with advanced control systems and IoT platforms.
- Development of specialized pressure gauges for niche applications (e.g., medical devices, deep-sea exploration).
- Growing demand for wireless and smart pressure gauges in various sectors.
Growth Accelerators in the Pressure Gauge Industry Industry
Technological breakthroughs in sensor technology, materials science, and wireless communication are crucial catalysts for long-term growth. Strategic partnerships and collaborations among manufacturers, technology providers, and end-users facilitate innovation and market expansion. The development and adoption of Industry 4.0 technologies and the growing integration of pressure gauges into advanced control systems accelerate market growth.
Key Players Shaping the Pressure Gauge Industry Market
- Honeywell International Inc
- Stellar Technology
- Meggitt PLC
- AMETEK Inc
- Crane Company
- Tavis Corporation
- Industrial Quick Search Inc
- Emerson Electric Co
- CIRCOR Aerospace
- Newbow Aerospace Ltd
- WINTERS INSTRUMENTS
Notable Milestones in Pressure Gauge Industry Sector
- December 2022: OMEGA launches DPG509 digital pressure gauge series, featuring advanced functionality and a user-friendly interface.
- October 2022: Parker Meggitt introduces iPRESS, a long-range wireless tire pressure gauge for aviation, enhancing user experience through smartphone integration.
In-Depth Pressure Gauge Industry Market Outlook
The pressure gauge market is poised for sustained growth, driven by technological advancements, rising demand from diverse sectors, and expanding industrial automation. Strategic partnerships and investments in R&D will further drive innovation and market penetration. Focus on developing specialized pressure gauges for niche applications presents substantial opportunities for market expansion. The adoption of smart technologies and data analytics will revolutionize pressure measurement and pave the way for predictive maintenance and optimized industrial processes.
Pressure Gauge Industry Segmentation
-
1. Output Type
- 1.1. Analog
- 1.2. Digital
-
2. Application
- 2.1. Aerospace and Defense
- 2.2. Automotive
- 2.3. Healthcare
- 2.4. Energy
- 2.5. Other Applications
Pressure Gauge Industry Segmentation By Geography
-
1. North America
- 1.1. United States
- 1.2. Canada
-
2. Europe
- 2.1. United Kingdom
- 2.2. Germany
- 2.3. France
- 2.4. Rest of Europe
-
3. Asia Pacific
- 3.1. China
- 3.2. India
- 3.3. Japan
- 3.4. Rest of Asia Pacific
-
4. Latin America
- 4.1. Brazil
- 4.2. Rest of Latin America
- 5. Middle East
-
6. Saudi Arabia
- 6.1. United Arab Emirates
- 6.2. Turkey
- 6.3. Rest of Middle East
Pressure Gauge Industry REPORT HIGHLIGHTS
| Aspects | Details |
|---|---|
| Study Period | 2019-2033 |
| Base Year | 2024 |
| Estimated Year | 2025 |
| Forecast Period | 2025-2033 |
| Historical Period | 2019-2024 |
| Growth Rate | CAGR of 3.25% from 2019-2033 |
| Segmentation |
|
Table of Contents
- 1. Introduction
- 1.1. Research Scope
- 1.2. Market Segmentation
- 1.3. Research Methodology
- 1.4. Definitions and Assumptions
- 2. Executive Summary
- 2.1. Introduction
- 3. Market Dynamics
- 3.1. Introduction
- 3.2. Market Drivers
- 3.3. Market Restrains
- 3.4. Market Trends
- 3.4.1. Healthcare Segment is Projected to Show the Highest Growth During the Forecast Period
- 4. Market Factor Analysis
- 4.1. Porters Five Forces
- 4.2. Supply/Value Chain
- 4.3. PESTEL analysis
- 4.4. Market Entropy
- 4.5. Patent/Trademark Analysis
- 5. Global Pressure Gauge Industry Analysis, Insights and Forecast, 2019-2031
- 5.1. Market Analysis, Insights and Forecast - by Output Type
- 5.1.1. Analog
- 5.1.2. Digital
- 5.2. Market Analysis, Insights and Forecast - by Application
- 5.2.1. Aerospace and Defense
- 5.2.2. Automotive
- 5.2.3. Healthcare
- 5.2.4. Energy
- 5.2.5. Other Applications
- 5.3. Market Analysis, Insights and Forecast - by Region
- 5.3.1. North America
- 5.3.2. Europe
- 5.3.3. Asia Pacific
- 5.3.4. Latin America
- 5.3.5. Middle East
- 5.3.6. Saudi Arabia
- 5.1. Market Analysis, Insights and Forecast - by Output Type
- 6. North America Pressure Gauge Industry Analysis, Insights and Forecast, 2019-2031
- 6.1. Market Analysis, Insights and Forecast - by Output Type
- 6.1.1. Analog
- 6.1.2. Digital
- 6.2. Market Analysis, Insights and Forecast - by Application
- 6.2.1. Aerospace and Defense
- 6.2.2. Automotive
- 6.2.3. Healthcare
- 6.2.4. Energy
- 6.2.5. Other Applications
- 6.1. Market Analysis, Insights and Forecast - by Output Type
- 7. Europe Pressure Gauge Industry Analysis, Insights and Forecast, 2019-2031
- 7.1. Market Analysis, Insights and Forecast - by Output Type
- 7.1.1. Analog
- 7.1.2. Digital
- 7.2. Market Analysis, Insights and Forecast - by Application
- 7.2.1. Aerospace and Defense
- 7.2.2. Automotive
- 7.2.3. Healthcare
- 7.2.4. Energy
- 7.2.5. Other Applications
- 7.1. Market Analysis, Insights and Forecast - by Output Type
- 8. Asia Pacific Pressure Gauge Industry Analysis, Insights and Forecast, 2019-2031
- 8.1. Market Analysis, Insights and Forecast - by Output Type
- 8.1.1. Analog
- 8.1.2. Digital
- 8.2. Market Analysis, Insights and Forecast - by Application
- 8.2.1. Aerospace and Defense
- 8.2.2. Automotive
- 8.2.3. Healthcare
- 8.2.4. Energy
- 8.2.5. Other Applications
- 8.1. Market Analysis, Insights and Forecast - by Output Type
- 9. Latin America Pressure Gauge Industry Analysis, Insights and Forecast, 2019-2031
- 9.1. Market Analysis, Insights and Forecast - by Output Type
- 9.1.1. Analog
- 9.1.2. Digital
- 9.2. Market Analysis, Insights and Forecast - by Application
- 9.2.1. Aerospace and Defense
- 9.2.2. Automotive
- 9.2.3. Healthcare
- 9.2.4. Energy
- 9.2.5. Other Applications
- 9.1. Market Analysis, Insights and Forecast - by Output Type
- 10. Middle East Pressure Gauge Industry Analysis, Insights and Forecast, 2019-2031
- 10.1. Market Analysis, Insights and Forecast - by Output Type
- 10.1.1. Analog
- 10.1.2. Digital
- 10.2. Market Analysis, Insights and Forecast - by Application
- 10.2.1. Aerospace and Defense
- 10.2.2. Automotive
- 10.2.3. Healthcare
- 10.2.4. Energy
- 10.2.5. Other Applications
- 10.1. Market Analysis, Insights and Forecast - by Output Type
- 11. Saudi Arabia Pressure Gauge Industry Analysis, Insights and Forecast, 2019-2031
- 11.1. Market Analysis, Insights and Forecast - by Output Type
- 11.1.1. Analog
- 11.1.2. Digital
- 11.2. Market Analysis, Insights and Forecast - by Application
- 11.2.1. Aerospace and Defense
- 11.2.2. Automotive
- 11.2.3. Healthcare
- 11.2.4. Energy
- 11.2.5. Other Applications
- 11.1. Market Analysis, Insights and Forecast - by Output Type
- 12. North America Pressure Gauge Industry Analysis, Insights and Forecast, 2019-2031
- 12.1. Market Analysis, Insights and Forecast - By Country/Sub-region
- 12.1.1 United States
- 12.1.2 Canada
- 13. Europe Pressure Gauge Industry Analysis, Insights and Forecast, 2019-2031
- 13.1. Market Analysis, Insights and Forecast - By Country/Sub-region
- 13.1.1 United Kingdom
- 13.1.2 Germany
- 13.1.3 France
- 13.1.4 Rest of Europe
- 14. Asia Pacific Pressure Gauge Industry Analysis, Insights and Forecast, 2019-2031
- 14.1. Market Analysis, Insights and Forecast - By Country/Sub-region
- 14.1.1 China
- 14.1.2 India
- 14.1.3 Japan
- 14.1.4 Rest of Asia Pacific
- 15. Latin America Pressure Gauge Industry Analysis, Insights and Forecast, 2019-2031
- 15.1. Market Analysis, Insights and Forecast - By Country/Sub-region
- 15.1.1 Brazil
- 15.1.2 Rest of Latin America
- 16. Middle East Pressure Gauge Industry Analysis, Insights and Forecast, 2019-2031
- 16.1. Market Analysis, Insights and Forecast - By Country/Sub-region
- 16.1.1.
- 17. Saudi Arabia Pressure Gauge Industry Analysis, Insights and Forecast, 2019-2031
- 17.1. Market Analysis, Insights and Forecast - By Country/Sub-region
- 17.1.1 United Arab Emirates
- 17.1.2 Turkey
- 17.1.3 Rest of Middle East
- 18. Competitive Analysis
- 18.1. Global Market Share Analysis 2024
- 18.2. Company Profiles
- 18.2.1 Honeywell International Inc
- 18.2.1.1. Overview
- 18.2.1.2. Products
- 18.2.1.3. SWOT Analysis
- 18.2.1.4. Recent Developments
- 18.2.1.5. Financials (Based on Availability)
- 18.2.2 Stellar Technology
- 18.2.2.1. Overview
- 18.2.2.2. Products
- 18.2.2.3. SWOT Analysis
- 18.2.2.4. Recent Developments
- 18.2.2.5. Financials (Based on Availability)
- 18.2.3 Meggitt PLC
- 18.2.3.1. Overview
- 18.2.3.2. Products
- 18.2.3.3. SWOT Analysis
- 18.2.3.4. Recent Developments
- 18.2.3.5. Financials (Based on Availability)
- 18.2.4 AMETEK Inc
- 18.2.4.1. Overview
- 18.2.4.2. Products
- 18.2.4.3. SWOT Analysis
- 18.2.4.4. Recent Developments
- 18.2.4.5. Financials (Based on Availability)
- 18.2.5 Crane Company
- 18.2.5.1. Overview
- 18.2.5.2. Products
- 18.2.5.3. SWOT Analysis
- 18.2.5.4. Recent Developments
- 18.2.5.5. Financials (Based on Availability)
- 18.2.6 Tavis Corporation
- 18.2.6.1. Overview
- 18.2.6.2. Products
- 18.2.6.3. SWOT Analysis
- 18.2.6.4. Recent Developments
- 18.2.6.5. Financials (Based on Availability)
- 18.2.7 Industrial Quick Search Inc
- 18.2.7.1. Overview
- 18.2.7.2. Products
- 18.2.7.3. SWOT Analysis
- 18.2.7.4. Recent Developments
- 18.2.7.5. Financials (Based on Availability)
- 18.2.8 Emerson Electric Co
- 18.2.8.1. Overview
- 18.2.8.2. Products
- 18.2.8.3. SWOT Analysis
- 18.2.8.4. Recent Developments
- 18.2.8.5. Financials (Based on Availability)
- 18.2.9 CIRCOR Aerospace
- 18.2.9.1. Overview
- 18.2.9.2. Products
- 18.2.9.3. SWOT Analysis
- 18.2.9.4. Recent Developments
- 18.2.9.5. Financials (Based on Availability)
- 18.2.10 Newbow Aerospace Ltd
- 18.2.10.1. Overview
- 18.2.10.2. Products
- 18.2.10.3. SWOT Analysis
- 18.2.10.4. Recent Developments
- 18.2.10.5. Financials (Based on Availability)
- 18.2.11 WINTERS INSTRUMENTS
- 18.2.11.1. Overview
- 18.2.11.2. Products
- 18.2.11.3. SWOT Analysis
- 18.2.11.4. Recent Developments
- 18.2.11.5. Financials (Based on Availability)
- 18.2.1 Honeywell International Inc
List of Figures
- Figure 1: Global Pressure Gauge Industry Revenue Breakdown (Million, %) by Region 2024 & 2032
- Figure 2: North America Pressure Gauge Industry Revenue (Million), by Country 2024 & 2032
- Figure 3: North America Pressure Gauge Industry Revenue Share (%), by Country 2024 & 2032
- Figure 4: Europe Pressure Gauge Industry Revenue (Million), by Country 2024 & 2032
- Figure 5: Europe Pressure Gauge Industry Revenue Share (%), by Country 2024 & 2032
- Figure 6: Asia Pacific Pressure Gauge Industry Revenue (Million), by Country 2024 & 2032
- Figure 7: Asia Pacific Pressure Gauge Industry Revenue Share (%), by Country 2024 & 2032
- Figure 8: Latin America Pressure Gauge Industry Revenue (Million), by Country 2024 & 2032
- Figure 9: Latin America Pressure Gauge Industry Revenue Share (%), by Country 2024 & 2032
- Figure 10: Middle East Pressure Gauge Industry Revenue (Million), by Country 2024 & 2032
- Figure 11: Middle East Pressure Gauge Industry Revenue Share (%), by Country 2024 & 2032
- Figure 12: Saudi Arabia Pressure Gauge Industry Revenue (Million), by Country 2024 & 2032
- Figure 13: Saudi Arabia Pressure Gauge Industry Revenue Share (%), by Country 2024 & 2032
- Figure 14: North America Pressure Gauge Industry Revenue (Million), by Output Type 2024 & 2032
- Figure 15: North America Pressure Gauge Industry Revenue Share (%), by Output Type 2024 & 2032
- Figure 16: North America Pressure Gauge Industry Revenue (Million), by Application 2024 & 2032
- Figure 17: North America Pressure Gauge Industry Revenue Share (%), by Application 2024 & 2032
- Figure 18: North America Pressure Gauge Industry Revenue (Million), by Country 2024 & 2032
- Figure 19: North America Pressure Gauge Industry Revenue Share (%), by Country 2024 & 2032
- Figure 20: Europe Pressure Gauge Industry Revenue (Million), by Output Type 2024 & 2032
- Figure 21: Europe Pressure Gauge Industry Revenue Share (%), by Output Type 2024 & 2032
- Figure 22: Europe Pressure Gauge Industry Revenue (Million), by Application 2024 & 2032
- Figure 23: Europe Pressure Gauge Industry Revenue Share (%), by Application 2024 & 2032
- Figure 24: Europe Pressure Gauge Industry Revenue (Million), by Country 2024 & 2032
- Figure 25: Europe Pressure Gauge Industry Revenue Share (%), by Country 2024 & 2032
- Figure 26: Asia Pacific Pressure Gauge Industry Revenue (Million), by Output Type 2024 & 2032
- Figure 27: Asia Pacific Pressure Gauge Industry Revenue Share (%), by Output Type 2024 & 2032
- Figure 28: Asia Pacific Pressure Gauge Industry Revenue (Million), by Application 2024 & 2032
- Figure 29: Asia Pacific Pressure Gauge Industry Revenue Share (%), by Application 2024 & 2032
- Figure 30: Asia Pacific Pressure Gauge Industry Revenue (Million), by Country 2024 & 2032
- Figure 31: Asia Pacific Pressure Gauge Industry Revenue Share (%), by Country 2024 & 2032
- Figure 32: Latin America Pressure Gauge Industry Revenue (Million), by Output Type 2024 & 2032
- Figure 33: Latin America Pressure Gauge Industry Revenue Share (%), by Output Type 2024 & 2032
- Figure 34: Latin America Pressure Gauge Industry Revenue (Million), by Application 2024 & 2032
- Figure 35: Latin America Pressure Gauge Industry Revenue Share (%), by Application 2024 & 2032
- Figure 36: Latin America Pressure Gauge Industry Revenue (Million), by Country 2024 & 2032
- Figure 37: Latin America Pressure Gauge Industry Revenue Share (%), by Country 2024 & 2032
- Figure 38: Middle East Pressure Gauge Industry Revenue (Million), by Output Type 2024 & 2032
- Figure 39: Middle East Pressure Gauge Industry Revenue Share (%), by Output Type 2024 & 2032
- Figure 40: Middle East Pressure Gauge Industry Revenue (Million), by Application 2024 & 2032
- Figure 41: Middle East Pressure Gauge Industry Revenue Share (%), by Application 2024 & 2032
- Figure 42: Middle East Pressure Gauge Industry Revenue (Million), by Country 2024 & 2032
- Figure 43: Middle East Pressure Gauge Industry Revenue Share (%), by Country 2024 & 2032
- Figure 44: Saudi Arabia Pressure Gauge Industry Revenue (Million), by Output Type 2024 & 2032
- Figure 45: Saudi Arabia Pressure Gauge Industry Revenue Share (%), by Output Type 2024 & 2032
- Figure 46: Saudi Arabia Pressure Gauge Industry Revenue (Million), by Application 2024 & 2032
- Figure 47: Saudi Arabia Pressure Gauge Industry Revenue Share (%), by Application 2024 & 2032
- Figure 48: Saudi Arabia Pressure Gauge Industry Revenue (Million), by Country 2024 & 2032
- Figure 49: Saudi Arabia Pressure Gauge Industry Revenue Share (%), by Country 2024 & 2032
List of Tables
- Table 1: Global Pressure Gauge Industry Revenue Million Forecast, by Region 2019 & 2032
- Table 2: Global Pressure Gauge Industry Revenue Million Forecast, by Output Type 2019 & 2032
- Table 3: Global Pressure Gauge Industry Revenue Million Forecast, by Application 2019 & 2032
- Table 4: Global Pressure Gauge Industry Revenue Million Forecast, by Region 2019 & 2032
- Table 5: Global Pressure Gauge Industry Revenue Million Forecast, by Country 2019 & 2032
- Table 6: United States Pressure Gauge Industry Revenue (Million) Forecast, by Application 2019 & 2032
- Table 7: Canada Pressure Gauge Industry Revenue (Million) Forecast, by Application 2019 & 2032
- Table 8: Global Pressure Gauge Industry Revenue Million Forecast, by Country 2019 & 2032
- Table 9: United Kingdom Pressure Gauge Industry Revenue (Million) Forecast, by Application 2019 & 2032
- Table 10: Germany Pressure Gauge Industry Revenue (Million) Forecast, by Application 2019 & 2032
- Table 11: France Pressure Gauge Industry Revenue (Million) Forecast, by Application 2019 & 2032
- Table 12: Rest of Europe Pressure Gauge Industry Revenue (Million) Forecast, by Application 2019 & 2032
- Table 13: Global Pressure Gauge Industry Revenue Million Forecast, by Country 2019 & 2032
- Table 14: China Pressure Gauge Industry Revenue (Million) Forecast, by Application 2019 & 2032
- Table 15: India Pressure Gauge Industry Revenue (Million) Forecast, by Application 2019 & 2032
- Table 16: Japan Pressure Gauge Industry Revenue (Million) Forecast, by Application 2019 & 2032
- Table 17: Rest of Asia Pacific Pressure Gauge Industry Revenue (Million) Forecast, by Application 2019 & 2032
- Table 18: Global Pressure Gauge Industry Revenue Million Forecast, by Country 2019 & 2032
- Table 19: Brazil Pressure Gauge Industry Revenue (Million) Forecast, by Application 2019 & 2032
- Table 20: Rest of Latin America Pressure Gauge Industry Revenue (Million) Forecast, by Application 2019 & 2032
- Table 21: Global Pressure Gauge Industry Revenue Million Forecast, by Country 2019 & 2032
- Table 22: Pressure Gauge Industry Revenue (Million) Forecast, by Application 2019 & 2032
- Table 23: Global Pressure Gauge Industry Revenue Million Forecast, by Country 2019 & 2032
- Table 24: United Arab Emirates Pressure Gauge Industry Revenue (Million) Forecast, by Application 2019 & 2032
- Table 25: Turkey Pressure Gauge Industry Revenue (Million) Forecast, by Application 2019 & 2032
- Table 26: Rest of Middle East Pressure Gauge Industry Revenue (Million) Forecast, by Application 2019 & 2032
- Table 27: Global Pressure Gauge Industry Revenue Million Forecast, by Output Type 2019 & 2032
- Table 28: Global Pressure Gauge Industry Revenue Million Forecast, by Application 2019 & 2032
- Table 29: Global Pressure Gauge Industry Revenue Million Forecast, by Country 2019 & 2032
- Table 30: United States Pressure Gauge Industry Revenue (Million) Forecast, by Application 2019 & 2032
- Table 31: Canada Pressure Gauge Industry Revenue (Million) Forecast, by Application 2019 & 2032
- Table 32: Global Pressure Gauge Industry Revenue Million Forecast, by Output Type 2019 & 2032
- Table 33: Global Pressure Gauge Industry Revenue Million Forecast, by Application 2019 & 2032
- Table 34: Global Pressure Gauge Industry Revenue Million Forecast, by Country 2019 & 2032
- Table 35: United Kingdom Pressure Gauge Industry Revenue (Million) Forecast, by Application 2019 & 2032
- Table 36: Germany Pressure Gauge Industry Revenue (Million) Forecast, by Application 2019 & 2032
- Table 37: France Pressure Gauge Industry Revenue (Million) Forecast, by Application 2019 & 2032
- Table 38: Rest of Europe Pressure Gauge Industry Revenue (Million) Forecast, by Application 2019 & 2032
- Table 39: Global Pressure Gauge Industry Revenue Million Forecast, by Output Type 2019 & 2032
- Table 40: Global Pressure Gauge Industry Revenue Million Forecast, by Application 2019 & 2032
- Table 41: Global Pressure Gauge Industry Revenue Million Forecast, by Country 2019 & 2032
- Table 42: China Pressure Gauge Industry Revenue (Million) Forecast, by Application 2019 & 2032
- Table 43: India Pressure Gauge Industry Revenue (Million) Forecast, by Application 2019 & 2032
- Table 44: Japan Pressure Gauge Industry Revenue (Million) Forecast, by Application 2019 & 2032
- Table 45: Rest of Asia Pacific Pressure Gauge Industry Revenue (Million) Forecast, by Application 2019 & 2032
- Table 46: Global Pressure Gauge Industry Revenue Million Forecast, by Output Type 2019 & 2032
- Table 47: Global Pressure Gauge Industry Revenue Million Forecast, by Application 2019 & 2032
- Table 48: Global Pressure Gauge Industry Revenue Million Forecast, by Country 2019 & 2032
- Table 49: Brazil Pressure Gauge Industry Revenue (Million) Forecast, by Application 2019 & 2032
- Table 50: Rest of Latin America Pressure Gauge Industry Revenue (Million) Forecast, by Application 2019 & 2032
- Table 51: Global Pressure Gauge Industry Revenue Million Forecast, by Output Type 2019 & 2032
- Table 52: Global Pressure Gauge Industry Revenue Million Forecast, by Application 2019 & 2032
- Table 53: Global Pressure Gauge Industry Revenue Million Forecast, by Country 2019 & 2032
- Table 54: Global Pressure Gauge Industry Revenue Million Forecast, by Output Type 2019 & 2032
- Table 55: Global Pressure Gauge Industry Revenue Million Forecast, by Application 2019 & 2032
- Table 56: Global Pressure Gauge Industry Revenue Million Forecast, by Country 2019 & 2032
- Table 57: United Arab Emirates Pressure Gauge Industry Revenue (Million) Forecast, by Application 2019 & 2032
- Table 58: Turkey Pressure Gauge Industry Revenue (Million) Forecast, by Application 2019 & 2032
- Table 59: Rest of Middle East Pressure Gauge Industry Revenue (Million) Forecast, by Application 2019 & 2032
Frequently Asked Questions
1. What is the projected Compound Annual Growth Rate (CAGR) of the Pressure Gauge Industry?
The projected CAGR is approximately 3.25%.
2. Which companies are prominent players in the Pressure Gauge Industry?
Key companies in the market include Honeywell International Inc, Stellar Technology, Meggitt PLC, AMETEK Inc, Crane Company, Tavis Corporation, Industrial Quick Search Inc, Emerson Electric Co, CIRCOR Aerospace, Newbow Aerospace Ltd, WINTERS INSTRUMENTS.
3. What are the main segments of the Pressure Gauge Industry?
The market segments include Output Type, Application.
4. Can you provide details about the market size?
The market size is estimated to be USD XX Million as of 2022.
5. What are some drivers contributing to market growth?
N/A
6. What are the notable trends driving market growth?
Healthcare Segment is Projected to Show the Highest Growth During the Forecast Period.
7. Are there any restraints impacting market growth?
N/A
8. Can you provide examples of recent developments in the market?
In December 2022, OMEGA announced the launch of DPG509, OMEGA's newest series of digital pressure gauges, an advanced product designed with maximum functionality. The new DPG509 features a user-friendly interface with four buttons and a large 4-digit backlit display. The full-scale accuracy the product offers is as high as 0.08%.
9. What pricing options are available for accessing the report?
Pricing options include single-user, multi-user, and enterprise licenses priced at USD 4750, USD 5250, and USD 8750 respectively.
10. Is the market size provided in terms of value or volume?
The market size is provided in terms of value, measured in Million.
11. Are there any specific market keywords associated with the report?
Yes, the market keyword associated with the report is "Pressure Gauge Industry," which aids in identifying and referencing the specific market segment covered.
12. How do I determine which pricing option suits my needs best?
The pricing options vary based on user requirements and access needs. Individual users may opt for single-user licenses, while businesses requiring broader access may choose multi-user or enterprise licenses for cost-effective access to the report.
13. Are there any additional resources or data provided in the Pressure Gauge Industry report?
While the report offers comprehensive insights, it's advisable to review the specific contents or supplementary materials provided to ascertain if additional resources or data are available.
14. How can I stay updated on further developments or reports in the Pressure Gauge Industry?
To stay informed about further developments, trends, and reports in the Pressure Gauge Industry, consider subscribing to industry newsletters, following relevant companies and organizations, or regularly checking reputable industry news sources and publications.
Methodology
Step 1 - Identification of Relevant Samples Size from Population Database


Step 2 - Approaches for Defining Global Market Size (Value, Volume* & Price*)

Note*: In applicable scenarios
Step 3 - Data Sources
Primary Research
- Web Analytics
- Survey Reports
- Research Institute
- Latest Research Reports
- Opinion Leaders
Secondary Research
- Annual Reports
- White Paper
- Latest Press Release
- Industry Association
- Paid Database
- Investor Presentations

Step 4 - Data Triangulation
Involves using different sources of information in order to increase the validity of a study
These sources are likely to be stakeholders in a program - participants, other researchers, program staff, other community members, and so on.
Then we put all data in single framework & apply various statistical tools to find out the dynamic on the market.
During the analysis stage, feedback from the stakeholder groups would be compared to determine areas of agreement as well as areas of divergence
