

Key Insights
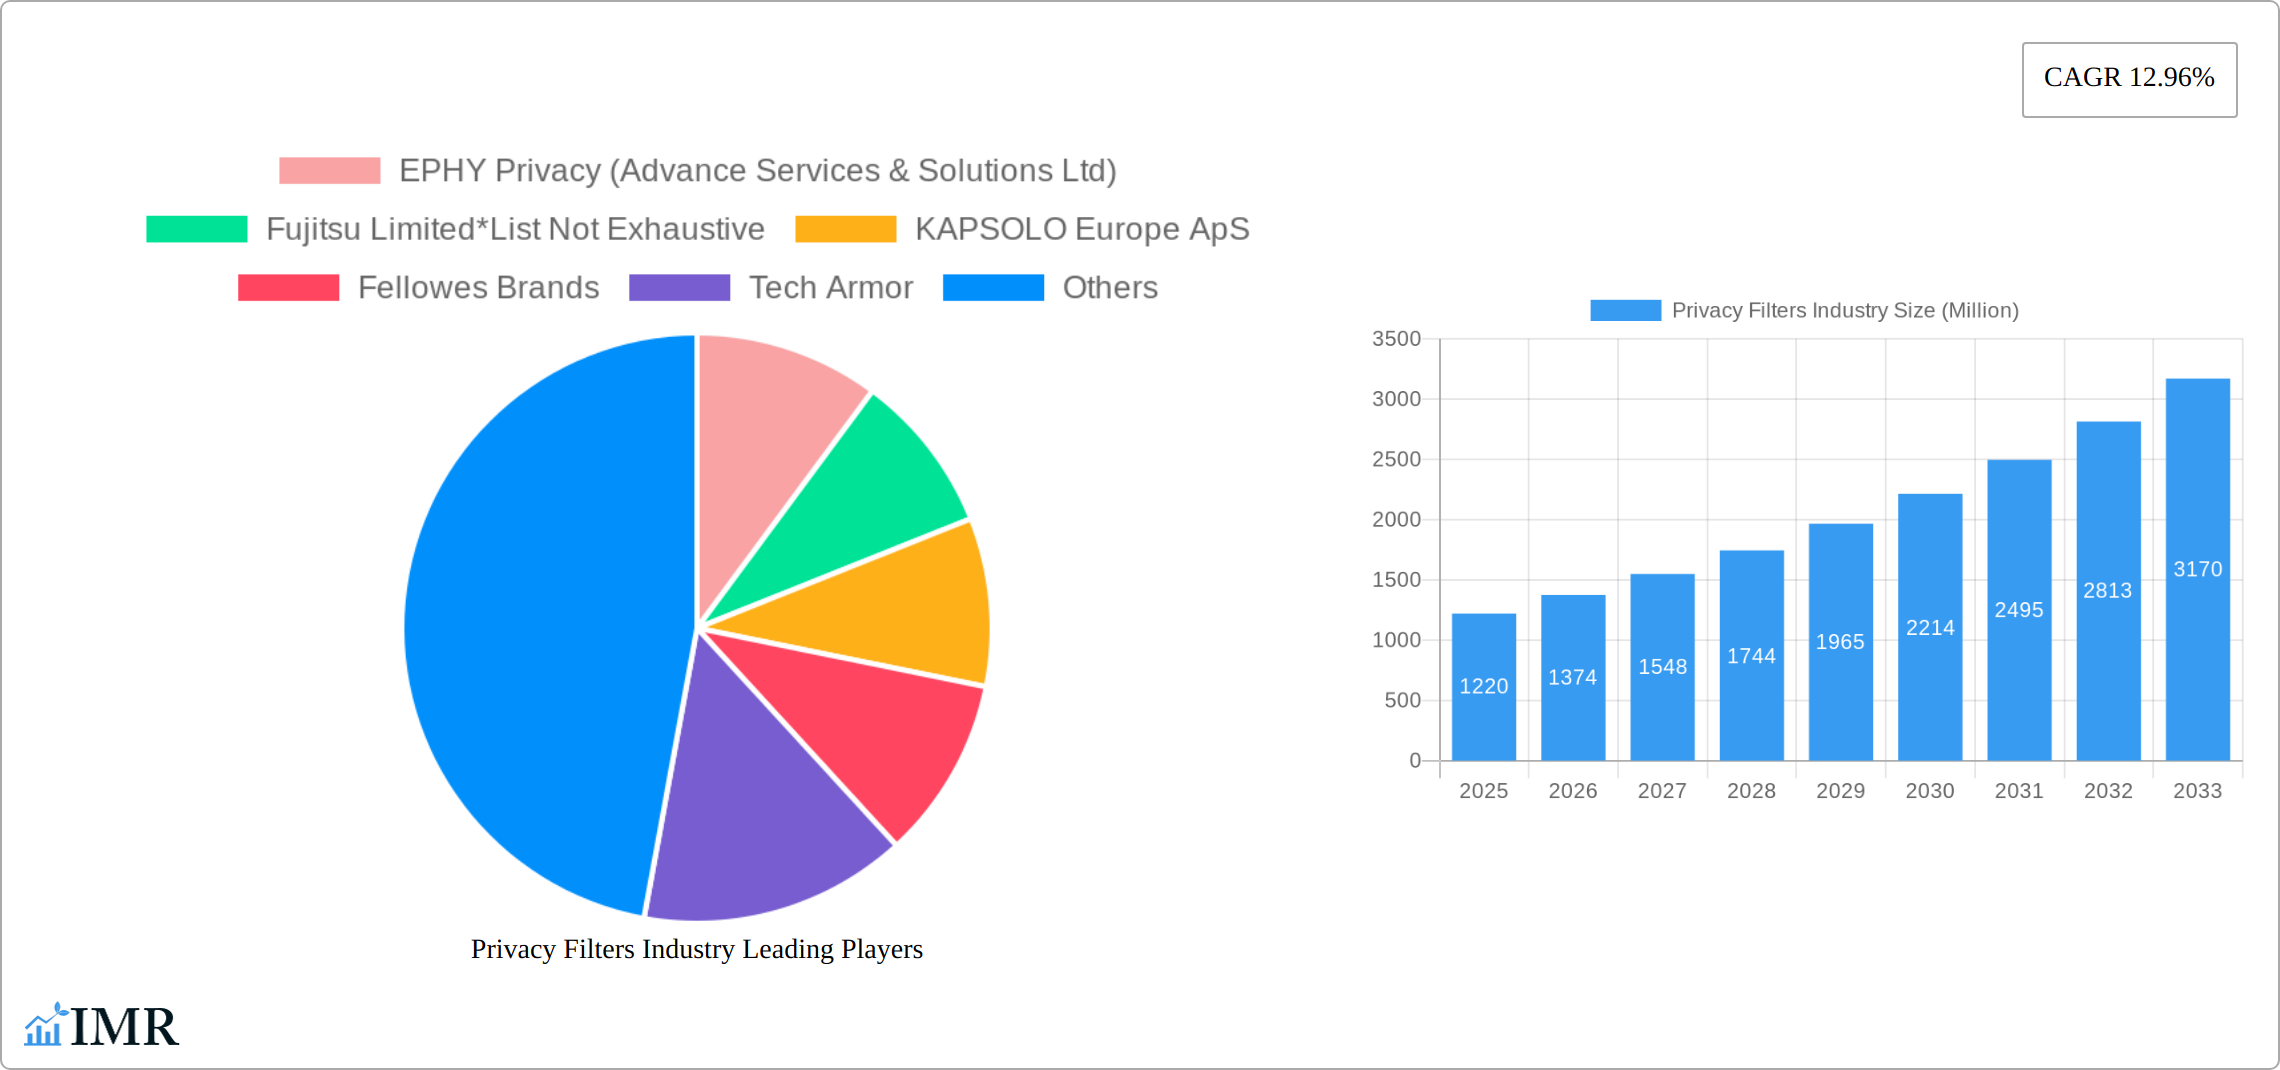
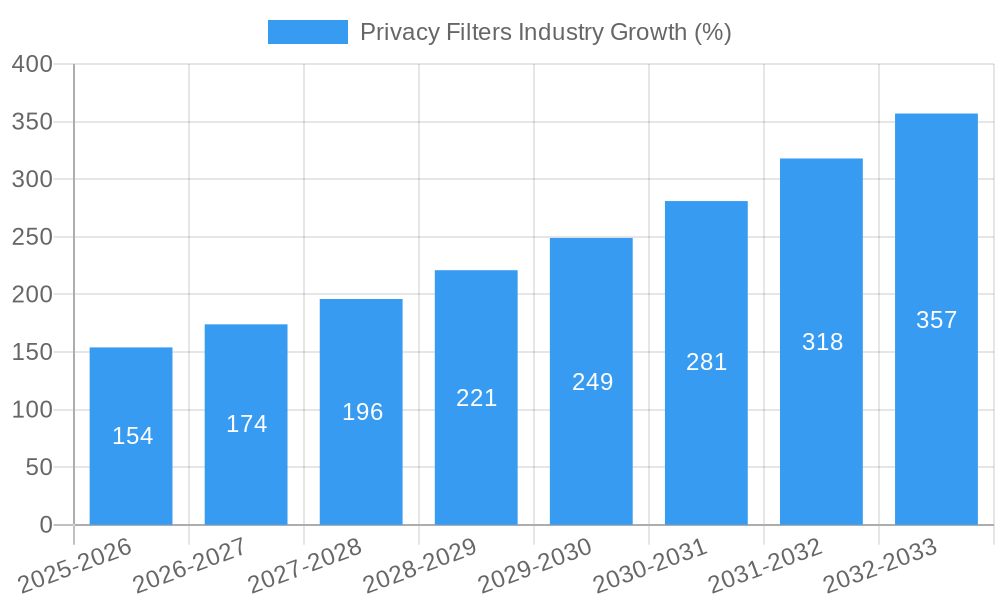
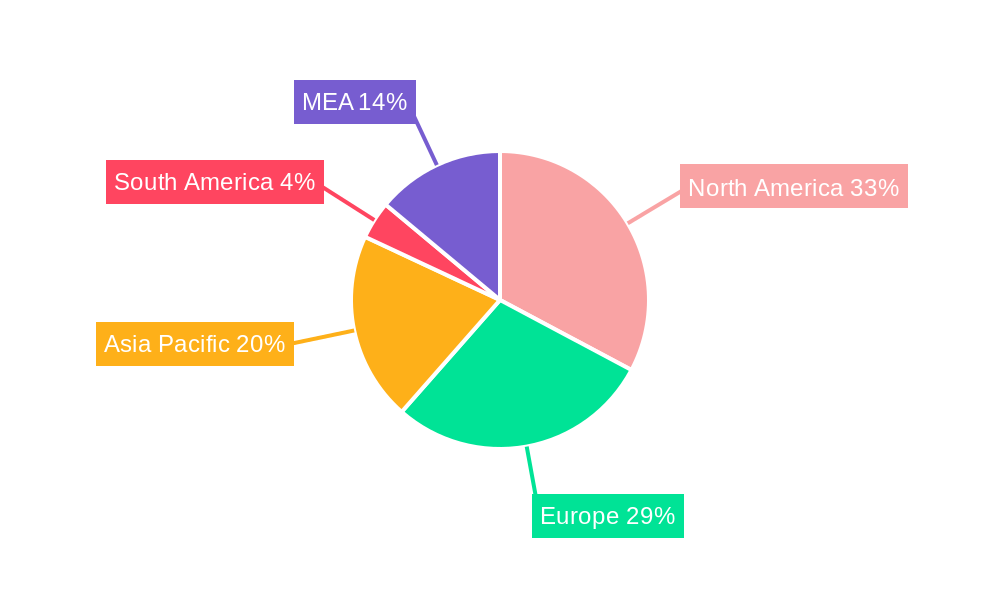
The global privacy filter market, valued at $1.22 billion in 2025, is projected to experience robust growth, driven by a compound annual growth rate (CAGR) of 12.96% from 2025 to 2033. This expansion is fueled by several key factors. Increasing concerns about data breaches and online privacy, particularly within sensitive sectors like finance, healthcare, and government, are significantly boosting demand for privacy filters across various devices – laptops, smartphones, monitors, and tablets. The rising adoption of remote work and the proliferation of sensitive data handled outside secure office environments further contribute to market growth. Furthermore, advancements in filter technology, such as improved adhesive solutions and magnetic options offering easier application and removal, are enhancing user experience and driving adoption. The market is segmented by application (laptops, monitors, smartphones, tablets), feature (adhesive, magnetic, others), and end-user industry (financial institutions, educational institutions, legal firms, government, healthcare, and others). North America and Europe currently dominate the market, reflecting high levels of technological adoption and awareness of cybersecurity risks. However, Asia-Pacific is poised for significant growth due to increasing digitalization and rising disposable incomes.
Competitive landscape analysis reveals a mix of established players like 3M and Dell alongside specialized privacy filter manufacturers such as EPHY Privacy and Upscreen. This competitive environment is fostering innovation and providing diverse solutions to meet varied customer needs. While the market faces some restraints, such as the relatively high cost of premium privacy filters compared to standard screen protectors, and potential concerns about reduced screen clarity, the benefits of enhanced privacy and data security are strongly outweighing these limitations, ensuring continued market expansion in the coming years. The market's trajectory suggests a significant increase in value by 2033, driven by consistent technological advancements, rising cybersecurity awareness, and expanding usage across diverse industries and geographical regions.
Privacy Filters Industry Market Report: 2019-2033
This comprehensive report provides an in-depth analysis of the Privacy Filters industry, encompassing market dynamics, growth trends, regional analysis, product landscape, and key players. With a study period spanning 2019-2033, a base year of 2025, and a forecast period of 2025-2033, this report offers invaluable insights for industry professionals, investors, and strategic decision-makers. The report covers a market valued at xx Million units in 2025, and projects substantial growth over the forecast period.
Privacy Filters Industry Market Dynamics & Structure
The privacy filters market is characterized by a moderately fragmented landscape, with several key players competing alongside smaller niche players. Market concentration is expected to remain relatively stable in the coming years. Technological innovation, driven by advancements in materials science and filter design, plays a crucial role in shaping market dynamics. Stringent data privacy regulations across various sectors, particularly in financial institutions and healthcare, are creating a conducive environment for market growth. Competitive pressures from alternative solutions, such as software-based privacy tools, exist, but are limited by the superior visual clarity and physical protection offered by privacy filters. Furthermore, evolving end-user demographics, including the increasing adoption of laptops and smartphones, contribute significantly to market expansion. The M&A landscape has witnessed notable activity in recent years, driven by the consolidation of players and the expansion of product portfolios.
- Market Concentration: Moderately Fragmented (xx% top 5 players in 2025)
- Technological Innovation: Advancements in adhesive technology, anti-glare coatings, and screen protector integration.
- Regulatory Frameworks: GDPR, CCPA, and other data privacy regulations are driving demand, particularly in regulated sectors.
- Competitive Substitutes: Software-based privacy tools pose limited competition.
- End-User Demographics: Growing adoption of personal and professional devices fuels market growth.
- M&A Trends: xx M&A deals in the past 5 years, driven by vertical integration and market expansion strategies.
Privacy Filters Industry Growth Trends & Insights
The global privacy filters market is experiencing robust growth, driven by increasing concerns about data security and privacy across diverse sectors. The market exhibited a Compound Annual Growth Rate (CAGR) of xx% during the historical period (2019-2024) and is projected to maintain a CAGR of xx% during the forecast period (2025-2033). Market penetration is currently at xx% in key regions and is expected to reach xx% by 2033. The adoption of privacy filters is particularly high in industries with sensitive data handling needs, such as finance and healthcare. Technological disruptions, specifically the development of more durable, versatile, and aesthetically pleasing filters, are contributing to the growth trajectory. Shifting consumer behavior, including heightened awareness of online privacy threats and the increasing use of personal devices for work, further drives market expansion.
Dominant Regions, Countries, or Segments in Privacy Filters Industry
North America currently holds the largest market share, driven by high adoption rates in the US and Canada, attributed to strong regulatory frameworks and high technology penetration. Within the product segments, Laptop privacy filters dominate, followed by monitors and smartphones. In the application-based market segmentation, Financial institutions, followed by government and healthcare, are the major end-users.
- Key Drivers in North America: Strong regulatory environment, high technological adoption, and extensive awareness of data security.
- Key Drivers in Europe: Stringent data protection laws (GDPR) and increasing adoption of BYOD policies.
- Dominant Application Segment: Laptops (xx Million units in 2025) driven by increasing work-from-home trends and the need for secure remote access.
- Dominant Feature Segment: Adhesive (xx Million units in 2025) due to ease of application and affordability.
Privacy Filters Industry Product Landscape
The privacy filter market offers a diverse range of products catering to various screen sizes and applications. Innovations include improved adhesive technologies for easier application and removal, anti-glare coatings for enhanced visual comfort, and magnetic attachments for seamless integration. Unique selling propositions often focus on enhanced privacy levels, improved screen clarity, and durability. Recent technological advancements involve integrating privacy filters with other protective features, such as scratch resistance and anti-fingerprint properties.
Key Drivers, Barriers & Challenges in Privacy Filters Industry
Key Drivers:
- Growing concerns over data breaches and cybersecurity threats.
- Increasing adoption of remote work and BYOD policies.
- Stringent data privacy regulations across various sectors.
Key Challenges:
- Competition from software-based privacy solutions.
- Supply chain disruptions impacting raw material availability and pricing.
- Balancing privacy protection with optimal screen visibility. (Estimated impact: xx% reduction in market growth in 2024)
Emerging Opportunities in Privacy Filters Industry
- Expansion into emerging markets with increasing internet and smartphone penetration.
- Development of privacy filters for augmented reality (AR) and virtual reality (VR) devices.
- Integration of privacy filters with other screen protection features, like anti-microbial coatings.
Growth Accelerators in the Privacy Filters Industry
The long-term growth of the privacy filters market is fueled by continuous innovation in material science, leading to filters with enhanced privacy and visual clarity. Strategic partnerships between filter manufacturers and device producers are also driving expansion. Moreover, the growing awareness of data security risks amongst consumers and organizations, combined with supportive regulatory frameworks, creates a favorable market environment.
Key Players Shaping the Privacy Filters Industry Market
- EPHY Privacy (Advance Services & Solutions Ltd)
- Fujitsu Limited
- KAPSOLO Europe ApS
- Fellowes Brands
- Tech Armor
- 3M Company
- Upscreen (Bedifol GmbH)
- Dell Inc
- Targus
- Kensington Computer Products Group (ACCO Brands)
- MoniFilm (Right Group Co Ltd)
Notable Milestones in Privacy Filters Industry Sector
- November 2022: GPOPlus signed a master services agreement with Tech Armor, expanding Tech Armor's B2B distribution network.
- October 2022: B. Riley Financial acquired Targus, strengthening Targus's position in the laptop accessories market.
In-Depth Privacy Filters Industry Market Outlook
The privacy filters market is poised for significant growth over the next decade, driven by increasing digitalization, heightened data privacy concerns, and advancements in filter technology. Strategic opportunities lie in expanding into untapped markets, developing innovative product features, and forging strategic partnerships to reach wider customer bases. The market shows potential for significant expansion and increased market penetration in regions with growing adoption of personal and professional devices.
Privacy Filters Industry Segmentation
-
1. Application
- 1.1. Laptops
- 1.2. Monitors
- 1.3. Smartphones
- 1.4. Tablets
-
2. Feature
- 2.1. Adhesive
- 2.2. Magnetic
- 2.3. Other Features
-
3. End-user Industry
- 3.1. Financial Institution
- 3.2. Educational Institution
- 3.3. Legal Firm
- 3.4. Government
- 3.5. Healthcare
- 3.6. Other End User Industries
Privacy Filters Industry Segmentation By Geography
- 1. North America
- 2. Europe
- 3. Asia
- 4. Australia and New Zealand
- 5. Latin America
- 6. Middle East and Africa
Privacy Filters Industry REPORT HIGHLIGHTS
| Aspects | Details |
|---|---|
| Study Period | 2019-2033 |
| Base Year | 2024 |
| Estimated Year | 2025 |
| Forecast Period | 2025-2033 |
| Historical Period | 2019-2024 |
| Growth Rate | CAGR of 12.96% from 2019-2033 |
| Segmentation |
|
Table of Contents
- 1. Introduction
- 1.1. Research Scope
- 1.2. Market Segmentation
- 1.3. Research Methodology
- 1.4. Definitions and Assumptions
- 2. Executive Summary
- 2.1. Introduction
- 3. Market Dynamics
- 3.1. Introduction
- 3.2. Market Drivers
- 3.2.1. Optical Comfort and Device Protection; Rising Data Privacy and Security Concerns
- 3.3. Market Restrains
- 3.3.1. Lack of Awareness about the Privacy Filters among the Users
- 3.4. Market Trends
- 3.4.1. Financial Institutions to Hold Major Share
- 4. Market Factor Analysis
- 4.1. Porters Five Forces
- 4.2. Supply/Value Chain
- 4.3. PESTEL analysis
- 4.4. Market Entropy
- 4.5. Patent/Trademark Analysis
- 5. Global Privacy Filters Industry Analysis, Insights and Forecast, 2019-2031
- 5.1. Market Analysis, Insights and Forecast - by Application
- 5.1.1. Laptops
- 5.1.2. Monitors
- 5.1.3. Smartphones
- 5.1.4. Tablets
- 5.2. Market Analysis, Insights and Forecast - by Feature
- 5.2.1. Adhesive
- 5.2.2. Magnetic
- 5.2.3. Other Features
- 5.3. Market Analysis, Insights and Forecast - by End-user Industry
- 5.3.1. Financial Institution
- 5.3.2. Educational Institution
- 5.3.3. Legal Firm
- 5.3.4. Government
- 5.3.5. Healthcare
- 5.3.6. Other End User Industries
- 5.4. Market Analysis, Insights and Forecast - by Region
- 5.4.1. North America
- 5.4.2. Europe
- 5.4.3. Asia
- 5.4.4. Australia and New Zealand
- 5.4.5. Latin America
- 5.4.6. Middle East and Africa
- 5.1. Market Analysis, Insights and Forecast - by Application
- 6. North America Privacy Filters Industry Analysis, Insights and Forecast, 2019-2031
- 6.1. Market Analysis, Insights and Forecast - by Application
- 6.1.1. Laptops
- 6.1.2. Monitors
- 6.1.3. Smartphones
- 6.1.4. Tablets
- 6.2. Market Analysis, Insights and Forecast - by Feature
- 6.2.1. Adhesive
- 6.2.2. Magnetic
- 6.2.3. Other Features
- 6.3. Market Analysis, Insights and Forecast - by End-user Industry
- 6.3.1. Financial Institution
- 6.3.2. Educational Institution
- 6.3.3. Legal Firm
- 6.3.4. Government
- 6.3.5. Healthcare
- 6.3.6. Other End User Industries
- 6.1. Market Analysis, Insights and Forecast - by Application
- 7. Europe Privacy Filters Industry Analysis, Insights and Forecast, 2019-2031
- 7.1. Market Analysis, Insights and Forecast - by Application
- 7.1.1. Laptops
- 7.1.2. Monitors
- 7.1.3. Smartphones
- 7.1.4. Tablets
- 7.2. Market Analysis, Insights and Forecast - by Feature
- 7.2.1. Adhesive
- 7.2.2. Magnetic
- 7.2.3. Other Features
- 7.3. Market Analysis, Insights and Forecast - by End-user Industry
- 7.3.1. Financial Institution
- 7.3.2. Educational Institution
- 7.3.3. Legal Firm
- 7.3.4. Government
- 7.3.5. Healthcare
- 7.3.6. Other End User Industries
- 7.1. Market Analysis, Insights and Forecast - by Application
- 8. Asia Privacy Filters Industry Analysis, Insights and Forecast, 2019-2031
- 8.1. Market Analysis, Insights and Forecast - by Application
- 8.1.1. Laptops
- 8.1.2. Monitors
- 8.1.3. Smartphones
- 8.1.4. Tablets
- 8.2. Market Analysis, Insights and Forecast - by Feature
- 8.2.1. Adhesive
- 8.2.2. Magnetic
- 8.2.3. Other Features
- 8.3. Market Analysis, Insights and Forecast - by End-user Industry
- 8.3.1. Financial Institution
- 8.3.2. Educational Institution
- 8.3.3. Legal Firm
- 8.3.4. Government
- 8.3.5. Healthcare
- 8.3.6. Other End User Industries
- 8.1. Market Analysis, Insights and Forecast - by Application
- 9. Australia and New Zealand Privacy Filters Industry Analysis, Insights and Forecast, 2019-2031
- 9.1. Market Analysis, Insights and Forecast - by Application
- 9.1.1. Laptops
- 9.1.2. Monitors
- 9.1.3. Smartphones
- 9.1.4. Tablets
- 9.2. Market Analysis, Insights and Forecast - by Feature
- 9.2.1. Adhesive
- 9.2.2. Magnetic
- 9.2.3. Other Features
- 9.3. Market Analysis, Insights and Forecast - by End-user Industry
- 9.3.1. Financial Institution
- 9.3.2. Educational Institution
- 9.3.3. Legal Firm
- 9.3.4. Government
- 9.3.5. Healthcare
- 9.3.6. Other End User Industries
- 9.1. Market Analysis, Insights and Forecast - by Application
- 10. Latin America Privacy Filters Industry Analysis, Insights and Forecast, 2019-2031
- 10.1. Market Analysis, Insights and Forecast - by Application
- 10.1.1. Laptops
- 10.1.2. Monitors
- 10.1.3. Smartphones
- 10.1.4. Tablets
- 10.2. Market Analysis, Insights and Forecast - by Feature
- 10.2.1. Adhesive
- 10.2.2. Magnetic
- 10.2.3. Other Features
- 10.3. Market Analysis, Insights and Forecast - by End-user Industry
- 10.3.1. Financial Institution
- 10.3.2. Educational Institution
- 10.3.3. Legal Firm
- 10.3.4. Government
- 10.3.5. Healthcare
- 10.3.6. Other End User Industries
- 10.1. Market Analysis, Insights and Forecast - by Application
- 11. Middle East and Africa Privacy Filters Industry Analysis, Insights and Forecast, 2019-2031
- 11.1. Market Analysis, Insights and Forecast - by Application
- 11.1.1. Laptops
- 11.1.2. Monitors
- 11.1.3. Smartphones
- 11.1.4. Tablets
- 11.2. Market Analysis, Insights and Forecast - by Feature
- 11.2.1. Adhesive
- 11.2.2. Magnetic
- 11.2.3. Other Features
- 11.3. Market Analysis, Insights and Forecast - by End-user Industry
- 11.3.1. Financial Institution
- 11.3.2. Educational Institution
- 11.3.3. Legal Firm
- 11.3.4. Government
- 11.3.5. Healthcare
- 11.3.6. Other End User Industries
- 11.1. Market Analysis, Insights and Forecast - by Application
- 12. North America Privacy Filters Industry Analysis, Insights and Forecast, 2019-2031
- 12.1. Market Analysis, Insights and Forecast - By Country/Sub-region
- 12.1.1 United States
- 12.1.2 Canada
- 12.1.3 Mexico
- 13. Europe Privacy Filters Industry Analysis, Insights and Forecast, 2019-2031
- 13.1. Market Analysis, Insights and Forecast - By Country/Sub-region
- 13.1.1 Germany
- 13.1.2 United Kingdom
- 13.1.3 France
- 13.1.4 Spain
- 13.1.5 Italy
- 13.1.6 Spain
- 13.1.7 Belgium
- 13.1.8 Netherland
- 13.1.9 Nordics
- 13.1.10 Rest of Europe
- 14. Asia Pacific Privacy Filters Industry Analysis, Insights and Forecast, 2019-2031
- 14.1. Market Analysis, Insights and Forecast - By Country/Sub-region
- 14.1.1 China
- 14.1.2 Japan
- 14.1.3 India
- 14.1.4 South Korea
- 14.1.5 Southeast Asia
- 14.1.6 Australia
- 14.1.7 Indonesia
- 14.1.8 Phillipes
- 14.1.9 Singapore
- 14.1.10 Thailandc
- 14.1.11 Rest of Asia Pacific
- 15. South America Privacy Filters Industry Analysis, Insights and Forecast, 2019-2031
- 15.1. Market Analysis, Insights and Forecast - By Country/Sub-region
- 15.1.1 Brazil
- 15.1.2 Argentina
- 15.1.3 Peru
- 15.1.4 Chile
- 15.1.5 Colombia
- 15.1.6 Ecuador
- 15.1.7 Venezuela
- 15.1.8 Rest of South America
- 16. North America Privacy Filters Industry Analysis, Insights and Forecast, 2019-2031
- 16.1. Market Analysis, Insights and Forecast - By Country/Sub-region
- 16.1.1 United States
- 16.1.2 Canada
- 16.1.3 Mexico
- 17. MEA Privacy Filters Industry Analysis, Insights and Forecast, 2019-2031
- 17.1. Market Analysis, Insights and Forecast - By Country/Sub-region
- 17.1.1 United Arab Emirates
- 17.1.2 Saudi Arabia
- 17.1.3 South Africa
- 17.1.4 Rest of Middle East and Africa
- 18. Competitive Analysis
- 18.1. Global Market Share Analysis 2024
- 18.2. Company Profiles
- 18.2.1 EPHY Privacy (Advance Services & Solutions Ltd)
- 18.2.1.1. Overview
- 18.2.1.2. Products
- 18.2.1.3. SWOT Analysis
- 18.2.1.4. Recent Developments
- 18.2.1.5. Financials (Based on Availability)
- 18.2.2 Fujitsu Limited*List Not Exhaustive
- 18.2.2.1. Overview
- 18.2.2.2. Products
- 18.2.2.3. SWOT Analysis
- 18.2.2.4. Recent Developments
- 18.2.2.5. Financials (Based on Availability)
- 18.2.3 KAPSOLO Europe ApS
- 18.2.3.1. Overview
- 18.2.3.2. Products
- 18.2.3.3. SWOT Analysis
- 18.2.3.4. Recent Developments
- 18.2.3.5. Financials (Based on Availability)
- 18.2.4 Fellowes Brands
- 18.2.4.1. Overview
- 18.2.4.2. Products
- 18.2.4.3. SWOT Analysis
- 18.2.4.4. Recent Developments
- 18.2.4.5. Financials (Based on Availability)
- 18.2.5 Tech Armor
- 18.2.5.1. Overview
- 18.2.5.2. Products
- 18.2.5.3. SWOT Analysis
- 18.2.5.4. Recent Developments
- 18.2.5.5. Financials (Based on Availability)
- 18.2.6 3M Company
- 18.2.6.1. Overview
- 18.2.6.2. Products
- 18.2.6.3. SWOT Analysis
- 18.2.6.4. Recent Developments
- 18.2.6.5. Financials (Based on Availability)
- 18.2.7 Upscreen (Bedifol GmbH)
- 18.2.7.1. Overview
- 18.2.7.2. Products
- 18.2.7.3. SWOT Analysis
- 18.2.7.4. Recent Developments
- 18.2.7.5. Financials (Based on Availability)
- 18.2.8 Dell Inc
- 18.2.8.1. Overview
- 18.2.8.2. Products
- 18.2.8.3. SWOT Analysis
- 18.2.8.4. Recent Developments
- 18.2.8.5. Financials (Based on Availability)
- 18.2.9 Targus
- 18.2.9.1. Overview
- 18.2.9.2. Products
- 18.2.9.3. SWOT Analysis
- 18.2.9.4. Recent Developments
- 18.2.9.5. Financials (Based on Availability)
- 18.2.10 Kensington Computer Products Group (ACCO Brands)
- 18.2.10.1. Overview
- 18.2.10.2. Products
- 18.2.10.3. SWOT Analysis
- 18.2.10.4. Recent Developments
- 18.2.10.5. Financials (Based on Availability)
- 18.2.11 MoniFilm (Right Group Co Ltd)
- 18.2.11.1. Overview
- 18.2.11.2. Products
- 18.2.11.3. SWOT Analysis
- 18.2.11.4. Recent Developments
- 18.2.11.5. Financials (Based on Availability)
- 18.2.1 EPHY Privacy (Advance Services & Solutions Ltd)
List of Figures
- Figure 1: Global Privacy Filters Industry Revenue Breakdown (Million, %) by Region 2024 & 2032
- Figure 2: North America Privacy Filters Industry Revenue (Million), by Country 2024 & 2032
- Figure 3: North America Privacy Filters Industry Revenue Share (%), by Country 2024 & 2032
- Figure 4: Europe Privacy Filters Industry Revenue (Million), by Country 2024 & 2032
- Figure 5: Europe Privacy Filters Industry Revenue Share (%), by Country 2024 & 2032
- Figure 6: Asia Pacific Privacy Filters Industry Revenue (Million), by Country 2024 & 2032
- Figure 7: Asia Pacific Privacy Filters Industry Revenue Share (%), by Country 2024 & 2032
- Figure 8: South America Privacy Filters Industry Revenue (Million), by Country 2024 & 2032
- Figure 9: South America Privacy Filters Industry Revenue Share (%), by Country 2024 & 2032
- Figure 10: North America Privacy Filters Industry Revenue (Million), by Country 2024 & 2032
- Figure 11: North America Privacy Filters Industry Revenue Share (%), by Country 2024 & 2032
- Figure 12: MEA Privacy Filters Industry Revenue (Million), by Country 2024 & 2032
- Figure 13: MEA Privacy Filters Industry Revenue Share (%), by Country 2024 & 2032
- Figure 14: North America Privacy Filters Industry Revenue (Million), by Application 2024 & 2032
- Figure 15: North America Privacy Filters Industry Revenue Share (%), by Application 2024 & 2032
- Figure 16: North America Privacy Filters Industry Revenue (Million), by Feature 2024 & 2032
- Figure 17: North America Privacy Filters Industry Revenue Share (%), by Feature 2024 & 2032
- Figure 18: North America Privacy Filters Industry Revenue (Million), by End-user Industry 2024 & 2032
- Figure 19: North America Privacy Filters Industry Revenue Share (%), by End-user Industry 2024 & 2032
- Figure 20: North America Privacy Filters Industry Revenue (Million), by Country 2024 & 2032
- Figure 21: North America Privacy Filters Industry Revenue Share (%), by Country 2024 & 2032
- Figure 22: Europe Privacy Filters Industry Revenue (Million), by Application 2024 & 2032
- Figure 23: Europe Privacy Filters Industry Revenue Share (%), by Application 2024 & 2032
- Figure 24: Europe Privacy Filters Industry Revenue (Million), by Feature 2024 & 2032
- Figure 25: Europe Privacy Filters Industry Revenue Share (%), by Feature 2024 & 2032
- Figure 26: Europe Privacy Filters Industry Revenue (Million), by End-user Industry 2024 & 2032
- Figure 27: Europe Privacy Filters Industry Revenue Share (%), by End-user Industry 2024 & 2032
- Figure 28: Europe Privacy Filters Industry Revenue (Million), by Country 2024 & 2032
- Figure 29: Europe Privacy Filters Industry Revenue Share (%), by Country 2024 & 2032
- Figure 30: Asia Privacy Filters Industry Revenue (Million), by Application 2024 & 2032
- Figure 31: Asia Privacy Filters Industry Revenue Share (%), by Application 2024 & 2032
- Figure 32: Asia Privacy Filters Industry Revenue (Million), by Feature 2024 & 2032
- Figure 33: Asia Privacy Filters Industry Revenue Share (%), by Feature 2024 & 2032
- Figure 34: Asia Privacy Filters Industry Revenue (Million), by End-user Industry 2024 & 2032
- Figure 35: Asia Privacy Filters Industry Revenue Share (%), by End-user Industry 2024 & 2032
- Figure 36: Asia Privacy Filters Industry Revenue (Million), by Country 2024 & 2032
- Figure 37: Asia Privacy Filters Industry Revenue Share (%), by Country 2024 & 2032
- Figure 38: Australia and New Zealand Privacy Filters Industry Revenue (Million), by Application 2024 & 2032
- Figure 39: Australia and New Zealand Privacy Filters Industry Revenue Share (%), by Application 2024 & 2032
- Figure 40: Australia and New Zealand Privacy Filters Industry Revenue (Million), by Feature 2024 & 2032
- Figure 41: Australia and New Zealand Privacy Filters Industry Revenue Share (%), by Feature 2024 & 2032
- Figure 42: Australia and New Zealand Privacy Filters Industry Revenue (Million), by End-user Industry 2024 & 2032
- Figure 43: Australia and New Zealand Privacy Filters Industry Revenue Share (%), by End-user Industry 2024 & 2032
- Figure 44: Australia and New Zealand Privacy Filters Industry Revenue (Million), by Country 2024 & 2032
- Figure 45: Australia and New Zealand Privacy Filters Industry Revenue Share (%), by Country 2024 & 2032
- Figure 46: Latin America Privacy Filters Industry Revenue (Million), by Application 2024 & 2032
- Figure 47: Latin America Privacy Filters Industry Revenue Share (%), by Application 2024 & 2032
- Figure 48: Latin America Privacy Filters Industry Revenue (Million), by Feature 2024 & 2032
- Figure 49: Latin America Privacy Filters Industry Revenue Share (%), by Feature 2024 & 2032
- Figure 50: Latin America Privacy Filters Industry Revenue (Million), by End-user Industry 2024 & 2032
- Figure 51: Latin America Privacy Filters Industry Revenue Share (%), by End-user Industry 2024 & 2032
- Figure 52: Latin America Privacy Filters Industry Revenue (Million), by Country 2024 & 2032
- Figure 53: Latin America Privacy Filters Industry Revenue Share (%), by Country 2024 & 2032
- Figure 54: Middle East and Africa Privacy Filters Industry Revenue (Million), by Application 2024 & 2032
- Figure 55: Middle East and Africa Privacy Filters Industry Revenue Share (%), by Application 2024 & 2032
- Figure 56: Middle East and Africa Privacy Filters Industry Revenue (Million), by Feature 2024 & 2032
- Figure 57: Middle East and Africa Privacy Filters Industry Revenue Share (%), by Feature 2024 & 2032
- Figure 58: Middle East and Africa Privacy Filters Industry Revenue (Million), by End-user Industry 2024 & 2032
- Figure 59: Middle East and Africa Privacy Filters Industry Revenue Share (%), by End-user Industry 2024 & 2032
- Figure 60: Middle East and Africa Privacy Filters Industry Revenue (Million), by Country 2024 & 2032
- Figure 61: Middle East and Africa Privacy Filters Industry Revenue Share (%), by Country 2024 & 2032
List of Tables
- Table 1: Global Privacy Filters Industry Revenue Million Forecast, by Region 2019 & 2032
- Table 2: Global Privacy Filters Industry Revenue Million Forecast, by Application 2019 & 2032
- Table 3: Global Privacy Filters Industry Revenue Million Forecast, by Feature 2019 & 2032
- Table 4: Global Privacy Filters Industry Revenue Million Forecast, by End-user Industry 2019 & 2032
- Table 5: Global Privacy Filters Industry Revenue Million Forecast, by Region 2019 & 2032
- Table 6: Global Privacy Filters Industry Revenue Million Forecast, by Country 2019 & 2032
- Table 7: United States Privacy Filters Industry Revenue (Million) Forecast, by Application 2019 & 2032
- Table 8: Canada Privacy Filters Industry Revenue (Million) Forecast, by Application 2019 & 2032
- Table 9: Mexico Privacy Filters Industry Revenue (Million) Forecast, by Application 2019 & 2032
- Table 10: Global Privacy Filters Industry Revenue Million Forecast, by Country 2019 & 2032
- Table 11: Germany Privacy Filters Industry Revenue (Million) Forecast, by Application 2019 & 2032
- Table 12: United Kingdom Privacy Filters Industry Revenue (Million) Forecast, by Application 2019 & 2032
- Table 13: France Privacy Filters Industry Revenue (Million) Forecast, by Application 2019 & 2032
- Table 14: Spain Privacy Filters Industry Revenue (Million) Forecast, by Application 2019 & 2032
- Table 15: Italy Privacy Filters Industry Revenue (Million) Forecast, by Application 2019 & 2032
- Table 16: Spain Privacy Filters Industry Revenue (Million) Forecast, by Application 2019 & 2032
- Table 17: Belgium Privacy Filters Industry Revenue (Million) Forecast, by Application 2019 & 2032
- Table 18: Netherland Privacy Filters Industry Revenue (Million) Forecast, by Application 2019 & 2032
- Table 19: Nordics Privacy Filters Industry Revenue (Million) Forecast, by Application 2019 & 2032
- Table 20: Rest of Europe Privacy Filters Industry Revenue (Million) Forecast, by Application 2019 & 2032
- Table 21: Global Privacy Filters Industry Revenue Million Forecast, by Country 2019 & 2032
- Table 22: China Privacy Filters Industry Revenue (Million) Forecast, by Application 2019 & 2032
- Table 23: Japan Privacy Filters Industry Revenue (Million) Forecast, by Application 2019 & 2032
- Table 24: India Privacy Filters Industry Revenue (Million) Forecast, by Application 2019 & 2032
- Table 25: South Korea Privacy Filters Industry Revenue (Million) Forecast, by Application 2019 & 2032
- Table 26: Southeast Asia Privacy Filters Industry Revenue (Million) Forecast, by Application 2019 & 2032
- Table 27: Australia Privacy Filters Industry Revenue (Million) Forecast, by Application 2019 & 2032
- Table 28: Indonesia Privacy Filters Industry Revenue (Million) Forecast, by Application 2019 & 2032
- Table 29: Phillipes Privacy Filters Industry Revenue (Million) Forecast, by Application 2019 & 2032
- Table 30: Singapore Privacy Filters Industry Revenue (Million) Forecast, by Application 2019 & 2032
- Table 31: Thailandc Privacy Filters Industry Revenue (Million) Forecast, by Application 2019 & 2032
- Table 32: Rest of Asia Pacific Privacy Filters Industry Revenue (Million) Forecast, by Application 2019 & 2032
- Table 33: Global Privacy Filters Industry Revenue Million Forecast, by Country 2019 & 2032
- Table 34: Brazil Privacy Filters Industry Revenue (Million) Forecast, by Application 2019 & 2032
- Table 35: Argentina Privacy Filters Industry Revenue (Million) Forecast, by Application 2019 & 2032
- Table 36: Peru Privacy Filters Industry Revenue (Million) Forecast, by Application 2019 & 2032
- Table 37: Chile Privacy Filters Industry Revenue (Million) Forecast, by Application 2019 & 2032
- Table 38: Colombia Privacy Filters Industry Revenue (Million) Forecast, by Application 2019 & 2032
- Table 39: Ecuador Privacy Filters Industry Revenue (Million) Forecast, by Application 2019 & 2032
- Table 40: Venezuela Privacy Filters Industry Revenue (Million) Forecast, by Application 2019 & 2032
- Table 41: Rest of South America Privacy Filters Industry Revenue (Million) Forecast, by Application 2019 & 2032
- Table 42: Global Privacy Filters Industry Revenue Million Forecast, by Country 2019 & 2032
- Table 43: United States Privacy Filters Industry Revenue (Million) Forecast, by Application 2019 & 2032
- Table 44: Canada Privacy Filters Industry Revenue (Million) Forecast, by Application 2019 & 2032
- Table 45: Mexico Privacy Filters Industry Revenue (Million) Forecast, by Application 2019 & 2032
- Table 46: Global Privacy Filters Industry Revenue Million Forecast, by Country 2019 & 2032
- Table 47: United Arab Emirates Privacy Filters Industry Revenue (Million) Forecast, by Application 2019 & 2032
- Table 48: Saudi Arabia Privacy Filters Industry Revenue (Million) Forecast, by Application 2019 & 2032
- Table 49: South Africa Privacy Filters Industry Revenue (Million) Forecast, by Application 2019 & 2032
- Table 50: Rest of Middle East and Africa Privacy Filters Industry Revenue (Million) Forecast, by Application 2019 & 2032
- Table 51: Global Privacy Filters Industry Revenue Million Forecast, by Application 2019 & 2032
- Table 52: Global Privacy Filters Industry Revenue Million Forecast, by Feature 2019 & 2032
- Table 53: Global Privacy Filters Industry Revenue Million Forecast, by End-user Industry 2019 & 2032
- Table 54: Global Privacy Filters Industry Revenue Million Forecast, by Country 2019 & 2032
- Table 55: Global Privacy Filters Industry Revenue Million Forecast, by Application 2019 & 2032
- Table 56: Global Privacy Filters Industry Revenue Million Forecast, by Feature 2019 & 2032
- Table 57: Global Privacy Filters Industry Revenue Million Forecast, by End-user Industry 2019 & 2032
- Table 58: Global Privacy Filters Industry Revenue Million Forecast, by Country 2019 & 2032
- Table 59: Global Privacy Filters Industry Revenue Million Forecast, by Application 2019 & 2032
- Table 60: Global Privacy Filters Industry Revenue Million Forecast, by Feature 2019 & 2032
- Table 61: Global Privacy Filters Industry Revenue Million Forecast, by End-user Industry 2019 & 2032
- Table 62: Global Privacy Filters Industry Revenue Million Forecast, by Country 2019 & 2032
- Table 63: Global Privacy Filters Industry Revenue Million Forecast, by Application 2019 & 2032
- Table 64: Global Privacy Filters Industry Revenue Million Forecast, by Feature 2019 & 2032
- Table 65: Global Privacy Filters Industry Revenue Million Forecast, by End-user Industry 2019 & 2032
- Table 66: Global Privacy Filters Industry Revenue Million Forecast, by Country 2019 & 2032
- Table 67: Global Privacy Filters Industry Revenue Million Forecast, by Application 2019 & 2032
- Table 68: Global Privacy Filters Industry Revenue Million Forecast, by Feature 2019 & 2032
- Table 69: Global Privacy Filters Industry Revenue Million Forecast, by End-user Industry 2019 & 2032
- Table 70: Global Privacy Filters Industry Revenue Million Forecast, by Country 2019 & 2032
- Table 71: Global Privacy Filters Industry Revenue Million Forecast, by Application 2019 & 2032
- Table 72: Global Privacy Filters Industry Revenue Million Forecast, by Feature 2019 & 2032
- Table 73: Global Privacy Filters Industry Revenue Million Forecast, by End-user Industry 2019 & 2032
- Table 74: Global Privacy Filters Industry Revenue Million Forecast, by Country 2019 & 2032
Frequently Asked Questions
1. What is the projected Compound Annual Growth Rate (CAGR) of the Privacy Filters Industry?
The projected CAGR is approximately 12.96%.
2. Which companies are prominent players in the Privacy Filters Industry?
Key companies in the market include EPHY Privacy (Advance Services & Solutions Ltd), Fujitsu Limited*List Not Exhaustive, KAPSOLO Europe ApS, Fellowes Brands, Tech Armor, 3M Company, Upscreen (Bedifol GmbH), Dell Inc, Targus, Kensington Computer Products Group (ACCO Brands), MoniFilm (Right Group Co Ltd).
3. What are the main segments of the Privacy Filters Industry?
The market segments include Application, Feature, End-user Industry.
4. Can you provide details about the market size?
The market size is estimated to be USD 1.22 Million as of 2022.
5. What are some drivers contributing to market growth?
Optical Comfort and Device Protection; Rising Data Privacy and Security Concerns.
6. What are the notable trends driving market growth?
Financial Institutions to Hold Major Share.
7. Are there any restraints impacting market growth?
Lack of Awareness about the Privacy Filters among the Users.
8. Can you provide examples of recent developments in the market?
November 2022- GPOPlus, a distribution company, signed a master services agreement with Tech Armor. Tech Armor's sales are Direct to Consumer (DTC). With this collaboration, DISTRO+ (GPOX's distribution division and GPO for specialty retailers) will expand its b2b business by selling to wholesalers and its nationwide network. This results in helping customers who want to buy Tech Armor products will be able to do so at their local retailer rather than only online.
9. What pricing options are available for accessing the report?
Pricing options include single-user, multi-user, and enterprise licenses priced at USD 4750, USD 5250, and USD 8750 respectively.
10. Is the market size provided in terms of value or volume?
The market size is provided in terms of value, measured in Million.
11. Are there any specific market keywords associated with the report?
Yes, the market keyword associated with the report is "Privacy Filters Industry," which aids in identifying and referencing the specific market segment covered.
12. How do I determine which pricing option suits my needs best?
The pricing options vary based on user requirements and access needs. Individual users may opt for single-user licenses, while businesses requiring broader access may choose multi-user or enterprise licenses for cost-effective access to the report.
13. Are there any additional resources or data provided in the Privacy Filters Industry report?
While the report offers comprehensive insights, it's advisable to review the specific contents or supplementary materials provided to ascertain if additional resources or data are available.
14. How can I stay updated on further developments or reports in the Privacy Filters Industry?
To stay informed about further developments, trends, and reports in the Privacy Filters Industry, consider subscribing to industry newsletters, following relevant companies and organizations, or regularly checking reputable industry news sources and publications.
Methodology
Step 1 - Identification of Relevant Samples Size from Population Database


Step 2 - Approaches for Defining Global Market Size (Value, Volume* & Price*)

Note*: In applicable scenarios
Step 3 - Data Sources
Primary Research
- Web Analytics
- Survey Reports
- Research Institute
- Latest Research Reports
- Opinion Leaders
Secondary Research
- Annual Reports
- White Paper
- Latest Press Release
- Industry Association
- Paid Database
- Investor Presentations

Step 4 - Data Triangulation
Involves using different sources of information in order to increase the validity of a study
These sources are likely to be stakeholders in a program - participants, other researchers, program staff, other community members, and so on.
Then we put all data in single framework & apply various statistical tools to find out the dynamic on the market.
During the analysis stage, feedback from the stakeholder groups would be compared to determine areas of agreement as well as areas of divergence
