

Key Insights
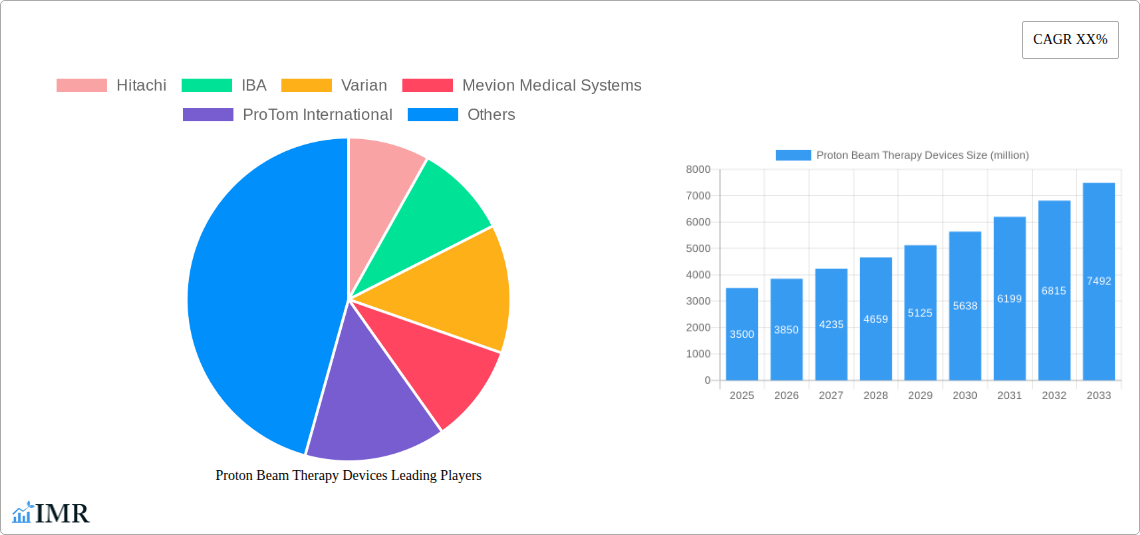
The global proton beam therapy devices market is experiencing robust growth, driven by increasing cancer incidence rates, advancements in technology leading to improved treatment efficacy and reduced side effects, and rising healthcare expenditure globally. The market's expansion is further fueled by the increasing adoption of proton therapy as a preferred treatment option for certain types of cancers, particularly in pediatric oncology where minimizing damage to surrounding healthy tissues is crucial. While high initial investment costs and limited availability of skilled professionals present challenges, ongoing technological innovations, such as compact and cost-effective systems, are mitigating these limitations. The market is segmented by device type (pencil beam scanning, passive scattering), application (pediatric oncology, prostate cancer, lung cancer, etc.), and geography. Key players like Hitachi, IBA, Varian, and Mevion Medical Systems are actively engaged in research and development, striving for improved treatment precision, shortened treatment times, and enhanced patient comfort. This competitive landscape drives innovation and fosters market expansion.
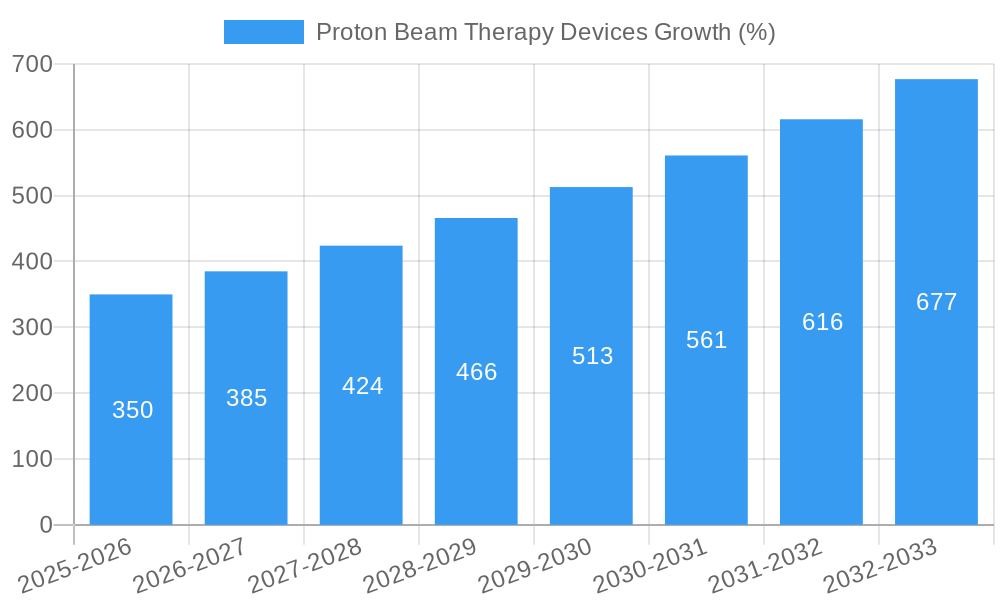
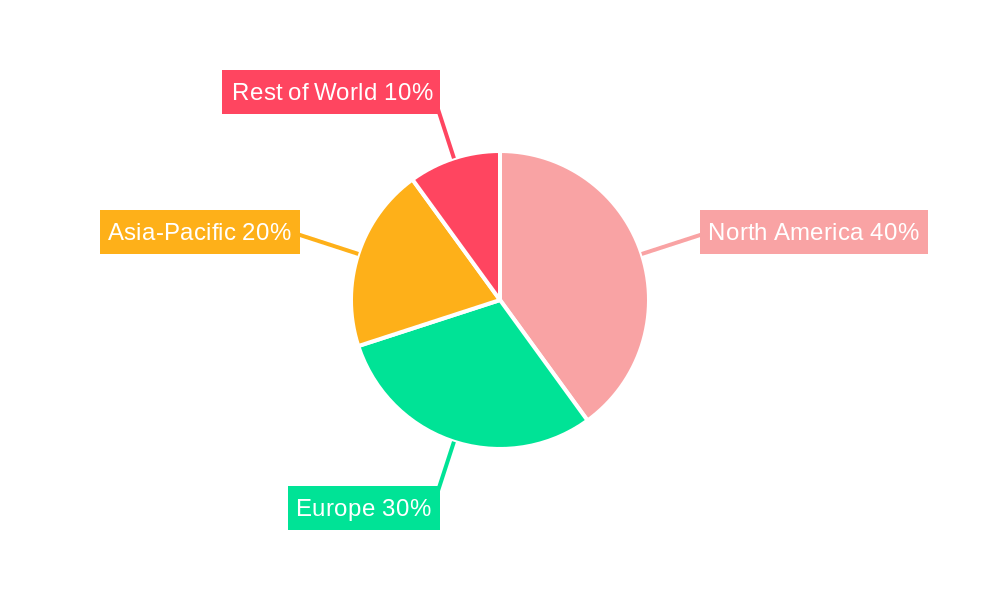
The forecast period (2025-2033) projects continued strong growth, potentially exceeding a Compound Annual Growth Rate (CAGR) of 10%, fueled by the factors mentioned above. This expansion will be witnessed across various regions, with North America and Europe maintaining significant market share due to established healthcare infrastructure and higher adoption rates. However, emerging markets in Asia-Pacific and Latin America are expected to show substantial growth potential owing to rising disposable incomes, growing awareness of advanced cancer treatments, and government initiatives to improve healthcare infrastructure. While the high cost remains a barrier to entry for some markets, the long-term outlook for the proton beam therapy market remains highly positive, indicating substantial opportunities for market participants in the coming years.
Proton Beam Therapy Devices Market Report: 2019-2033
This comprehensive report provides a detailed analysis of the global Proton Beam Therapy Devices market, encompassing market dynamics, growth trends, regional insights, product landscape, and key players. The study period covers 2019-2033, with 2025 as the base and estimated year. The forecast period spans 2025-2033, and the historical period covers 2019-2024. This report is an essential resource for industry professionals, investors, and stakeholders seeking to understand and capitalize on the opportunities within this rapidly evolving sector. The parent market is the radiation therapy equipment market, and the child market is the advanced radiation therapy equipment market.
Proton Beam Therapy Devices Market Dynamics & Structure
The global Proton Beam Therapy Devices market is characterized by moderate concentration, with key players such as Hitachi, IBA, Varian, Mevion Medical Systems, ProTom International, Sumitomo Heavy Industries, ProNova Solutions, and Optivus Proton Therapy holding significant market share. The market is driven by technological advancements in proton therapy delivery systems, increasing cancer prevalence, and rising demand for precise and targeted cancer treatment. Regulatory approvals and reimbursement policies also play a crucial role. Competition is intense, driven by innovation in treatment delivery, cost-effectiveness, and superior clinical outcomes. M&A activity has been relatively moderate in recent years, with approximately xx deals recorded between 2019-2024, resulting in a xx% increase in market consolidation.
- Market Concentration: Moderately concentrated, with top 5 players holding approximately xx% market share in 2024.
- Technological Innovation: Focus on compact systems, pencil beam scanning, and image-guided radiotherapy (IGRT) integration.
- Regulatory Framework: Stringent regulatory approvals impacting market entry and expansion.
- Competitive Substitutes: Conventional radiation therapy, other advanced therapies (e.g., immunotherapy).
- End-User Demographics: Primarily hospitals, cancer centers, and specialized clinics.
- M&A Trends: Consolidation expected to continue, driven by economies of scale and technological advancements.
Proton Beam Therapy Devices Growth Trends & Insights
The global Proton Beam Therapy Devices market experienced robust growth during the historical period (2019-2024), with a CAGR of xx%. This growth is attributed to the increasing adoption of proton therapy as a preferred cancer treatment modality due to its improved efficacy and reduced side effects compared to conventional radiotherapy. Market penetration has been significant in developed regions, with growth potential in emerging markets. Technological advancements, such as the development of compact and cost-effective systems, further fuel market expansion. Furthermore, increasing awareness among both healthcare professionals and patients regarding the benefits of proton beam therapy contributes to market expansion. The estimated market size in 2025 is xx million units, with projections indicating a CAGR of xx% during the forecast period (2025-2033), reaching xx million units by 2033. This growth is mainly attributed to increased investment in healthcare infrastructure, favorable reimbursement policies, and an aging population susceptible to cancer.
Dominant Regions, Countries, or Segments in Proton Beam Therapy Devices
North America currently dominates the Proton Beam Therapy Devices market, holding the largest market share in 2024 (approximately xx%). This dominance is driven by factors such as high healthcare expenditure, advanced healthcare infrastructure, early adoption of advanced technologies, and a large number of cancer treatment centers. Europe follows as the second-largest market, exhibiting substantial growth potential due to increasing cancer prevalence and government support for advanced medical technologies. Asia-Pacific is witnessing rapid growth, driven by rising disposable incomes, increasing awareness of proton therapy benefits, and supportive government initiatives.
- North America: High healthcare expenditure, advanced infrastructure, early technology adoption.
- Europe: Increasing cancer prevalence, government support for advanced medical technologies.
- Asia-Pacific: Rising disposable incomes, growing awareness of proton therapy benefits.
- Rest of the World: Moderate growth potential driven by emerging markets.
Proton Beam Therapy Devices Product Landscape
The Proton Beam Therapy Devices market encompasses a range of products, including cyclotrons, synchrotrons, and gantries, each with unique features and functionalities. Recent innovations focus on compact systems, improved beam delivery techniques (e.g., pencil beam scanning), and seamless integration with image-guided radiotherapy (IGRT). These advancements enhance treatment precision, reduce treatment time, and improve clinical outcomes. Key selling propositions include improved tumor targeting, reduced side effects, and enhanced patient comfort.
Key Drivers, Barriers & Challenges in Proton Beam Therapy Devices
Key Drivers:
- Increasing cancer incidence and prevalence globally.
- Growing demand for precise and targeted cancer therapies.
- Technological advancements leading to compact and cost-effective systems.
- Favorable reimbursement policies in developed countries.
Challenges and Restraints:
- High initial investment costs associated with proton therapy facilities.
- Limited availability of skilled professionals for operation and maintenance.
- Stringent regulatory requirements for market entry and approval.
- Intense competition among existing and emerging players. This competition leads to price pressure, resulting in a xx% reduction in average selling price over the forecast period.
Emerging Opportunities in Proton Beam Therapy Devices
- Expanding into emerging markets with unmet needs.
- Development of novel applications for proton therapy in other medical areas.
- Focus on improving patient experience and reducing treatment time.
- Development of AI-driven solutions for treatment planning and delivery.
Growth Accelerators in the Proton Beam Therapy Devices Industry
Long-term growth in the Proton Beam Therapy Devices market will be driven by continuous technological advancements, strategic partnerships between device manufacturers and healthcare providers, and expansion into new geographical markets. Furthermore, increasing collaborations between research institutions and industry players will accelerate the development of innovative proton therapy technologies and expand market opportunities.
Key Players Shaping the Proton Beam Therapy Devices Market
- Hitachi
- IBA
- Varian
- Mevion Medical Systems
- ProTom International
- Sumitomo Heavy Industries
- ProNova Solutions
- Optivus Proton Therapy
Notable Milestones in Proton Beam Therapy Devices Sector
- 2020: Mevion Medical Systems launched its next-generation proton therapy system.
- 2021: IBA announced a significant expansion of its global presence.
- 2022: Varian secured multiple contracts for proton therapy systems installation.
- 2023: Hitachi announced a new collaboration to advance proton therapy technology.
- 2024: Several new clinical trials using proton beam therapy were initiated.
In-Depth Proton Beam Therapy Devices Market Outlook
The future of the Proton Beam Therapy Devices market is promising, driven by continuous innovation, expanding applications, and increasing adoption in both developed and emerging economies. Strategic partnerships and collaborations will be crucial for sustained growth. The market is expected to witness significant expansion, with further technological advancements paving the way for more accessible and cost-effective proton therapy solutions. This will enhance treatment availability for patients worldwide.
Proton Beam Therapy Devices Segmentation
-
1. Application
- 1.1. Hosptials
- 1.2. Proton Treatment Center
- 1.3. Other
-
2. Types
- 2.1. Proton Therapy Systems with Robotized Positioning Table
- 2.2. Proton Therapy Systems with Integrated CT Scanner
- 2.3. Proton Therapy Systems with Integrated PET Scanner
Proton Beam Therapy Devices Segmentation By Geography
-
1. North America
- 1.1. United States
- 1.2. Canada
- 1.3. Mexico
-
2. South America
- 2.1. Brazil
- 2.2. Argentina
- 2.3. Rest of South America
-
3. Europe
- 3.1. United Kingdom
- 3.2. Germany
- 3.3. France
- 3.4. Italy
- 3.5. Spain
- 3.6. Russia
- 3.7. Benelux
- 3.8. Nordics
- 3.9. Rest of Europe
-
4. Middle East & Africa
- 4.1. Turkey
- 4.2. Israel
- 4.3. GCC
- 4.4. North Africa
- 4.5. South Africa
- 4.6. Rest of Middle East & Africa
-
5. Asia Pacific
- 5.1. China
- 5.2. India
- 5.3. Japan
- 5.4. South Korea
- 5.5. ASEAN
- 5.6. Oceania
- 5.7. Rest of Asia Pacific
Proton Beam Therapy Devices REPORT HIGHLIGHTS
| Aspects | Details |
|---|---|
| Study Period | 2019-2033 |
| Base Year | 2024 |
| Estimated Year | 2025 |
| Forecast Period | 2025-2033 |
| Historical Period | 2019-2024 |
| Growth Rate | CAGR of XX% from 2019-2033 |
| Segmentation |
|
Table of Contents
- 1. Introduction
- 1.1. Research Scope
- 1.2. Market Segmentation
- 1.3. Research Methodology
- 1.4. Definitions and Assumptions
- 2. Executive Summary
- 2.1. Introduction
- 3. Market Dynamics
- 3.1. Introduction
- 3.2. Market Drivers
- 3.3. Market Restrains
- 3.4. Market Trends
- 4. Market Factor Analysis
- 4.1. Porters Five Forces
- 4.2. Supply/Value Chain
- 4.3. PESTEL analysis
- 4.4. Market Entropy
- 4.5. Patent/Trademark Analysis
- 5. Global Proton Beam Therapy Devices Analysis, Insights and Forecast, 2019-2031
- 5.1. Market Analysis, Insights and Forecast - by Application
- 5.1.1. Hosptials
- 5.1.2. Proton Treatment Center
- 5.1.3. Other
- 5.2. Market Analysis, Insights and Forecast - by Types
- 5.2.1. Proton Therapy Systems with Robotized Positioning Table
- 5.2.2. Proton Therapy Systems with Integrated CT Scanner
- 5.2.3. Proton Therapy Systems with Integrated PET Scanner
- 5.3. Market Analysis, Insights and Forecast - by Region
- 5.3.1. North America
- 5.3.2. South America
- 5.3.3. Europe
- 5.3.4. Middle East & Africa
- 5.3.5. Asia Pacific
- 5.1. Market Analysis, Insights and Forecast - by Application
- 6. North America Proton Beam Therapy Devices Analysis, Insights and Forecast, 2019-2031
- 6.1. Market Analysis, Insights and Forecast - by Application
- 6.1.1. Hosptials
- 6.1.2. Proton Treatment Center
- 6.1.3. Other
- 6.2. Market Analysis, Insights and Forecast - by Types
- 6.2.1. Proton Therapy Systems with Robotized Positioning Table
- 6.2.2. Proton Therapy Systems with Integrated CT Scanner
- 6.2.3. Proton Therapy Systems with Integrated PET Scanner
- 6.1. Market Analysis, Insights and Forecast - by Application
- 7. South America Proton Beam Therapy Devices Analysis, Insights and Forecast, 2019-2031
- 7.1. Market Analysis, Insights and Forecast - by Application
- 7.1.1. Hosptials
- 7.1.2. Proton Treatment Center
- 7.1.3. Other
- 7.2. Market Analysis, Insights and Forecast - by Types
- 7.2.1. Proton Therapy Systems with Robotized Positioning Table
- 7.2.2. Proton Therapy Systems with Integrated CT Scanner
- 7.2.3. Proton Therapy Systems with Integrated PET Scanner
- 7.1. Market Analysis, Insights and Forecast - by Application
- 8. Europe Proton Beam Therapy Devices Analysis, Insights and Forecast, 2019-2031
- 8.1. Market Analysis, Insights and Forecast - by Application
- 8.1.1. Hosptials
- 8.1.2. Proton Treatment Center
- 8.1.3. Other
- 8.2. Market Analysis, Insights and Forecast - by Types
- 8.2.1. Proton Therapy Systems with Robotized Positioning Table
- 8.2.2. Proton Therapy Systems with Integrated CT Scanner
- 8.2.3. Proton Therapy Systems with Integrated PET Scanner
- 8.1. Market Analysis, Insights and Forecast - by Application
- 9. Middle East & Africa Proton Beam Therapy Devices Analysis, Insights and Forecast, 2019-2031
- 9.1. Market Analysis, Insights and Forecast - by Application
- 9.1.1. Hosptials
- 9.1.2. Proton Treatment Center
- 9.1.3. Other
- 9.2. Market Analysis, Insights and Forecast - by Types
- 9.2.1. Proton Therapy Systems with Robotized Positioning Table
- 9.2.2. Proton Therapy Systems with Integrated CT Scanner
- 9.2.3. Proton Therapy Systems with Integrated PET Scanner
- 9.1. Market Analysis, Insights and Forecast - by Application
- 10. Asia Pacific Proton Beam Therapy Devices Analysis, Insights and Forecast, 2019-2031
- 10.1. Market Analysis, Insights and Forecast - by Application
- 10.1.1. Hosptials
- 10.1.2. Proton Treatment Center
- 10.1.3. Other
- 10.2. Market Analysis, Insights and Forecast - by Types
- 10.2.1. Proton Therapy Systems with Robotized Positioning Table
- 10.2.2. Proton Therapy Systems with Integrated CT Scanner
- 10.2.3. Proton Therapy Systems with Integrated PET Scanner
- 10.1. Market Analysis, Insights and Forecast - by Application
- 11. Competitive Analysis
- 11.1. Global Market Share Analysis 2024
- 11.2. Company Profiles
- 11.2.1 Hitachi
- 11.2.1.1. Overview
- 11.2.1.2. Products
- 11.2.1.3. SWOT Analysis
- 11.2.1.4. Recent Developments
- 11.2.1.5. Financials (Based on Availability)
- 11.2.2 IBA
- 11.2.2.1. Overview
- 11.2.2.2. Products
- 11.2.2.3. SWOT Analysis
- 11.2.2.4. Recent Developments
- 11.2.2.5. Financials (Based on Availability)
- 11.2.3 Varian
- 11.2.3.1. Overview
- 11.2.3.2. Products
- 11.2.3.3. SWOT Analysis
- 11.2.3.4. Recent Developments
- 11.2.3.5. Financials (Based on Availability)
- 11.2.4 Mevion Medical Systems
- 11.2.4.1. Overview
- 11.2.4.2. Products
- 11.2.4.3. SWOT Analysis
- 11.2.4.4. Recent Developments
- 11.2.4.5. Financials (Based on Availability)
- 11.2.5 ProTom International
- 11.2.5.1. Overview
- 11.2.5.2. Products
- 11.2.5.3. SWOT Analysis
- 11.2.5.4. Recent Developments
- 11.2.5.5. Financials (Based on Availability)
- 11.2.6 Sumitomo Heavy Industries
- 11.2.6.1. Overview
- 11.2.6.2. Products
- 11.2.6.3. SWOT Analysis
- 11.2.6.4. Recent Developments
- 11.2.6.5. Financials (Based on Availability)
- 11.2.7 ProNova Solutions
- 11.2.7.1. Overview
- 11.2.7.2. Products
- 11.2.7.3. SWOT Analysis
- 11.2.7.4. Recent Developments
- 11.2.7.5. Financials (Based on Availability)
- 11.2.8 Optivus Proton Therapy
- 11.2.8.1. Overview
- 11.2.8.2. Products
- 11.2.8.3. SWOT Analysis
- 11.2.8.4. Recent Developments
- 11.2.8.5. Financials (Based on Availability)
- 11.2.1 Hitachi
List of Figures
- Figure 1: Global Proton Beam Therapy Devices Revenue Breakdown (million, %) by Region 2024 & 2032
- Figure 2: Global Proton Beam Therapy Devices Volume Breakdown (K, %) by Region 2024 & 2032
- Figure 3: North America Proton Beam Therapy Devices Revenue (million), by Application 2024 & 2032
- Figure 4: North America Proton Beam Therapy Devices Volume (K), by Application 2024 & 2032
- Figure 5: North America Proton Beam Therapy Devices Revenue Share (%), by Application 2024 & 2032
- Figure 6: North America Proton Beam Therapy Devices Volume Share (%), by Application 2024 & 2032
- Figure 7: North America Proton Beam Therapy Devices Revenue (million), by Types 2024 & 2032
- Figure 8: North America Proton Beam Therapy Devices Volume (K), by Types 2024 & 2032
- Figure 9: North America Proton Beam Therapy Devices Revenue Share (%), by Types 2024 & 2032
- Figure 10: North America Proton Beam Therapy Devices Volume Share (%), by Types 2024 & 2032
- Figure 11: North America Proton Beam Therapy Devices Revenue (million), by Country 2024 & 2032
- Figure 12: North America Proton Beam Therapy Devices Volume (K), by Country 2024 & 2032
- Figure 13: North America Proton Beam Therapy Devices Revenue Share (%), by Country 2024 & 2032
- Figure 14: North America Proton Beam Therapy Devices Volume Share (%), by Country 2024 & 2032
- Figure 15: South America Proton Beam Therapy Devices Revenue (million), by Application 2024 & 2032
- Figure 16: South America Proton Beam Therapy Devices Volume (K), by Application 2024 & 2032
- Figure 17: South America Proton Beam Therapy Devices Revenue Share (%), by Application 2024 & 2032
- Figure 18: South America Proton Beam Therapy Devices Volume Share (%), by Application 2024 & 2032
- Figure 19: South America Proton Beam Therapy Devices Revenue (million), by Types 2024 & 2032
- Figure 20: South America Proton Beam Therapy Devices Volume (K), by Types 2024 & 2032
- Figure 21: South America Proton Beam Therapy Devices Revenue Share (%), by Types 2024 & 2032
- Figure 22: South America Proton Beam Therapy Devices Volume Share (%), by Types 2024 & 2032
- Figure 23: South America Proton Beam Therapy Devices Revenue (million), by Country 2024 & 2032
- Figure 24: South America Proton Beam Therapy Devices Volume (K), by Country 2024 & 2032
- Figure 25: South America Proton Beam Therapy Devices Revenue Share (%), by Country 2024 & 2032
- Figure 26: South America Proton Beam Therapy Devices Volume Share (%), by Country 2024 & 2032
- Figure 27: Europe Proton Beam Therapy Devices Revenue (million), by Application 2024 & 2032
- Figure 28: Europe Proton Beam Therapy Devices Volume (K), by Application 2024 & 2032
- Figure 29: Europe Proton Beam Therapy Devices Revenue Share (%), by Application 2024 & 2032
- Figure 30: Europe Proton Beam Therapy Devices Volume Share (%), by Application 2024 & 2032
- Figure 31: Europe Proton Beam Therapy Devices Revenue (million), by Types 2024 & 2032
- Figure 32: Europe Proton Beam Therapy Devices Volume (K), by Types 2024 & 2032
- Figure 33: Europe Proton Beam Therapy Devices Revenue Share (%), by Types 2024 & 2032
- Figure 34: Europe Proton Beam Therapy Devices Volume Share (%), by Types 2024 & 2032
- Figure 35: Europe Proton Beam Therapy Devices Revenue (million), by Country 2024 & 2032
- Figure 36: Europe Proton Beam Therapy Devices Volume (K), by Country 2024 & 2032
- Figure 37: Europe Proton Beam Therapy Devices Revenue Share (%), by Country 2024 & 2032
- Figure 38: Europe Proton Beam Therapy Devices Volume Share (%), by Country 2024 & 2032
- Figure 39: Middle East & Africa Proton Beam Therapy Devices Revenue (million), by Application 2024 & 2032
- Figure 40: Middle East & Africa Proton Beam Therapy Devices Volume (K), by Application 2024 & 2032
- Figure 41: Middle East & Africa Proton Beam Therapy Devices Revenue Share (%), by Application 2024 & 2032
- Figure 42: Middle East & Africa Proton Beam Therapy Devices Volume Share (%), by Application 2024 & 2032
- Figure 43: Middle East & Africa Proton Beam Therapy Devices Revenue (million), by Types 2024 & 2032
- Figure 44: Middle East & Africa Proton Beam Therapy Devices Volume (K), by Types 2024 & 2032
- Figure 45: Middle East & Africa Proton Beam Therapy Devices Revenue Share (%), by Types 2024 & 2032
- Figure 46: Middle East & Africa Proton Beam Therapy Devices Volume Share (%), by Types 2024 & 2032
- Figure 47: Middle East & Africa Proton Beam Therapy Devices Revenue (million), by Country 2024 & 2032
- Figure 48: Middle East & Africa Proton Beam Therapy Devices Volume (K), by Country 2024 & 2032
- Figure 49: Middle East & Africa Proton Beam Therapy Devices Revenue Share (%), by Country 2024 & 2032
- Figure 50: Middle East & Africa Proton Beam Therapy Devices Volume Share (%), by Country 2024 & 2032
- Figure 51: Asia Pacific Proton Beam Therapy Devices Revenue (million), by Application 2024 & 2032
- Figure 52: Asia Pacific Proton Beam Therapy Devices Volume (K), by Application 2024 & 2032
- Figure 53: Asia Pacific Proton Beam Therapy Devices Revenue Share (%), by Application 2024 & 2032
- Figure 54: Asia Pacific Proton Beam Therapy Devices Volume Share (%), by Application 2024 & 2032
- Figure 55: Asia Pacific Proton Beam Therapy Devices Revenue (million), by Types 2024 & 2032
- Figure 56: Asia Pacific Proton Beam Therapy Devices Volume (K), by Types 2024 & 2032
- Figure 57: Asia Pacific Proton Beam Therapy Devices Revenue Share (%), by Types 2024 & 2032
- Figure 58: Asia Pacific Proton Beam Therapy Devices Volume Share (%), by Types 2024 & 2032
- Figure 59: Asia Pacific Proton Beam Therapy Devices Revenue (million), by Country 2024 & 2032
- Figure 60: Asia Pacific Proton Beam Therapy Devices Volume (K), by Country 2024 & 2032
- Figure 61: Asia Pacific Proton Beam Therapy Devices Revenue Share (%), by Country 2024 & 2032
- Figure 62: Asia Pacific Proton Beam Therapy Devices Volume Share (%), by Country 2024 & 2032
List of Tables
- Table 1: Global Proton Beam Therapy Devices Revenue million Forecast, by Region 2019 & 2032
- Table 2: Global Proton Beam Therapy Devices Volume K Forecast, by Region 2019 & 2032
- Table 3: Global Proton Beam Therapy Devices Revenue million Forecast, by Application 2019 & 2032
- Table 4: Global Proton Beam Therapy Devices Volume K Forecast, by Application 2019 & 2032
- Table 5: Global Proton Beam Therapy Devices Revenue million Forecast, by Types 2019 & 2032
- Table 6: Global Proton Beam Therapy Devices Volume K Forecast, by Types 2019 & 2032
- Table 7: Global Proton Beam Therapy Devices Revenue million Forecast, by Region 2019 & 2032
- Table 8: Global Proton Beam Therapy Devices Volume K Forecast, by Region 2019 & 2032
- Table 9: Global Proton Beam Therapy Devices Revenue million Forecast, by Application 2019 & 2032
- Table 10: Global Proton Beam Therapy Devices Volume K Forecast, by Application 2019 & 2032
- Table 11: Global Proton Beam Therapy Devices Revenue million Forecast, by Types 2019 & 2032
- Table 12: Global Proton Beam Therapy Devices Volume K Forecast, by Types 2019 & 2032
- Table 13: Global Proton Beam Therapy Devices Revenue million Forecast, by Country 2019 & 2032
- Table 14: Global Proton Beam Therapy Devices Volume K Forecast, by Country 2019 & 2032
- Table 15: United States Proton Beam Therapy Devices Revenue (million) Forecast, by Application 2019 & 2032
- Table 16: United States Proton Beam Therapy Devices Volume (K) Forecast, by Application 2019 & 2032
- Table 17: Canada Proton Beam Therapy Devices Revenue (million) Forecast, by Application 2019 & 2032
- Table 18: Canada Proton Beam Therapy Devices Volume (K) Forecast, by Application 2019 & 2032
- Table 19: Mexico Proton Beam Therapy Devices Revenue (million) Forecast, by Application 2019 & 2032
- Table 20: Mexico Proton Beam Therapy Devices Volume (K) Forecast, by Application 2019 & 2032
- Table 21: Global Proton Beam Therapy Devices Revenue million Forecast, by Application 2019 & 2032
- Table 22: Global Proton Beam Therapy Devices Volume K Forecast, by Application 2019 & 2032
- Table 23: Global Proton Beam Therapy Devices Revenue million Forecast, by Types 2019 & 2032
- Table 24: Global Proton Beam Therapy Devices Volume K Forecast, by Types 2019 & 2032
- Table 25: Global Proton Beam Therapy Devices Revenue million Forecast, by Country 2019 & 2032
- Table 26: Global Proton Beam Therapy Devices Volume K Forecast, by Country 2019 & 2032
- Table 27: Brazil Proton Beam Therapy Devices Revenue (million) Forecast, by Application 2019 & 2032
- Table 28: Brazil Proton Beam Therapy Devices Volume (K) Forecast, by Application 2019 & 2032
- Table 29: Argentina Proton Beam Therapy Devices Revenue (million) Forecast, by Application 2019 & 2032
- Table 30: Argentina Proton Beam Therapy Devices Volume (K) Forecast, by Application 2019 & 2032
- Table 31: Rest of South America Proton Beam Therapy Devices Revenue (million) Forecast, by Application 2019 & 2032
- Table 32: Rest of South America Proton Beam Therapy Devices Volume (K) Forecast, by Application 2019 & 2032
- Table 33: Global Proton Beam Therapy Devices Revenue million Forecast, by Application 2019 & 2032
- Table 34: Global Proton Beam Therapy Devices Volume K Forecast, by Application 2019 & 2032
- Table 35: Global Proton Beam Therapy Devices Revenue million Forecast, by Types 2019 & 2032
- Table 36: Global Proton Beam Therapy Devices Volume K Forecast, by Types 2019 & 2032
- Table 37: Global Proton Beam Therapy Devices Revenue million Forecast, by Country 2019 & 2032
- Table 38: Global Proton Beam Therapy Devices Volume K Forecast, by Country 2019 & 2032
- Table 39: United Kingdom Proton Beam Therapy Devices Revenue (million) Forecast, by Application 2019 & 2032
- Table 40: United Kingdom Proton Beam Therapy Devices Volume (K) Forecast, by Application 2019 & 2032
- Table 41: Germany Proton Beam Therapy Devices Revenue (million) Forecast, by Application 2019 & 2032
- Table 42: Germany Proton Beam Therapy Devices Volume (K) Forecast, by Application 2019 & 2032
- Table 43: France Proton Beam Therapy Devices Revenue (million) Forecast, by Application 2019 & 2032
- Table 44: France Proton Beam Therapy Devices Volume (K) Forecast, by Application 2019 & 2032
- Table 45: Italy Proton Beam Therapy Devices Revenue (million) Forecast, by Application 2019 & 2032
- Table 46: Italy Proton Beam Therapy Devices Volume (K) Forecast, by Application 2019 & 2032
- Table 47: Spain Proton Beam Therapy Devices Revenue (million) Forecast, by Application 2019 & 2032
- Table 48: Spain Proton Beam Therapy Devices Volume (K) Forecast, by Application 2019 & 2032
- Table 49: Russia Proton Beam Therapy Devices Revenue (million) Forecast, by Application 2019 & 2032
- Table 50: Russia Proton Beam Therapy Devices Volume (K) Forecast, by Application 2019 & 2032
- Table 51: Benelux Proton Beam Therapy Devices Revenue (million) Forecast, by Application 2019 & 2032
- Table 52: Benelux Proton Beam Therapy Devices Volume (K) Forecast, by Application 2019 & 2032
- Table 53: Nordics Proton Beam Therapy Devices Revenue (million) Forecast, by Application 2019 & 2032
- Table 54: Nordics Proton Beam Therapy Devices Volume (K) Forecast, by Application 2019 & 2032
- Table 55: Rest of Europe Proton Beam Therapy Devices Revenue (million) Forecast, by Application 2019 & 2032
- Table 56: Rest of Europe Proton Beam Therapy Devices Volume (K) Forecast, by Application 2019 & 2032
- Table 57: Global Proton Beam Therapy Devices Revenue million Forecast, by Application 2019 & 2032
- Table 58: Global Proton Beam Therapy Devices Volume K Forecast, by Application 2019 & 2032
- Table 59: Global Proton Beam Therapy Devices Revenue million Forecast, by Types 2019 & 2032
- Table 60: Global Proton Beam Therapy Devices Volume K Forecast, by Types 2019 & 2032
- Table 61: Global Proton Beam Therapy Devices Revenue million Forecast, by Country 2019 & 2032
- Table 62: Global Proton Beam Therapy Devices Volume K Forecast, by Country 2019 & 2032
- Table 63: Turkey Proton Beam Therapy Devices Revenue (million) Forecast, by Application 2019 & 2032
- Table 64: Turkey Proton Beam Therapy Devices Volume (K) Forecast, by Application 2019 & 2032
- Table 65: Israel Proton Beam Therapy Devices Revenue (million) Forecast, by Application 2019 & 2032
- Table 66: Israel Proton Beam Therapy Devices Volume (K) Forecast, by Application 2019 & 2032
- Table 67: GCC Proton Beam Therapy Devices Revenue (million) Forecast, by Application 2019 & 2032
- Table 68: GCC Proton Beam Therapy Devices Volume (K) Forecast, by Application 2019 & 2032
- Table 69: North Africa Proton Beam Therapy Devices Revenue (million) Forecast, by Application 2019 & 2032
- Table 70: North Africa Proton Beam Therapy Devices Volume (K) Forecast, by Application 2019 & 2032
- Table 71: South Africa Proton Beam Therapy Devices Revenue (million) Forecast, by Application 2019 & 2032
- Table 72: South Africa Proton Beam Therapy Devices Volume (K) Forecast, by Application 2019 & 2032
- Table 73: Rest of Middle East & Africa Proton Beam Therapy Devices Revenue (million) Forecast, by Application 2019 & 2032
- Table 74: Rest of Middle East & Africa Proton Beam Therapy Devices Volume (K) Forecast, by Application 2019 & 2032
- Table 75: Global Proton Beam Therapy Devices Revenue million Forecast, by Application 2019 & 2032
- Table 76: Global Proton Beam Therapy Devices Volume K Forecast, by Application 2019 & 2032
- Table 77: Global Proton Beam Therapy Devices Revenue million Forecast, by Types 2019 & 2032
- Table 78: Global Proton Beam Therapy Devices Volume K Forecast, by Types 2019 & 2032
- Table 79: Global Proton Beam Therapy Devices Revenue million Forecast, by Country 2019 & 2032
- Table 80: Global Proton Beam Therapy Devices Volume K Forecast, by Country 2019 & 2032
- Table 81: China Proton Beam Therapy Devices Revenue (million) Forecast, by Application 2019 & 2032
- Table 82: China Proton Beam Therapy Devices Volume (K) Forecast, by Application 2019 & 2032
- Table 83: India Proton Beam Therapy Devices Revenue (million) Forecast, by Application 2019 & 2032
- Table 84: India Proton Beam Therapy Devices Volume (K) Forecast, by Application 2019 & 2032
- Table 85: Japan Proton Beam Therapy Devices Revenue (million) Forecast, by Application 2019 & 2032
- Table 86: Japan Proton Beam Therapy Devices Volume (K) Forecast, by Application 2019 & 2032
- Table 87: South Korea Proton Beam Therapy Devices Revenue (million) Forecast, by Application 2019 & 2032
- Table 88: South Korea Proton Beam Therapy Devices Volume (K) Forecast, by Application 2019 & 2032
- Table 89: ASEAN Proton Beam Therapy Devices Revenue (million) Forecast, by Application 2019 & 2032
- Table 90: ASEAN Proton Beam Therapy Devices Volume (K) Forecast, by Application 2019 & 2032
- Table 91: Oceania Proton Beam Therapy Devices Revenue (million) Forecast, by Application 2019 & 2032
- Table 92: Oceania Proton Beam Therapy Devices Volume (K) Forecast, by Application 2019 & 2032
- Table 93: Rest of Asia Pacific Proton Beam Therapy Devices Revenue (million) Forecast, by Application 2019 & 2032
- Table 94: Rest of Asia Pacific Proton Beam Therapy Devices Volume (K) Forecast, by Application 2019 & 2032
Frequently Asked Questions
1. What is the projected Compound Annual Growth Rate (CAGR) of the Proton Beam Therapy Devices?
The projected CAGR is approximately XX%.
2. Which companies are prominent players in the Proton Beam Therapy Devices?
Key companies in the market include Hitachi, IBA, Varian, Mevion Medical Systems, ProTom International, Sumitomo Heavy Industries, ProNova Solutions, Optivus Proton Therapy.
3. What are the main segments of the Proton Beam Therapy Devices?
The market segments include Application, Types.
4. Can you provide details about the market size?
The market size is estimated to be USD XXX million as of 2022.
5. What are some drivers contributing to market growth?
N/A
6. What are the notable trends driving market growth?
N/A
7. Are there any restraints impacting market growth?
N/A
8. Can you provide examples of recent developments in the market?
N/A
9. What pricing options are available for accessing the report?
Pricing options include single-user, multi-user, and enterprise licenses priced at USD 3950.00, USD 5925.00, and USD 7900.00 respectively.
10. Is the market size provided in terms of value or volume?
The market size is provided in terms of value, measured in million and volume, measured in K.
11. Are there any specific market keywords associated with the report?
Yes, the market keyword associated with the report is "Proton Beam Therapy Devices," which aids in identifying and referencing the specific market segment covered.
12. How do I determine which pricing option suits my needs best?
The pricing options vary based on user requirements and access needs. Individual users may opt for single-user licenses, while businesses requiring broader access may choose multi-user or enterprise licenses for cost-effective access to the report.
13. Are there any additional resources or data provided in the Proton Beam Therapy Devices report?
While the report offers comprehensive insights, it's advisable to review the specific contents or supplementary materials provided to ascertain if additional resources or data are available.
14. How can I stay updated on further developments or reports in the Proton Beam Therapy Devices?
To stay informed about further developments, trends, and reports in the Proton Beam Therapy Devices, consider subscribing to industry newsletters, following relevant companies and organizations, or regularly checking reputable industry news sources and publications.
Methodology
Step 1 - Identification of Relevant Samples Size from Population Database


Step 2 - Approaches for Defining Global Market Size (Value, Volume* & Price*)

Note*: In applicable scenarios
Step 3 - Data Sources
Primary Research
- Web Analytics
- Survey Reports
- Research Institute
- Latest Research Reports
- Opinion Leaders
Secondary Research
- Annual Reports
- White Paper
- Latest Press Release
- Industry Association
- Paid Database
- Investor Presentations

Step 4 - Data Triangulation
Involves using different sources of information in order to increase the validity of a study
These sources are likely to be stakeholders in a program - participants, other researchers, program staff, other community members, and so on.
Then we put all data in single framework & apply various statistical tools to find out the dynamic on the market.
During the analysis stage, feedback from the stakeholder groups would be compared to determine areas of agreement as well as areas of divergence
