

Key Insights
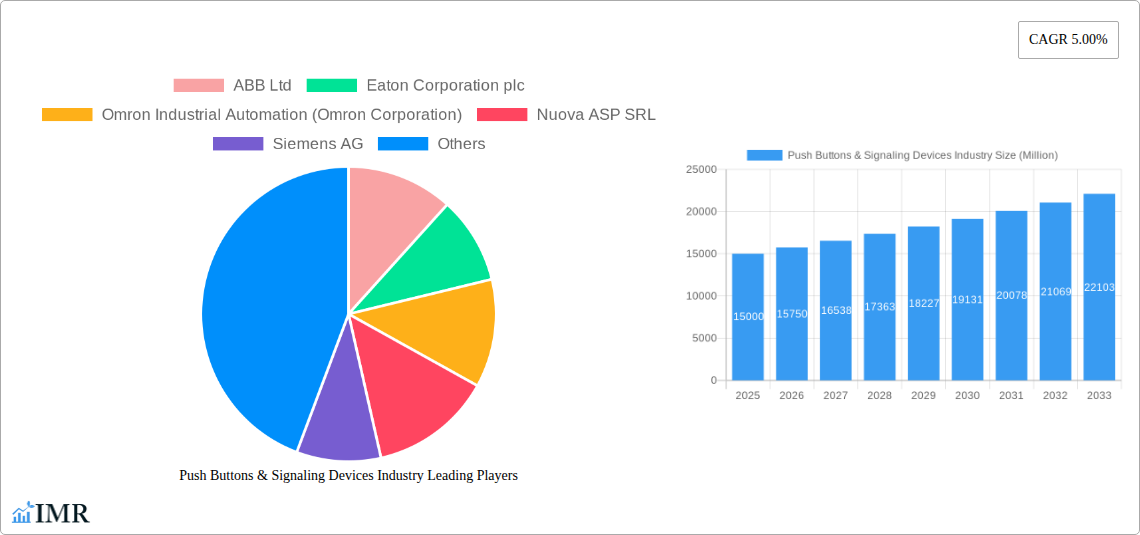
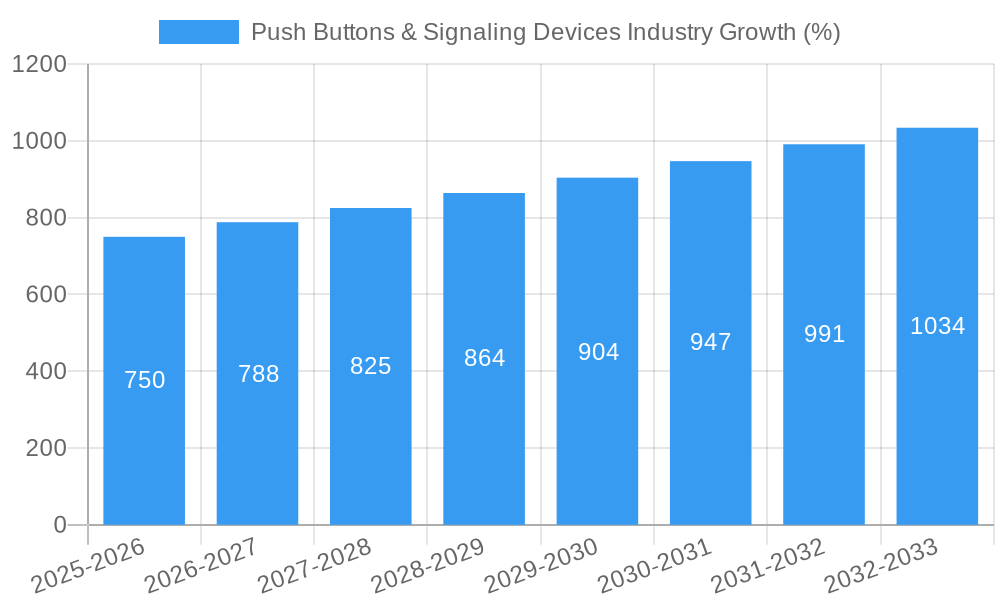
The global push buttons and signaling devices market is experiencing steady growth, projected to reach a significant market size in the coming years. A Compound Annual Growth Rate (CAGR) of 5.00% from 2025 to 2033 indicates a sustained demand driven by several key factors. The increasing automation across various industries, particularly automotive, energy and power, and manufacturing, is a primary driver. Smart factories and Industry 4.0 initiatives are fueling the adoption of advanced push buttons and signaling devices with features like enhanced durability, improved safety mechanisms, and integration with control systems. Growing demand for improved human-machine interfaces (HMIs) in industrial settings, coupled with stringent safety regulations in several regions, further contributes to market expansion. Segmentation reveals that the automotive sector is a leading end-user, followed closely by the energy and power industry, reflecting the crucial role these devices play in ensuring operational efficiency and safety in these sectors. Round or square body type push buttons are currently dominant, but there's growing demand for non-lighted options for specific applications, showcasing a shift towards adaptable, cost-effective solutions. Audible signaling devices maintain a significant market share, while the visible segment is witnessing growth with advancements in LED and other visual signaling technologies. Major players like ABB, Eaton, Omron, and Siemens are actively involved in innovation and market consolidation, through strategic partnerships and product diversification. The Asia-Pacific region is poised for significant growth, owing to rapid industrialization and infrastructure development.
While the market displays promising growth, several factors pose challenges. Supply chain disruptions, fluctuating raw material costs, and the cyclical nature of certain end-user industries can impact market dynamics. Furthermore, increasing competition from new entrants and the need for continuous innovation to meet evolving industry demands require consistent adaptation from established players. Despite these challenges, the long-term outlook for the push buttons and signaling devices market remains positive, largely driven by the ongoing trend towards automation and the increasing demand for robust and reliable industrial control components. The market’s diverse product offerings and application across multiple sectors ensure its resilience and sustained growth trajectory.
Push Buttons & Signaling Devices Industry Market Report: 2019-2033
This comprehensive report provides a detailed analysis of the global Push Buttons & Signaling Devices market, encompassing historical data (2019-2024), current estimates (2025), and future projections (2025-2033). The report segments the market by end-user industry (Automotive, Energy and Power, Manufacturing, Food and Beverage, Other), product type (Round or Square Body Type, Non-lighted Push Button, Other Products), and signal type (Audible, Visible, Other Types). Key players like ABB Ltd, Eaton Corporation plc, Omron Industrial Automation, and Siemens AG are profiled, offering insights into market dynamics and competitive landscapes. The report is an invaluable resource for industry professionals, investors, and strategists seeking to understand and capitalize on growth opportunities within this dynamic sector. The market is valued at xx Million Units in 2025 and is projected to reach xx Million Units by 2033.
Push Buttons & Signaling Devices Industry Market Dynamics & Structure
The global Push Buttons & Signaling Devices market exhibits a moderately consolidated structure, with a handful of major players holding significant market share. Technological innovation, particularly in areas like smart sensors and IoT integration, is a primary growth driver. Stringent safety regulations, especially in industries like automotive and manufacturing, influence product design and adoption. Competitive pressures arise from the availability of substitute technologies and the continuous introduction of new features. The market experiences cyclical growth influenced by the economic performance of major end-user industries. M&A activity is moderate, with larger players strategically acquiring smaller companies to expand their product portfolios and market reach.
- Market Concentration: Top 5 players hold approximately xx% market share in 2025.
- Technological Drivers: Advancements in HMI (Human-Machine Interface), smart sensors, and wireless communication technologies.
- Regulatory Landscape: Compliance with safety standards (e.g., IEC 60947) influences product development and adoption.
- Competitive Substitutes: Touchscreens and other advanced interface technologies pose a competitive threat.
- End-User Demographics: Growth is driven by increasing automation and digitalization across various end-user industries.
- M&A Activity: An estimated xx M&A deals occurred between 2019 and 2024, primarily driven by strategic expansion.
Push Buttons & Signaling Devices Industry Growth Trends & Insights
The Push Buttons & Signaling Devices market has experienced steady growth over the past five years, driven by increased automation and digitalization across diverse end-user sectors. The market size is projected to expand at a Compound Annual Growth Rate (CAGR) of xx% during the forecast period (2025-2033), reaching xx Million Units by 2033. This growth is fueled by technological advancements, including the integration of smart sensors and improved HMI capabilities. The adoption of Industry 4.0 principles and the growing demand for enhanced safety features are also significant contributors. Shifting consumer preferences towards user-friendly and customizable solutions further propel market growth. The increasing demand for safety and automation in industries like automotive and manufacturing has also been a crucial factor driving the growth. The market penetration rate is projected to increase from xx% in 2025 to xx% in 2033.
Dominant Regions, Countries, or Segments in Push Buttons & Signaling Devices Industry
The North American region is currently the dominant market for Push Buttons & Signaling Devices, driven by robust manufacturing and automation industries. Within this region, the United States holds a significant share. The European Union follows as a major market, fueled by similar industrial drivers. Within the segments, the Manufacturing sector demonstrates the highest demand, followed by the Automotive industry. The Round or Square Body Type products segment dominates in terms of market share, due to their widespread usability and cost-effectiveness. Audible signal types are also highly prevalent, due to their prominent usage in industrial settings.
- Key Drivers (North America): Strong industrial base, technological advancements, and high adoption rates.
- Key Drivers (EU): Robust manufacturing sector, stringent safety regulations, and automation investments.
- Segment Dominance: Manufacturing and Automotive end-user sectors lead in demand, followed by the Round or Square Body Type product segment, and Audible signal types.
- Growth Potential: Asia-Pacific region presents high growth potential due to increasing industrialization and infrastructure development.
Push Buttons & Signaling Devices Industry Product Landscape
The Push Buttons & Signaling Devices market offers a wide range of products, ranging from basic, non-illuminated push buttons to sophisticated, multi-functional devices with integrated sensors and communication capabilities. Recent innovations include the integration of smart sensors for predictive maintenance, improved HMI designs for enhanced user experience, and wireless communication capabilities for remote monitoring and control. Key product differentiators include improved ergonomics, enhanced durability, customizable designs, and the incorporation of advanced safety features. These advancements cater to specific industry needs and enhance operational efficiency.
Key Drivers, Barriers & Challenges in Push Buttons & Signaling Devices Industry
Key Drivers: The increasing adoption of automation and industrial IoT (IIoT) across various industries is a major driver. Government regulations promoting safety and worker protection are pushing the adoption of enhanced signaling devices. Technological advancements, such as the introduction of smart sensors and wireless connectivity, are also driving market growth.
Key Challenges: Fluctuations in raw material prices and supply chain disruptions can significantly impact production costs and availability. Intense competition from both established players and new entrants puts downward pressure on pricing. Stringent safety and regulatory compliance requirements can increase product development costs and time-to-market. The complexity of integrating these devices into existing systems can also pose a challenge. These factors collectively contribute to the complex market dynamics.
Emerging Opportunities in Push Buttons & Signaling Devices Industry
Significant opportunities lie in the expanding adoption of Industry 4.0 technologies, creating a demand for advanced, smart signaling devices. The increasing focus on safety and security in various sectors is driving the demand for specialized signaling systems. The growth of the smart home and building automation markets offers significant potential for new applications and products. Furthermore, untapped markets in developing economies present lucrative growth prospects.
Growth Accelerators in the Push Buttons & Signaling Devices Industry Industry
Technological breakthroughs in areas like miniature sensor technology and advanced HMI will accelerate market growth. Strategic partnerships and collaborations between manufacturers and end-user industries will unlock new applications and drive innovation. Expansion into emerging markets, particularly in Asia-Pacific, will create new revenue streams. A focus on sustainable and environmentally friendly materials and manufacturing processes will further enhance market competitiveness.
Key Players Shaping the Push Buttons & Signaling Devices Industry Market
- ABB Ltd
- Eaton Corporation plc
- Omron Industrial Automation (Omron Corporation)
- Nuova ASP SRL
- Siemens AG
- Oslo Switch Inc
- Schneider Electric
- Switronic Industrial Corp
- Rockwell Automation Inc
- BACO Controls Inc
Notable Milestones in Push Buttons & Signaling Devices Industry Sector
- September 2022: The Blue Valley School District implemented a new crisis alert system using specialized push-button badges, highlighting the increasing demand for enhanced safety solutions in public spaces.
In-Depth Push Buttons & Signaling Devices Industry Market Outlook
The future of the Push Buttons & Signaling Devices market is bright, driven by the continuous advancements in automation, smart technologies and increased demand for enhanced safety and security across various sectors. The market is poised for sustained growth, with significant opportunities for innovation and expansion in both developed and developing economies. Companies that can leverage technological advancements, strategically target specific market segments, and effectively address evolving customer needs will be best positioned to capitalize on this growth.
Push Buttons & Signaling Devices Industry Segmentation
-
1. Product
- 1.1. Round or Square Body Type
- 1.2. Non-lighted Push Button
- 1.3. Other Products
-
2. Types
- 2.1. Audible
- 2.2. Visible
- 2.3. Other Types
-
3. End-user Industry
- 3.1. Automotive
- 3.2. Energy and Power
- 3.3. Manufacturing
- 3.4. Food and Beverage
- 3.5. Other End-user Industries
Push Buttons & Signaling Devices Industry Segmentation By Geography
- 1. North America
- 2. Europe
- 3. Asia Pacific
- 4. Latin America
- 5. Middle East and Africa

Push Buttons & Signaling Devices Industry REPORT HIGHLIGHTS
| Aspects | Details |
|---|---|
| Study Period | 2019-2033 |
| Base Year | 2024 |
| Estimated Year | 2025 |
| Forecast Period | 2025-2033 |
| Historical Period | 2019-2024 |
| Growth Rate | CAGR of 5.00% from 2019-2033 |
| Segmentation |
|
Table of Contents
- 1. Introduction
- 1.1. Research Scope
- 1.2. Market Segmentation
- 1.3. Research Methodology
- 1.4. Definitions and Assumptions
- 2. Executive Summary
- 2.1. Introduction
- 3. Market Dynamics
- 3.1. Introduction
- 3.2. Market Drivers
- 3.2.1. Creating Safe Working Environment For The Industrial Workers; Favorable Government Regulations For Industrial Safety
- 3.3. Market Restrains
- 3.3.1. High Initial Investment in Creating Supporting Infrastructure and Automation
- 3.4. Market Trends
- 3.4.1. Automotive Industry to Drive the Market Growth
- 4. Market Factor Analysis
- 4.1. Porters Five Forces
- 4.2. Supply/Value Chain
- 4.3. PESTEL analysis
- 4.4. Market Entropy
- 4.5. Patent/Trademark Analysis
- 5. Global Push Buttons & Signaling Devices Industry Analysis, Insights and Forecast, 2019-2031
- 5.1. Market Analysis, Insights and Forecast - by Product
- 5.1.1. Round or Square Body Type
- 5.1.2. Non-lighted Push Button
- 5.1.3. Other Products
- 5.2. Market Analysis, Insights and Forecast - by Types
- 5.2.1. Audible
- 5.2.2. Visible
- 5.2.3. Other Types
- 5.3. Market Analysis, Insights and Forecast - by End-user Industry
- 5.3.1. Automotive
- 5.3.2. Energy and Power
- 5.3.3. Manufacturing
- 5.3.4. Food and Beverage
- 5.3.5. Other End-user Industries
- 5.4. Market Analysis, Insights and Forecast - by Region
- 5.4.1. North America
- 5.4.2. Europe
- 5.4.3. Asia Pacific
- 5.4.4. Latin America
- 5.4.5. Middle East and Africa
- 5.1. Market Analysis, Insights and Forecast - by Product
- 6. North America Push Buttons & Signaling Devices Industry Analysis, Insights and Forecast, 2019-2031
- 6.1. Market Analysis, Insights and Forecast - by Product
- 6.1.1. Round or Square Body Type
- 6.1.2. Non-lighted Push Button
- 6.1.3. Other Products
- 6.2. Market Analysis, Insights and Forecast - by Types
- 6.2.1. Audible
- 6.2.2. Visible
- 6.2.3. Other Types
- 6.3. Market Analysis, Insights and Forecast - by End-user Industry
- 6.3.1. Automotive
- 6.3.2. Energy and Power
- 6.3.3. Manufacturing
- 6.3.4. Food and Beverage
- 6.3.5. Other End-user Industries
- 6.1. Market Analysis, Insights and Forecast - by Product
- 7. Europe Push Buttons & Signaling Devices Industry Analysis, Insights and Forecast, 2019-2031
- 7.1. Market Analysis, Insights and Forecast - by Product
- 7.1.1. Round or Square Body Type
- 7.1.2. Non-lighted Push Button
- 7.1.3. Other Products
- 7.2. Market Analysis, Insights and Forecast - by Types
- 7.2.1. Audible
- 7.2.2. Visible
- 7.2.3. Other Types
- 7.3. Market Analysis, Insights and Forecast - by End-user Industry
- 7.3.1. Automotive
- 7.3.2. Energy and Power
- 7.3.3. Manufacturing
- 7.3.4. Food and Beverage
- 7.3.5. Other End-user Industries
- 7.1. Market Analysis, Insights and Forecast - by Product
- 8. Asia Pacific Push Buttons & Signaling Devices Industry Analysis, Insights and Forecast, 2019-2031
- 8.1. Market Analysis, Insights and Forecast - by Product
- 8.1.1. Round or Square Body Type
- 8.1.2. Non-lighted Push Button
- 8.1.3. Other Products
- 8.2. Market Analysis, Insights and Forecast - by Types
- 8.2.1. Audible
- 8.2.2. Visible
- 8.2.3. Other Types
- 8.3. Market Analysis, Insights and Forecast - by End-user Industry
- 8.3.1. Automotive
- 8.3.2. Energy and Power
- 8.3.3. Manufacturing
- 8.3.4. Food and Beverage
- 8.3.5. Other End-user Industries
- 8.1. Market Analysis, Insights and Forecast - by Product
- 9. Latin America Push Buttons & Signaling Devices Industry Analysis, Insights and Forecast, 2019-2031
- 9.1. Market Analysis, Insights and Forecast - by Product
- 9.1.1. Round or Square Body Type
- 9.1.2. Non-lighted Push Button
- 9.1.3. Other Products
- 9.2. Market Analysis, Insights and Forecast - by Types
- 9.2.1. Audible
- 9.2.2. Visible
- 9.2.3. Other Types
- 9.3. Market Analysis, Insights and Forecast - by End-user Industry
- 9.3.1. Automotive
- 9.3.2. Energy and Power
- 9.3.3. Manufacturing
- 9.3.4. Food and Beverage
- 9.3.5. Other End-user Industries
- 9.1. Market Analysis, Insights and Forecast - by Product
- 10. Middle East and Africa Push Buttons & Signaling Devices Industry Analysis, Insights and Forecast, 2019-2031
- 10.1. Market Analysis, Insights and Forecast - by Product
- 10.1.1. Round or Square Body Type
- 10.1.2. Non-lighted Push Button
- 10.1.3. Other Products
- 10.2. Market Analysis, Insights and Forecast - by Types
- 10.2.1. Audible
- 10.2.2. Visible
- 10.2.3. Other Types
- 10.3. Market Analysis, Insights and Forecast - by End-user Industry
- 10.3.1. Automotive
- 10.3.2. Energy and Power
- 10.3.3. Manufacturing
- 10.3.4. Food and Beverage
- 10.3.5. Other End-user Industries
- 10.1. Market Analysis, Insights and Forecast - by Product
- 11. North America Push Buttons & Signaling Devices Industry Analysis, Insights and Forecast, 2019-2031
- 11.1. Market Analysis, Insights and Forecast - By Country/Sub-region
- 11.1.1.
- 12. Europe Push Buttons & Signaling Devices Industry Analysis, Insights and Forecast, 2019-2031
- 12.1. Market Analysis, Insights and Forecast - By Country/Sub-region
- 12.1.1.
- 13. Asia Pacific Push Buttons & Signaling Devices Industry Analysis, Insights and Forecast, 2019-2031
- 13.1. Market Analysis, Insights and Forecast - By Country/Sub-region
- 13.1.1.
- 14. Latin America Push Buttons & Signaling Devices Industry Analysis, Insights and Forecast, 2019-2031
- 14.1. Market Analysis, Insights and Forecast - By Country/Sub-region
- 14.1.1.
- 15. Middle East and Africa Push Buttons & Signaling Devices Industry Analysis, Insights and Forecast, 2019-2031
- 15.1. Market Analysis, Insights and Forecast - By Country/Sub-region
- 15.1.1.
- 16. Competitive Analysis
- 16.1. Global Market Share Analysis 2024
- 16.2. Company Profiles
- 16.2.1 ABB Ltd
- 16.2.1.1. Overview
- 16.2.1.2. Products
- 16.2.1.3. SWOT Analysis
- 16.2.1.4. Recent Developments
- 16.2.1.5. Financials (Based on Availability)
- 16.2.2 Eaton Corporation plc
- 16.2.2.1. Overview
- 16.2.2.2. Products
- 16.2.2.3. SWOT Analysis
- 16.2.2.4. Recent Developments
- 16.2.2.5. Financials (Based on Availability)
- 16.2.3 Omron Industrial Automation (Omron Corporation)
- 16.2.3.1. Overview
- 16.2.3.2. Products
- 16.2.3.3. SWOT Analysis
- 16.2.3.4. Recent Developments
- 16.2.3.5. Financials (Based on Availability)
- 16.2.4 Nuova ASP SRL
- 16.2.4.1. Overview
- 16.2.4.2. Products
- 16.2.4.3. SWOT Analysis
- 16.2.4.4. Recent Developments
- 16.2.4.5. Financials (Based on Availability)
- 16.2.5 Siemens AG
- 16.2.5.1. Overview
- 16.2.5.2. Products
- 16.2.5.3. SWOT Analysis
- 16.2.5.4. Recent Developments
- 16.2.5.5. Financials (Based on Availability)
- 16.2.6 Oslo Switch Inc *List Not Exhaustive
- 16.2.6.1. Overview
- 16.2.6.2. Products
- 16.2.6.3. SWOT Analysis
- 16.2.6.4. Recent Developments
- 16.2.6.5. Financials (Based on Availability)
- 16.2.7 Schneider Electric
- 16.2.7.1. Overview
- 16.2.7.2. Products
- 16.2.7.3. SWOT Analysis
- 16.2.7.4. Recent Developments
- 16.2.7.5. Financials (Based on Availability)
- 16.2.8 Switronic Industrial Corp
- 16.2.8.1. Overview
- 16.2.8.2. Products
- 16.2.8.3. SWOT Analysis
- 16.2.8.4. Recent Developments
- 16.2.8.5. Financials (Based on Availability)
- 16.2.9 Rockwell Automation Inc
- 16.2.9.1. Overview
- 16.2.9.2. Products
- 16.2.9.3. SWOT Analysis
- 16.2.9.4. Recent Developments
- 16.2.9.5. Financials (Based on Availability)
- 16.2.10 BACO Controls Inc
- 16.2.10.1. Overview
- 16.2.10.2. Products
- 16.2.10.3. SWOT Analysis
- 16.2.10.4. Recent Developments
- 16.2.10.5. Financials (Based on Availability)
- 16.2.1 ABB Ltd
List of Figures
- Figure 1: Global Push Buttons & Signaling Devices Industry Revenue Breakdown (Million, %) by Region 2024 & 2032
- Figure 2: North America Push Buttons & Signaling Devices Industry Revenue (Million), by Country 2024 & 2032
- Figure 3: North America Push Buttons & Signaling Devices Industry Revenue Share (%), by Country 2024 & 2032
- Figure 4: Europe Push Buttons & Signaling Devices Industry Revenue (Million), by Country 2024 & 2032
- Figure 5: Europe Push Buttons & Signaling Devices Industry Revenue Share (%), by Country 2024 & 2032
- Figure 6: Asia Pacific Push Buttons & Signaling Devices Industry Revenue (Million), by Country 2024 & 2032
- Figure 7: Asia Pacific Push Buttons & Signaling Devices Industry Revenue Share (%), by Country 2024 & 2032
- Figure 8: Latin America Push Buttons & Signaling Devices Industry Revenue (Million), by Country 2024 & 2032
- Figure 9: Latin America Push Buttons & Signaling Devices Industry Revenue Share (%), by Country 2024 & 2032
- Figure 10: Middle East and Africa Push Buttons & Signaling Devices Industry Revenue (Million), by Country 2024 & 2032
- Figure 11: Middle East and Africa Push Buttons & Signaling Devices Industry Revenue Share (%), by Country 2024 & 2032
- Figure 12: North America Push Buttons & Signaling Devices Industry Revenue (Million), by Product 2024 & 2032
- Figure 13: North America Push Buttons & Signaling Devices Industry Revenue Share (%), by Product 2024 & 2032
- Figure 14: North America Push Buttons & Signaling Devices Industry Revenue (Million), by Types 2024 & 2032
- Figure 15: North America Push Buttons & Signaling Devices Industry Revenue Share (%), by Types 2024 & 2032
- Figure 16: North America Push Buttons & Signaling Devices Industry Revenue (Million), by End-user Industry 2024 & 2032
- Figure 17: North America Push Buttons & Signaling Devices Industry Revenue Share (%), by End-user Industry 2024 & 2032
- Figure 18: North America Push Buttons & Signaling Devices Industry Revenue (Million), by Country 2024 & 2032
- Figure 19: North America Push Buttons & Signaling Devices Industry Revenue Share (%), by Country 2024 & 2032
- Figure 20: Europe Push Buttons & Signaling Devices Industry Revenue (Million), by Product 2024 & 2032
- Figure 21: Europe Push Buttons & Signaling Devices Industry Revenue Share (%), by Product 2024 & 2032
- Figure 22: Europe Push Buttons & Signaling Devices Industry Revenue (Million), by Types 2024 & 2032
- Figure 23: Europe Push Buttons & Signaling Devices Industry Revenue Share (%), by Types 2024 & 2032
- Figure 24: Europe Push Buttons & Signaling Devices Industry Revenue (Million), by End-user Industry 2024 & 2032
- Figure 25: Europe Push Buttons & Signaling Devices Industry Revenue Share (%), by End-user Industry 2024 & 2032
- Figure 26: Europe Push Buttons & Signaling Devices Industry Revenue (Million), by Country 2024 & 2032
- Figure 27: Europe Push Buttons & Signaling Devices Industry Revenue Share (%), by Country 2024 & 2032
- Figure 28: Asia Pacific Push Buttons & Signaling Devices Industry Revenue (Million), by Product 2024 & 2032
- Figure 29: Asia Pacific Push Buttons & Signaling Devices Industry Revenue Share (%), by Product 2024 & 2032
- Figure 30: Asia Pacific Push Buttons & Signaling Devices Industry Revenue (Million), by Types 2024 & 2032
- Figure 31: Asia Pacific Push Buttons & Signaling Devices Industry Revenue Share (%), by Types 2024 & 2032
- Figure 32: Asia Pacific Push Buttons & Signaling Devices Industry Revenue (Million), by End-user Industry 2024 & 2032
- Figure 33: Asia Pacific Push Buttons & Signaling Devices Industry Revenue Share (%), by End-user Industry 2024 & 2032
- Figure 34: Asia Pacific Push Buttons & Signaling Devices Industry Revenue (Million), by Country 2024 & 2032
- Figure 35: Asia Pacific Push Buttons & Signaling Devices Industry Revenue Share (%), by Country 2024 & 2032
- Figure 36: Latin America Push Buttons & Signaling Devices Industry Revenue (Million), by Product 2024 & 2032
- Figure 37: Latin America Push Buttons & Signaling Devices Industry Revenue Share (%), by Product 2024 & 2032
- Figure 38: Latin America Push Buttons & Signaling Devices Industry Revenue (Million), by Types 2024 & 2032
- Figure 39: Latin America Push Buttons & Signaling Devices Industry Revenue Share (%), by Types 2024 & 2032
- Figure 40: Latin America Push Buttons & Signaling Devices Industry Revenue (Million), by End-user Industry 2024 & 2032
- Figure 41: Latin America Push Buttons & Signaling Devices Industry Revenue Share (%), by End-user Industry 2024 & 2032
- Figure 42: Latin America Push Buttons & Signaling Devices Industry Revenue (Million), by Country 2024 & 2032
- Figure 43: Latin America Push Buttons & Signaling Devices Industry Revenue Share (%), by Country 2024 & 2032
- Figure 44: Middle East and Africa Push Buttons & Signaling Devices Industry Revenue (Million), by Product 2024 & 2032
- Figure 45: Middle East and Africa Push Buttons & Signaling Devices Industry Revenue Share (%), by Product 2024 & 2032
- Figure 46: Middle East and Africa Push Buttons & Signaling Devices Industry Revenue (Million), by Types 2024 & 2032
- Figure 47: Middle East and Africa Push Buttons & Signaling Devices Industry Revenue Share (%), by Types 2024 & 2032
- Figure 48: Middle East and Africa Push Buttons & Signaling Devices Industry Revenue (Million), by End-user Industry 2024 & 2032
- Figure 49: Middle East and Africa Push Buttons & Signaling Devices Industry Revenue Share (%), by End-user Industry 2024 & 2032
- Figure 50: Middle East and Africa Push Buttons & Signaling Devices Industry Revenue (Million), by Country 2024 & 2032
- Figure 51: Middle East and Africa Push Buttons & Signaling Devices Industry Revenue Share (%), by Country 2024 & 2032
List of Tables
- Table 1: Global Push Buttons & Signaling Devices Industry Revenue Million Forecast, by Region 2019 & 2032
- Table 2: Global Push Buttons & Signaling Devices Industry Revenue Million Forecast, by Product 2019 & 2032
- Table 3: Global Push Buttons & Signaling Devices Industry Revenue Million Forecast, by Types 2019 & 2032
- Table 4: Global Push Buttons & Signaling Devices Industry Revenue Million Forecast, by End-user Industry 2019 & 2032
- Table 5: Global Push Buttons & Signaling Devices Industry Revenue Million Forecast, by Region 2019 & 2032
- Table 6: Global Push Buttons & Signaling Devices Industry Revenue Million Forecast, by Country 2019 & 2032
- Table 7: Push Buttons & Signaling Devices Industry Revenue (Million) Forecast, by Application 2019 & 2032
- Table 8: Global Push Buttons & Signaling Devices Industry Revenue Million Forecast, by Country 2019 & 2032
- Table 9: Push Buttons & Signaling Devices Industry Revenue (Million) Forecast, by Application 2019 & 2032
- Table 10: Global Push Buttons & Signaling Devices Industry Revenue Million Forecast, by Country 2019 & 2032
- Table 11: Push Buttons & Signaling Devices Industry Revenue (Million) Forecast, by Application 2019 & 2032
- Table 12: Global Push Buttons & Signaling Devices Industry Revenue Million Forecast, by Country 2019 & 2032
- Table 13: Push Buttons & Signaling Devices Industry Revenue (Million) Forecast, by Application 2019 & 2032
- Table 14: Global Push Buttons & Signaling Devices Industry Revenue Million Forecast, by Country 2019 & 2032
- Table 15: Push Buttons & Signaling Devices Industry Revenue (Million) Forecast, by Application 2019 & 2032
- Table 16: Global Push Buttons & Signaling Devices Industry Revenue Million Forecast, by Product 2019 & 2032
- Table 17: Global Push Buttons & Signaling Devices Industry Revenue Million Forecast, by Types 2019 & 2032
- Table 18: Global Push Buttons & Signaling Devices Industry Revenue Million Forecast, by End-user Industry 2019 & 2032
- Table 19: Global Push Buttons & Signaling Devices Industry Revenue Million Forecast, by Country 2019 & 2032
- Table 20: Global Push Buttons & Signaling Devices Industry Revenue Million Forecast, by Product 2019 & 2032
- Table 21: Global Push Buttons & Signaling Devices Industry Revenue Million Forecast, by Types 2019 & 2032
- Table 22: Global Push Buttons & Signaling Devices Industry Revenue Million Forecast, by End-user Industry 2019 & 2032
- Table 23: Global Push Buttons & Signaling Devices Industry Revenue Million Forecast, by Country 2019 & 2032
- Table 24: Global Push Buttons & Signaling Devices Industry Revenue Million Forecast, by Product 2019 & 2032
- Table 25: Global Push Buttons & Signaling Devices Industry Revenue Million Forecast, by Types 2019 & 2032
- Table 26: Global Push Buttons & Signaling Devices Industry Revenue Million Forecast, by End-user Industry 2019 & 2032
- Table 27: Global Push Buttons & Signaling Devices Industry Revenue Million Forecast, by Country 2019 & 2032
- Table 28: Global Push Buttons & Signaling Devices Industry Revenue Million Forecast, by Product 2019 & 2032
- Table 29: Global Push Buttons & Signaling Devices Industry Revenue Million Forecast, by Types 2019 & 2032
- Table 30: Global Push Buttons & Signaling Devices Industry Revenue Million Forecast, by End-user Industry 2019 & 2032
- Table 31: Global Push Buttons & Signaling Devices Industry Revenue Million Forecast, by Country 2019 & 2032
- Table 32: Global Push Buttons & Signaling Devices Industry Revenue Million Forecast, by Product 2019 & 2032
- Table 33: Global Push Buttons & Signaling Devices Industry Revenue Million Forecast, by Types 2019 & 2032
- Table 34: Global Push Buttons & Signaling Devices Industry Revenue Million Forecast, by End-user Industry 2019 & 2032
- Table 35: Global Push Buttons & Signaling Devices Industry Revenue Million Forecast, by Country 2019 & 2032
Frequently Asked Questions
1. What is the projected Compound Annual Growth Rate (CAGR) of the Push Buttons & Signaling Devices Industry?
The projected CAGR is approximately 5.00%.
2. Which companies are prominent players in the Push Buttons & Signaling Devices Industry?
Key companies in the market include ABB Ltd, Eaton Corporation plc, Omron Industrial Automation (Omron Corporation), Nuova ASP SRL, Siemens AG, Oslo Switch Inc *List Not Exhaustive, Schneider Electric, Switronic Industrial Corp, Rockwell Automation Inc, BACO Controls Inc.
3. What are the main segments of the Push Buttons & Signaling Devices Industry?
The market segments include Product, Types, End-user Industry.
4. Can you provide details about the market size?
The market size is estimated to be USD XX Million as of 2022.
5. What are some drivers contributing to market growth?
Creating Safe Working Environment For The Industrial Workers; Favorable Government Regulations For Industrial Safety.
6. What are the notable trends driving market growth?
Automotive Industry to Drive the Market Growth.
7. Are there any restraints impacting market growth?
High Initial Investment in Creating Supporting Infrastructure and Automation.
8. Can you provide examples of recent developments in the market?
September 2022 - The Blue Valley School District announced a new crisis alert system that allows Blue Valley staff members to call for help by pushing a button with a specialized badge. This system will be added to schools during the 2022-23 school year.
9. What pricing options are available for accessing the report?
Pricing options include single-user, multi-user, and enterprise licenses priced at USD 4750, USD 5250, and USD 8750 respectively.
10. Is the market size provided in terms of value or volume?
The market size is provided in terms of value, measured in Million.
11. Are there any specific market keywords associated with the report?
Yes, the market keyword associated with the report is "Push Buttons & Signaling Devices Industry," which aids in identifying and referencing the specific market segment covered.
12. How do I determine which pricing option suits my needs best?
The pricing options vary based on user requirements and access needs. Individual users may opt for single-user licenses, while businesses requiring broader access may choose multi-user or enterprise licenses for cost-effective access to the report.
13. Are there any additional resources or data provided in the Push Buttons & Signaling Devices Industry report?
While the report offers comprehensive insights, it's advisable to review the specific contents or supplementary materials provided to ascertain if additional resources or data are available.
14. How can I stay updated on further developments or reports in the Push Buttons & Signaling Devices Industry?
To stay informed about further developments, trends, and reports in the Push Buttons & Signaling Devices Industry, consider subscribing to industry newsletters, following relevant companies and organizations, or regularly checking reputable industry news sources and publications.
Methodology
Step 1 - Identification of Relevant Samples Size from Population Database


Step 2 - Approaches for Defining Global Market Size (Value, Volume* & Price*)

Note*: In applicable scenarios
Step 3 - Data Sources
Primary Research
- Web Analytics
- Survey Reports
- Research Institute
- Latest Research Reports
- Opinion Leaders
Secondary Research
- Annual Reports
- White Paper
- Latest Press Release
- Industry Association
- Paid Database
- Investor Presentations

Step 4 - Data Triangulation
Involves using different sources of information in order to increase the validity of a study
These sources are likely to be stakeholders in a program - participants, other researchers, program staff, other community members, and so on.
Then we put all data in single framework & apply various statistical tools to find out the dynamic on the market.
During the analysis stage, feedback from the stakeholder groups would be compared to determine areas of agreement as well as areas of divergence
