

Key Insights
The NDT Inspection Services market, valued at approximately $XX million in 2025, is projected to experience robust growth, exhibiting a Compound Annual Growth Rate (CAGR) of 6.70% from 2025 to 2033. This expansion is driven by several key factors. The increasing demand for infrastructure development across various sectors, including oil and gas, aerospace and defense, and renewable energy, fuels the need for rigorous quality control and safety assessments. Furthermore, stringent regulatory compliance mandates for asset integrity management in critical industries necessitate regular non-destructive testing (NDT) inspections. Technological advancements in NDT techniques, such as the adoption of automated and advanced imaging systems, are enhancing inspection efficiency and accuracy, further driving market growth. The rising adoption of predictive maintenance strategies, shifting from reactive to proactive approaches, is another significant driver. However, the market faces certain constraints, including the high cost of specialized equipment and skilled labor, and the potential for human error in interpreting inspection results. Despite these challenges, the long-term outlook for the NDT Inspection Services market remains positive, with significant growth potential across diverse geographic regions.
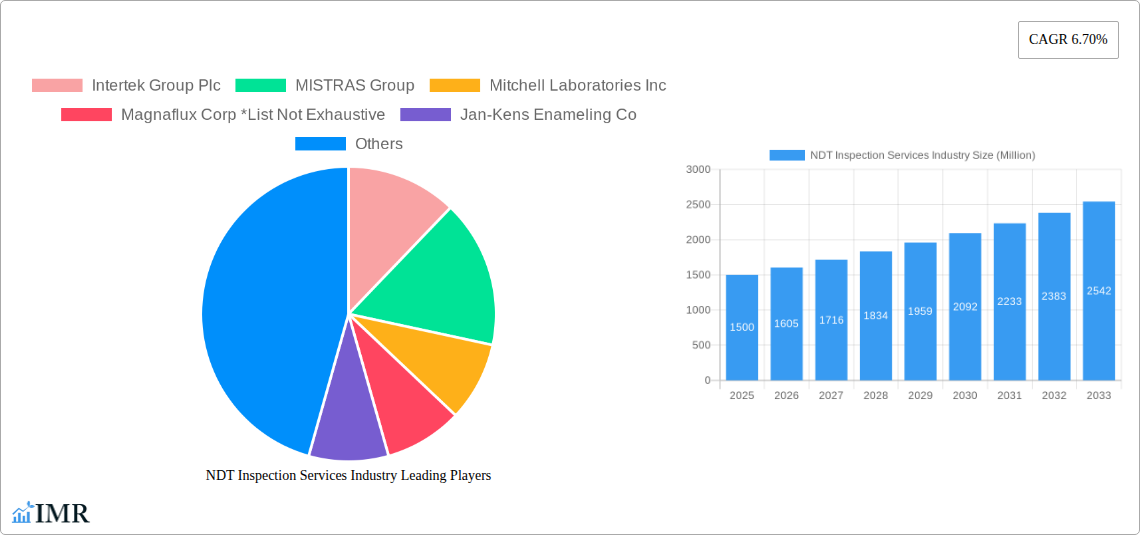
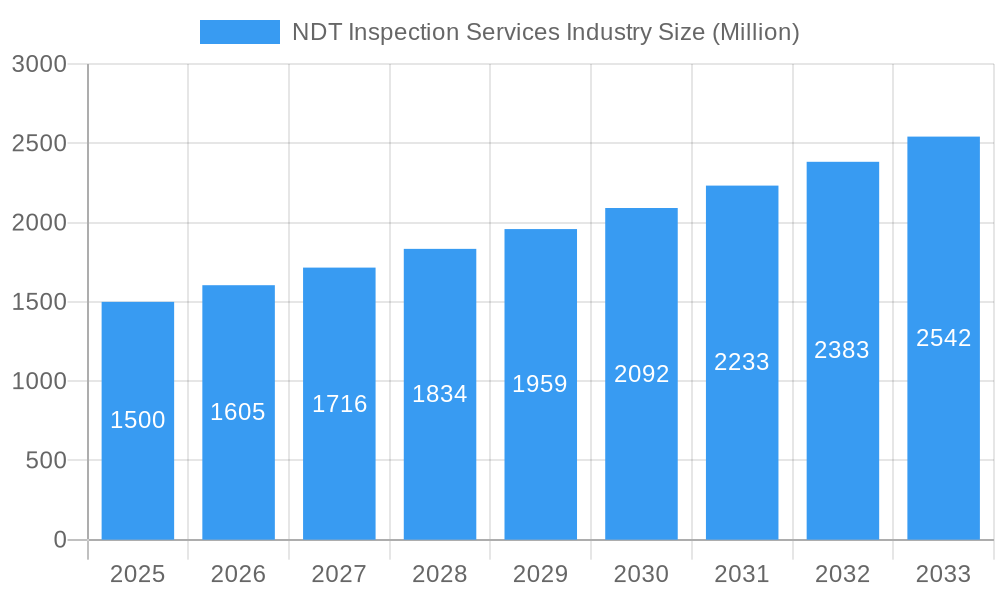
NDT Inspection Services Industry Market Size (In Billion)
The market segmentation reveals considerable diversity. Within testing technologies, radiography and ultrasonic testing maintain leading positions, due to their established reliability and versatility across diverse applications. However, the adoption of advanced techniques like magnetic particle and liquid penetrant testing is also increasing, driven by the need for more specialized inspection capabilities. Regarding end-user industries, oil and gas remains a significant market segment, owing to stringent safety and regulatory requirements. However, the aerospace and defense, power and energy, and automotive sectors are also witnessing substantial growth, mirroring investments in infrastructure upgrades and technological innovations. Geographically, North America and Europe are currently major markets, although the Asia-Pacific region is poised for significant expansion, driven by rapid industrialization and infrastructure development. The key players – Intertek Group Plc, MISTRAS Group, Mitchell Laboratories Inc, Magnaflux Corp, Jan-Kens Enameling Co, GE Measurement and Control Company (Baker & Hughes Company), LynX Inspection Inc, Olympus Corporation, Acuren Inspection Inc, and Applus Services S.A – are continually innovating and expanding their service offerings to capture market share in this dynamic and evolving landscape.
NDT Inspection Services Industry Company Market Share
NDT Inspection Services Market Report: 2019-2033
This comprehensive report provides an in-depth analysis of the NDT Inspection Services market, encompassing market dynamics, growth trends, regional segmentation, product landscape, and key players. The study period covers 2019-2033, with 2025 as the base and estimated year, and a forecast period of 2025-2033. The report leverages extensive data analysis to deliver actionable insights for industry professionals, investors, and stakeholders. The market is segmented by testing technology (Radiography, Ultrasonic, Magnetic Particle, Liquid Penetrant, Visual Inspection) and end-user industry (Oil and Gas, Aerospace and Defense, Power and Energy, Construction, Automotive and Transportation, Other). Key players profiled include Intertek Group Plc, MISTRAS Group, Mitchell Laboratories Inc, Magnaflux Corp, Jan-Kens Enameling Co, GE Measurement and Control Company (Baker & Hughes Company), LynX Inspection Inc, Olympus Corporation, Acuren Inspection Inc, and Applus Services S.A. (This list is not exhaustive). The global market is estimated to reach xx Million by 2033.
NDT Inspection Services Industry Market Dynamics & Structure
The Non-Destructive Testing (NDT) Inspection Services market is characterized by a moderately concentrated structure, with several prominent multinational corporations commanding a substantial market share. The global market size is projected to reach an estimated 7500 Million by 2025. A primary catalyst for market expansion is continuous technological innovation, particularly the advancement in digital radiography, phased array ultrasonic testing, and sophisticated automated inspection systems. Furthermore, stringent regulatory frameworks and international safety standards across diverse end-user industries are significant drivers, mandating the adoption of reliable NDT methods to ensure quality and operational integrity. While certain advanced simulation techniques offer competitive alternatives, their application remains limited in scenarios demanding absolute certainty and physical verification. The end-user demographic is exceptionally diverse, underscoring the pervasive need for NDT across a multitude of sectors, including manufacturing, energy, aerospace, and infrastructure. Mergers and acquisitions (M&A) activity has been dynamic, with numerous strategic transactions aimed at broadening service portfolios and enhancing global operational footprints. Over the past five years, these M&A deals have collectively been valued at approximately 500 Million.
- Market Concentration: The market exhibits moderate concentration, with leading players expected to hold a significant market share by 2025.
- Technological Innovation: A strong emphasis is placed on advancements in Artificial Intelligence (AI)-driven automation, next-generation sensor technology, and sophisticated data analytics for enhanced inspection capabilities.
- Regulatory Frameworks: Compliance with rigorous safety and quality standards, such as those outlined by ASME and API, is a critical factor propelling the demand for certified NDT services.
- Competitive Substitutes: The inherent criticality and precision required in many NDT applications limit the effectiveness of purely theoretical or simulated inspection methods.
- End-User Demographics: The market serves a wide array of industries, reflecting the universal applicability and necessity of NDT techniques for asset integrity and safety.
- M&A Trends: Strategic acquisitions continue to shape the market, focusing on expanding service offerings and geographic coverage. Approximately [Number] deals were finalized in the last five years, aggregating around 500 Million in value.
- Innovation Barriers: Significant initial capital investment for cutting-edge equipment and specialized training for skilled personnel represent key challenges to widespread adoption of the latest NDT innovations.
NDT Inspection Services Industry Growth Trends & Insights
The NDT Inspection Services market has demonstrated remarkable growth throughout the historical period (2019-2024). This expansion has been primarily fueled by substantial investments in infrastructure development globally, the increasing stringency of safety regulations, and a rising demand across pivotal end-user sectors. The market value surged from 5000 Million in 2019 to an estimated 7000 Million by 2024, reflecting a Compound Annual Growth Rate (CAGR) of approximately [XX]%. Adoption rates for NDT services have been consistently robust, particularly within safety-critical industries such as oil and gas, and aerospace. Emerging technological advancements, notably the integration of AI and robotics, are fundamentally reshaping inspection methodologies, leading to substantial improvements in both efficiency and accuracy. Furthermore, a discernible shift in consumer and industrial behavior towards prioritizing product quality, paramount safety, and cost-effectiveness is actively contributing to market acceleration. Projections indicate a sustained CAGR of [XX]% for the forecast period (2025-2033), driven by the widening application of advanced NDT techniques across a broader industrial spectrum. Market penetration is anticipated to reach a notable [XX]% by the year 2033.
Dominant Regions, Countries, or Segments in NDT Inspection Services Industry
Currently, North America and Europe lead the NDT Inspection Services market, a dominance attributed to their mature industrial ecosystems, stringent regulatory environments, and well-established NDT infrastructure. Among the various testing technologies, Ultrasonic Testing (UT) commands the largest market share, closely followed by Radiography. UT's prominence stems from its inherent versatility and comparatively lower cost of implementation relative to some other advanced NDT methods. The Oil and Gas industry stands out as the leading end-user sector, primarily due to the critical safety mandates and the extensive inspection requirements associated with pipelines, offshore exploration and production facilities, and downstream refining operations. Looking ahead, the Asia-Pacific region is poised to exhibit the most significant growth trajectory during the forecast period, propelled by escalating infrastructure investments and rapid industrialization.
-
Key Drivers by Region and Technology:
- North America & Europe: Driven by established industrial bases, stringent regulatory compliance, and high industry-wide awareness of NDT benefits.
- Asia-Pacific: Fuelled by rapid industrial expansion, increasing infrastructure projects, and a growing demand for quality assurance.
- Ultrasonic Testing: Favored for its exceptional versatility, non-intrusiveness, and cost-effectiveness in a wide range of applications.
- Oil & Gas Sector: Continues to be a primary driver due to its critical safety requirements and the necessity for continuous, comprehensive asset inspection.
-
Dominance and Growth Factors:
- Market Share: North America and Europe currently hold the dominant share of the global NDT inspection services market.
- Growth Potential: The Asia-Pacific region is strategically positioned for substantial market expansion in the coming years, driven by economic development and industrial growth.
NDT Inspection Services Industry Product Landscape
The NDT inspection services market is characterized by a diverse product landscape, including portable and stationary equipment for various inspection methods. Recent innovations include advanced software for data analysis and reporting, AI-powered defect detection, and robotic inspection systems which enhance efficiency and accuracy. These advancements improve the overall performance, reliability, and speed of NDT procedures, enabling faster turnaround times and reduced costs. Unique selling propositions focus on specialized expertise, rapid turnaround times, and advanced data analysis capabilities.
Key Drivers, Barriers & Challenges in NDT Inspection Services Industry
Key Drivers: Increasing demand from safety-critical sectors, stringent regulatory frameworks, technological advancements (e.g., AI-powered systems), and growing infrastructure projects. The global focus on safety across industries is a significant driver.
Challenges: High initial investment costs for advanced equipment, skilled labor shortages, and evolving regulatory landscapes pose significant challenges. Supply chain disruptions caused by recent global events have impacted the availability of certain components and materials, impacting service delivery and pricing.
Emerging Opportunities in NDT Inspection Services Industry
Emerging opportunities include expanding into new applications like renewable energy infrastructure inspection and the adoption of innovative inspection techniques such as drone-based inspections and advanced data analytics for predictive maintenance. Untapped markets in developing economies offer significant growth potential. Customized NDT solutions tailored to specific industry needs are also gaining traction.
Growth Accelerators in the NDT Inspection Services Industry
Technological advancements in AI and automation, strategic partnerships between NDT service providers and technology companies, and expansion into new and emerging markets (e.g., renewable energy) will significantly accelerate market growth. Increased adoption of cloud-based data management and analytics will further improve efficiency and insights.
Key Players Shaping the NDT Inspection Services Market
- Intertek Group Plc
- MISTRAS Group
- Mitchell Laboratories Inc
- Magnaflux Corp
- Jan-Kens Enameling Co
- GE Measurement and Control Company (Baker & Hughes Company)
- LynX Inspection Inc
- Olympus Corporation
- Acuren Inspection Inc
- Applus Services S.A
Notable Milestones in NDT Inspection Services Industry Sector
- 2020: The global pandemic significantly accelerated the adoption and development of remote inspection technologies and solutions.
- 2021: The market witnessed a series of strategic acquisitions and mergers among key industry players, leading to expanded service offerings and enhanced market reach.
- 2022: Several leading vendors introduced sophisticated AI-powered automated defect detection systems, revolutionizing inspection accuracy and speed.
- 2023: A notable surge in interest and investment in drone-based inspection services, particularly for monitoring large-scale infrastructure and challenging-to-access assets.
- 2024: Increased strategic focus on leveraging data analytics for predictive maintenance insights and optimizing inspection schedules across various industries.
In-Depth NDT Inspection Services Industry Market Outlook
The NDT Inspection Services market is on a trajectory for sustained and robust growth, propelled by the ongoing integration of cutting-edge technologies, the expanding application scope across diverse industrial verticals, and the unceasing demand for stringent safety and quality assurance. Strategic alliances and significant investments in research and development initiatives will be instrumental in unlocking the full long-term market potential. Prime opportunities will arise for companies that can offer pioneering solutions, possess specialized expertise, and demonstrate exceptional capabilities in efficient data management and interpretation. The market is projected to attain a value of approximately [XX] Million by 2033, presenting substantial avenues for growth, innovation, and strategic expansion within the global NDT landscape.
NDT Inspection Services Industry Segmentation
-
1. Testing Technology
- 1.1. Radiography
- 1.2. Ultrasonic
- 1.3. Magnetic Particle
- 1.4. Liquid Penetrant
- 1.5. Visual Inspection
-
2. End-user Industry
- 2.1. Oil and Gas
- 2.2. Aerospace and Defense
- 2.3. Power and Energy
- 2.4. Construction
- 2.5. Automotive and Transportation
- 2.6. Other End-user Industries
NDT Inspection Services Industry Segmentation By Geography
-
1. North America
- 1.1. United States
- 1.2. Canada
-
2. Europe
- 2.1. United Kingdom
- 2.2. Germany
- 2.3. France
- 2.4. Rest of Europe
-
3. Asia Pacific
- 3.1. China
- 3.2. Japan
- 3.3. India
- 3.4. Rest of Asia Pacific
- 4. Latin America
- 5. Middle East and Africa
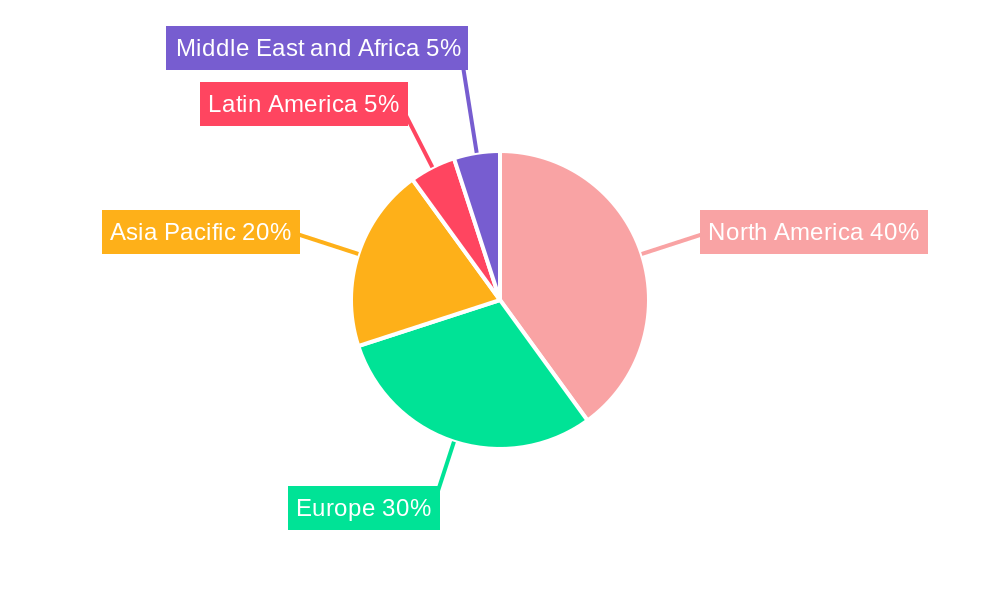
NDT Inspection Services Industry Regional Market Share
Geographic Coverage of NDT Inspection Services Industry
NDT Inspection Services Industry REPORT HIGHLIGHTS
| Aspects | Details |
|---|---|
| Study Period | 2020-2034 |
| Base Year | 2025 |
| Estimated Year | 2026 |
| Forecast Period | 2026-2034 |
| Historical Period | 2020-2025 |
| Growth Rate | CAGR of 6.5% from 2020-2034 |
| Segmentation |
|
Table of Contents
- 1. Introduction
- 1.1. Research Scope
- 1.2. Market Segmentation
- 1.3. Research Objective
- 1.4. Definitions and Assumptions
- 2. Executive Summary
- 2.1. Market Snapshot
- 3. Market Dynamics
- 3.1. Market Drivers
- 3.2. Market Restrains
- 3.3. Market Trends
- 3.4. Market Opportunities
- 4. Market Factor Analysis
- 4.1. Porters Five Forces
- 4.1.1. Bargaining Power of Suppliers
- 4.1.2. Bargaining Power of Buyers
- 4.1.3. Threat of New Entrants
- 4.1.4. Threat of Substitutes
- 4.1.5. Competitive Rivalry
- 4.2. PESTEL analysis
- 4.3. BCG Analysis
- 4.3.1. Stars (High Growth, High Market Share)
- 4.3.2. Cash Cows (Low Growth, High Market Share)
- 4.3.3. Question Mark (High Growth, Low Market Share)
- 4.3.4. Dogs (Low Growth, Low Market Share)
- 4.4. Ansoff Matrix Analysis
- 4.5. Supply Chain Analysis
- 4.6. Regulatory Landscape
- 4.7. Current Market Potential and Opportunity Assessment (TAM–SAM–SOM Framework)
- 4.8. IMR Analyst Note
- 4.1. Porters Five Forces
- 5. Market Analysis, Insights and Forecast 2021-2033
- 5.1. Market Analysis, Insights and Forecast - by Testing Technology
- 5.1.1. Radiography
- 5.1.2. Ultrasonic
- 5.1.3. Magnetic Particle
- 5.1.4. Liquid Penetrant
- 5.1.5. Visual Inspection
- 5.2. Market Analysis, Insights and Forecast - by End-user Industry
- 5.2.1. Oil and Gas
- 5.2.2. Aerospace and Defense
- 5.2.3. Power and Energy
- 5.2.4. Construction
- 5.2.5. Automotive and Transportation
- 5.2.6. Other End-user Industries
- 5.3. Market Analysis, Insights and Forecast - by Region
- 5.3.1. North America
- 5.3.2. Europe
- 5.3.3. Asia Pacific
- 5.3.4. Latin America
- 5.3.5. Middle East and Africa
- 5.1. Market Analysis, Insights and Forecast - by Testing Technology
- 6. Global NDT Inspection Services Industry Analysis, Insights and Forecast, 2021-2033
- 6.1. Market Analysis, Insights and Forecast - by Testing Technology
- 6.1.1. Radiography
- 6.1.2. Ultrasonic
- 6.1.3. Magnetic Particle
- 6.1.4. Liquid Penetrant
- 6.1.5. Visual Inspection
- 6.2. Market Analysis, Insights and Forecast - by End-user Industry
- 6.2.1. Oil and Gas
- 6.2.2. Aerospace and Defense
- 6.2.3. Power and Energy
- 6.2.4. Construction
- 6.2.5. Automotive and Transportation
- 6.2.6. Other End-user Industries
- 6.1. Market Analysis, Insights and Forecast - by Testing Technology
- 7. North America NDT Inspection Services Industry Analysis, Insights and Forecast, 2020-2032
- 7.1. Market Analysis, Insights and Forecast - by Testing Technology
- 7.1.1. Radiography
- 7.1.2. Ultrasonic
- 7.1.3. Magnetic Particle
- 7.1.4. Liquid Penetrant
- 7.1.5. Visual Inspection
- 7.2. Market Analysis, Insights and Forecast - by End-user Industry
- 7.2.1. Oil and Gas
- 7.2.2. Aerospace and Defense
- 7.2.3. Power and Energy
- 7.2.4. Construction
- 7.2.5. Automotive and Transportation
- 7.2.6. Other End-user Industries
- 7.1. Market Analysis, Insights and Forecast - by Testing Technology
- 8. Europe NDT Inspection Services Industry Analysis, Insights and Forecast, 2020-2032
- 8.1. Market Analysis, Insights and Forecast - by Testing Technology
- 8.1.1. Radiography
- 8.1.2. Ultrasonic
- 8.1.3. Magnetic Particle
- 8.1.4. Liquid Penetrant
- 8.1.5. Visual Inspection
- 8.2. Market Analysis, Insights and Forecast - by End-user Industry
- 8.2.1. Oil and Gas
- 8.2.2. Aerospace and Defense
- 8.2.3. Power and Energy
- 8.2.4. Construction
- 8.2.5. Automotive and Transportation
- 8.2.6. Other End-user Industries
- 8.1. Market Analysis, Insights and Forecast - by Testing Technology
- 9. Asia Pacific NDT Inspection Services Industry Analysis, Insights and Forecast, 2020-2032
- 9.1. Market Analysis, Insights and Forecast - by Testing Technology
- 9.1.1. Radiography
- 9.1.2. Ultrasonic
- 9.1.3. Magnetic Particle
- 9.1.4. Liquid Penetrant
- 9.1.5. Visual Inspection
- 9.2. Market Analysis, Insights and Forecast - by End-user Industry
- 9.2.1. Oil and Gas
- 9.2.2. Aerospace and Defense
- 9.2.3. Power and Energy
- 9.2.4. Construction
- 9.2.5. Automotive and Transportation
- 9.2.6. Other End-user Industries
- 9.1. Market Analysis, Insights and Forecast - by Testing Technology
- 10. Latin America NDT Inspection Services Industry Analysis, Insights and Forecast, 2020-2032
- 10.1. Market Analysis, Insights and Forecast - by Testing Technology
- 10.1.1. Radiography
- 10.1.2. Ultrasonic
- 10.1.3. Magnetic Particle
- 10.1.4. Liquid Penetrant
- 10.1.5. Visual Inspection
- 10.2. Market Analysis, Insights and Forecast - by End-user Industry
- 10.2.1. Oil and Gas
- 10.2.2. Aerospace and Defense
- 10.2.3. Power and Energy
- 10.2.4. Construction
- 10.2.5. Automotive and Transportation
- 10.2.6. Other End-user Industries
- 10.1. Market Analysis, Insights and Forecast - by Testing Technology
- 11. Middle East and Africa NDT Inspection Services Industry Analysis, Insights and Forecast, 2020-2032
- 11.1. Market Analysis, Insights and Forecast - by Testing Technology
- 11.1.1. Radiography
- 11.1.2. Ultrasonic
- 11.1.3. Magnetic Particle
- 11.1.4. Liquid Penetrant
- 11.1.5. Visual Inspection
- 11.2. Market Analysis, Insights and Forecast - by End-user Industry
- 11.2.1. Oil and Gas
- 11.2.2. Aerospace and Defense
- 11.2.3. Power and Energy
- 11.2.4. Construction
- 11.2.5. Automotive and Transportation
- 11.2.6. Other End-user Industries
- 11.1. Market Analysis, Insights and Forecast - by Testing Technology
- 12. Competitive Analysis
- 12.1. Company Profiles
- 12.1.1 Intertek Group Plc
- 12.1.1.1. Company Overview
- 12.1.1.2. Products
- 12.1.1.3. Company Financials
- 12.1.1.4. SWOT Analysis
- 12.1.2 MISTRAS Group
- 12.1.2.1. Company Overview
- 12.1.2.2. Products
- 12.1.2.3. Company Financials
- 12.1.2.4. SWOT Analysis
- 12.1.3 Mitchell Laboratories Inc
- 12.1.3.1. Company Overview
- 12.1.3.2. Products
- 12.1.3.3. Company Financials
- 12.1.3.4. SWOT Analysis
- 12.1.4 Magnaflux Corp *List Not Exhaustive
- 12.1.4.1. Company Overview
- 12.1.4.2. Products
- 12.1.4.3. Company Financials
- 12.1.4.4. SWOT Analysis
- 12.1.5 Jan-Kens Enameling Co
- 12.1.5.1. Company Overview
- 12.1.5.2. Products
- 12.1.5.3. Company Financials
- 12.1.5.4. SWOT Analysis
- 12.1.6 GE Measurement and Control Company (Baker & Hughes Company)
- 12.1.6.1. Company Overview
- 12.1.6.2. Products
- 12.1.6.3. Company Financials
- 12.1.6.4. SWOT Analysis
- 12.1.7 LynX Inspection Inc
- 12.1.7.1. Company Overview
- 12.1.7.2. Products
- 12.1.7.3. Company Financials
- 12.1.7.4. SWOT Analysis
- 12.1.8 Olympus Corporation
- 12.1.8.1. Company Overview
- 12.1.8.2. Products
- 12.1.8.3. Company Financials
- 12.1.8.4. SWOT Analysis
- 12.1.9 Acuren Inspection Inc
- 12.1.9.1. Company Overview
- 12.1.9.2. Products
- 12.1.9.3. Company Financials
- 12.1.9.4. SWOT Analysis
- 12.1.10 Applus Services S A
- 12.1.10.1. Company Overview
- 12.1.10.2. Products
- 12.1.10.3. Company Financials
- 12.1.10.4. SWOT Analysis
- 12.1.1 Intertek Group Plc
- 12.2. Market Entropy
- 12.2.1 Company's Key Areas Served
- 12.2.2 Recent Developments
- 12.3. Company Market Share Analysis 2025
- 12.3.1 Top 5 Companies Market Share Analysis
- 12.3.2 Top 3 Companies Market Share Analysis
- 12.4. List of Potential Customers
- 13. Research Methodology
List of Figures
- Figure 1: Global NDT Inspection Services Industry Revenue Breakdown (billion, %) by Region 2025 & 2033
- Figure 2: North America NDT Inspection Services Industry Revenue (billion), by Testing Technology 2025 & 2033
- Figure 3: North America NDT Inspection Services Industry Revenue Share (%), by Testing Technology 2025 & 2033
- Figure 4: North America NDT Inspection Services Industry Revenue (billion), by End-user Industry 2025 & 2033
- Figure 5: North America NDT Inspection Services Industry Revenue Share (%), by End-user Industry 2025 & 2033
- Figure 6: North America NDT Inspection Services Industry Revenue (billion), by Country 2025 & 2033
- Figure 7: North America NDT Inspection Services Industry Revenue Share (%), by Country 2025 & 2033
- Figure 8: Europe NDT Inspection Services Industry Revenue (billion), by Testing Technology 2025 & 2033
- Figure 9: Europe NDT Inspection Services Industry Revenue Share (%), by Testing Technology 2025 & 2033
- Figure 10: Europe NDT Inspection Services Industry Revenue (billion), by End-user Industry 2025 & 2033
- Figure 11: Europe NDT Inspection Services Industry Revenue Share (%), by End-user Industry 2025 & 2033
- Figure 12: Europe NDT Inspection Services Industry Revenue (billion), by Country 2025 & 2033
- Figure 13: Europe NDT Inspection Services Industry Revenue Share (%), by Country 2025 & 2033
- Figure 14: Asia Pacific NDT Inspection Services Industry Revenue (billion), by Testing Technology 2025 & 2033
- Figure 15: Asia Pacific NDT Inspection Services Industry Revenue Share (%), by Testing Technology 2025 & 2033
- Figure 16: Asia Pacific NDT Inspection Services Industry Revenue (billion), by End-user Industry 2025 & 2033
- Figure 17: Asia Pacific NDT Inspection Services Industry Revenue Share (%), by End-user Industry 2025 & 2033
- Figure 18: Asia Pacific NDT Inspection Services Industry Revenue (billion), by Country 2025 & 2033
- Figure 19: Asia Pacific NDT Inspection Services Industry Revenue Share (%), by Country 2025 & 2033
- Figure 20: Latin America NDT Inspection Services Industry Revenue (billion), by Testing Technology 2025 & 2033
- Figure 21: Latin America NDT Inspection Services Industry Revenue Share (%), by Testing Technology 2025 & 2033
- Figure 22: Latin America NDT Inspection Services Industry Revenue (billion), by End-user Industry 2025 & 2033
- Figure 23: Latin America NDT Inspection Services Industry Revenue Share (%), by End-user Industry 2025 & 2033
- Figure 24: Latin America NDT Inspection Services Industry Revenue (billion), by Country 2025 & 2033
- Figure 25: Latin America NDT Inspection Services Industry Revenue Share (%), by Country 2025 & 2033
- Figure 26: Middle East and Africa NDT Inspection Services Industry Revenue (billion), by Testing Technology 2025 & 2033
- Figure 27: Middle East and Africa NDT Inspection Services Industry Revenue Share (%), by Testing Technology 2025 & 2033
- Figure 28: Middle East and Africa NDT Inspection Services Industry Revenue (billion), by End-user Industry 2025 & 2033
- Figure 29: Middle East and Africa NDT Inspection Services Industry Revenue Share (%), by End-user Industry 2025 & 2033
- Figure 30: Middle East and Africa NDT Inspection Services Industry Revenue (billion), by Country 2025 & 2033
- Figure 31: Middle East and Africa NDT Inspection Services Industry Revenue Share (%), by Country 2025 & 2033
List of Tables
- Table 1: Global NDT Inspection Services Industry Revenue billion Forecast, by Testing Technology 2020 & 2033
- Table 2: Global NDT Inspection Services Industry Revenue billion Forecast, by End-user Industry 2020 & 2033
- Table 3: Global NDT Inspection Services Industry Revenue billion Forecast, by Region 2020 & 2033
- Table 4: Global NDT Inspection Services Industry Revenue billion Forecast, by Testing Technology 2020 & 2033
- Table 5: Global NDT Inspection Services Industry Revenue billion Forecast, by End-user Industry 2020 & 2033
- Table 6: Global NDT Inspection Services Industry Revenue billion Forecast, by Country 2020 & 2033
- Table 7: United States NDT Inspection Services Industry Revenue (billion) Forecast, by Application 2020 & 2033
- Table 8: Canada NDT Inspection Services Industry Revenue (billion) Forecast, by Application 2020 & 2033
- Table 9: Global NDT Inspection Services Industry Revenue billion Forecast, by Testing Technology 2020 & 2033
- Table 10: Global NDT Inspection Services Industry Revenue billion Forecast, by End-user Industry 2020 & 2033
- Table 11: Global NDT Inspection Services Industry Revenue billion Forecast, by Country 2020 & 2033
- Table 12: United Kingdom NDT Inspection Services Industry Revenue (billion) Forecast, by Application 2020 & 2033
- Table 13: Germany NDT Inspection Services Industry Revenue (billion) Forecast, by Application 2020 & 2033
- Table 14: France NDT Inspection Services Industry Revenue (billion) Forecast, by Application 2020 & 2033
- Table 15: Rest of Europe NDT Inspection Services Industry Revenue (billion) Forecast, by Application 2020 & 2033
- Table 16: Global NDT Inspection Services Industry Revenue billion Forecast, by Testing Technology 2020 & 2033
- Table 17: Global NDT Inspection Services Industry Revenue billion Forecast, by End-user Industry 2020 & 2033
- Table 18: Global NDT Inspection Services Industry Revenue billion Forecast, by Country 2020 & 2033
- Table 19: China NDT Inspection Services Industry Revenue (billion) Forecast, by Application 2020 & 2033
- Table 20: Japan NDT Inspection Services Industry Revenue (billion) Forecast, by Application 2020 & 2033
- Table 21: India NDT Inspection Services Industry Revenue (billion) Forecast, by Application 2020 & 2033
- Table 22: Rest of Asia Pacific NDT Inspection Services Industry Revenue (billion) Forecast, by Application 2020 & 2033
- Table 23: Global NDT Inspection Services Industry Revenue billion Forecast, by Testing Technology 2020 & 2033
- Table 24: Global NDT Inspection Services Industry Revenue billion Forecast, by End-user Industry 2020 & 2033
- Table 25: Global NDT Inspection Services Industry Revenue billion Forecast, by Country 2020 & 2033
- Table 26: Global NDT Inspection Services Industry Revenue billion Forecast, by Testing Technology 2020 & 2033
- Table 27: Global NDT Inspection Services Industry Revenue billion Forecast, by End-user Industry 2020 & 2033
- Table 28: Global NDT Inspection Services Industry Revenue billion Forecast, by Country 2020 & 2033
Frequently Asked Questions
1. What is the projected Compound Annual Growth Rate (CAGR) of the NDT Inspection Services Industry?
The projected CAGR is approximately 6.5%.
2. Which companies are prominent players in the NDT Inspection Services Industry?
Key companies in the market include Intertek Group Plc, MISTRAS Group, Mitchell Laboratories Inc, Magnaflux Corp *List Not Exhaustive, Jan-Kens Enameling Co, GE Measurement and Control Company (Baker & Hughes Company), LynX Inspection Inc, Olympus Corporation, Acuren Inspection Inc, Applus Services S A.
3. What are the main segments of the NDT Inspection Services Industry?
The market segments include Testing Technology, End-user Industry.
4. Can you provide details about the market size?
The market size is estimated to be USD 18.17 billion as of 2022.
5. What are some drivers contributing to market growth?
; Stringent Regulations Mandating Safety Standards; Innovation and Advancement in NDT Inspection Technology; Lack of Skilled Personnel and Training Facilities.
6. What are the notable trends driving market growth?
Aerospace Industry is Expected to Account for a Major Share of the Market.
7. Are there any restraints impacting market growth?
; Reluctance to Adopt NDT Techniques.
8. Can you provide examples of recent developments in the market?
N/A
9. What pricing options are available for accessing the report?
Pricing options include single-user, multi-user, and enterprise licenses priced at USD 4750, USD 5250, and USD 8750 respectively.
10. Is the market size provided in terms of value or volume?
The market size is provided in terms of value, measured in billion.
11. Are there any specific market keywords associated with the report?
Yes, the market keyword associated with the report is "NDT Inspection Services Industry," which aids in identifying and referencing the specific market segment covered.
12. How do I determine which pricing option suits my needs best?
The pricing options vary based on user requirements and access needs. Individual users may opt for single-user licenses, while businesses requiring broader access may choose multi-user or enterprise licenses for cost-effective access to the report.
13. Are there any additional resources or data provided in the NDT Inspection Services Industry report?
While the report offers comprehensive insights, it's advisable to review the specific contents or supplementary materials provided to ascertain if additional resources or data are available.
14. How can I stay updated on further developments or reports in the NDT Inspection Services Industry?
To stay informed about further developments, trends, and reports in the NDT Inspection Services Industry, consider subscribing to industry newsletters, following relevant companies and organizations, or regularly checking reputable industry news sources and publications.
Methodology
Step 1 - Identification of Relevant Samples Size from Population Database


Step 2 - Approaches for Defining Global Market Size (Value, Volume* & Price*)

Note*: In applicable scenarios
Step 3 - Data Sources
Primary Research
- Web Analytics
- Survey Reports
- Research Institute
- Latest Research Reports
- Opinion Leaders
Secondary Research
- Annual Reports
- White Paper
- Latest Press Release
- Industry Association
- Paid Database
- Investor Presentations

Step 4 - Data Triangulation
Involves using different sources of information in order to increase the validity of a study
These sources are likely to be stakeholders in a program - participants, other researchers, program staff, other community members, and so on.
Then we put all data in single framework & apply various statistical tools to find out the dynamic on the market.
During the analysis stage, feedback from the stakeholder groups would be compared to determine areas of agreement as well as areas of divergence