

Key Insights
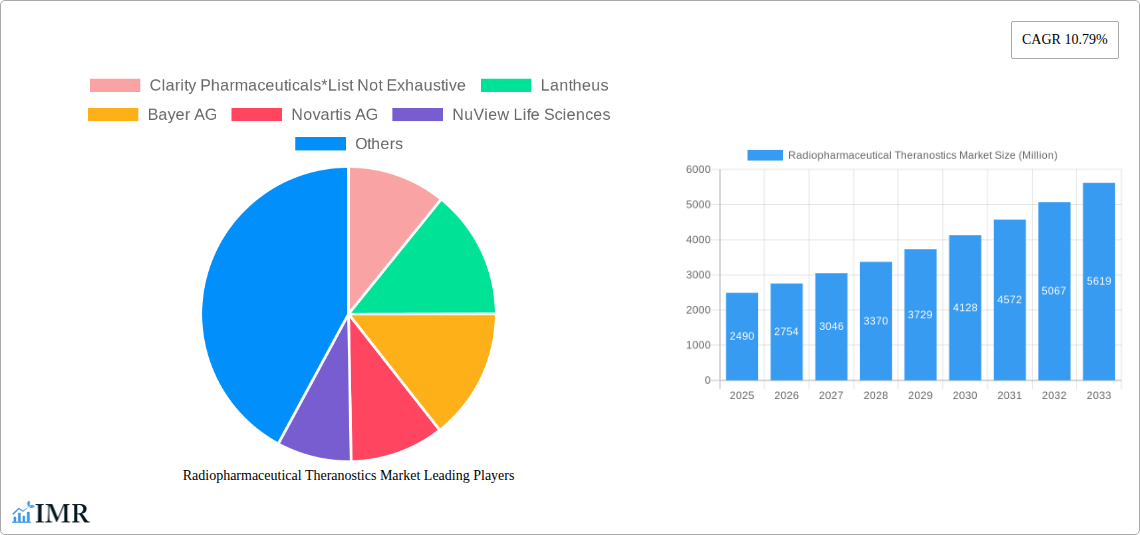
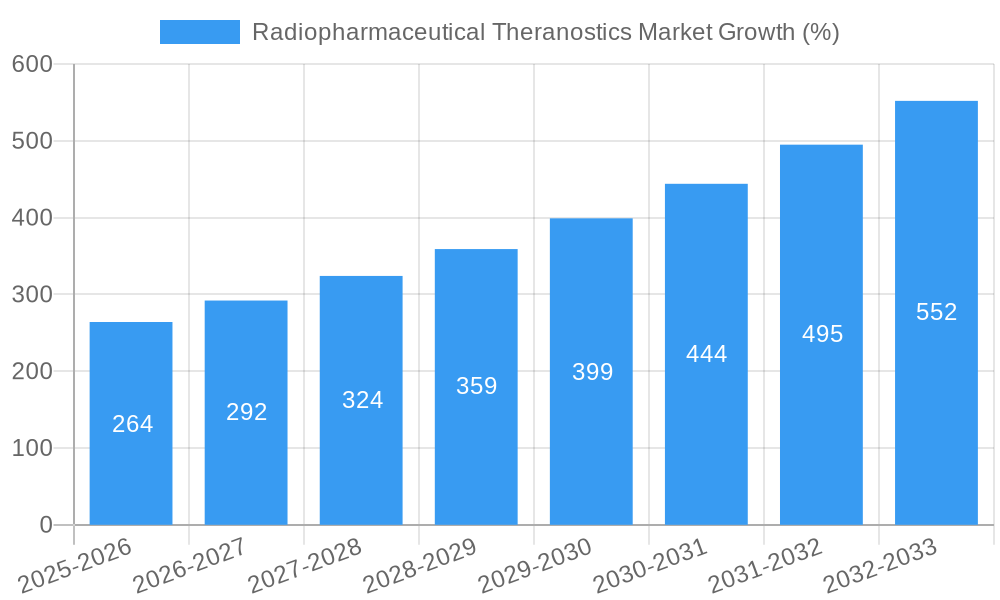
The radiopharmaceutical theranostics market is experiencing robust growth, projected to reach \$2.49 billion in 2025 and expand at a Compound Annual Growth Rate (CAGR) of 10.79% from 2025 to 2033. This significant expansion is driven by several key factors. Firstly, the increasing prevalence of cancer and other chronic diseases necessitates advanced diagnostic and therapeutic tools. Radiopharmaceutical theranostics, combining diagnostic imaging and targeted therapy, offers a personalized and precise approach, significantly improving patient outcomes and reducing side effects compared to traditional methods. Secondly, ongoing technological advancements, such as the development of novel radioisotopes and improved targeting agents, are enhancing the efficacy and safety of these treatments. Furthermore, growing investments in research and development by pharmaceutical companies and government agencies are fueling the market's growth. Finally, the rising adoption of advanced imaging technologies in hospitals and diagnostic centers contributes to the expanding market. The oncology segment currently holds the largest market share within the application category, reflecting the high prevalence of cancer and the effectiveness of theranostic approaches in cancer treatment.
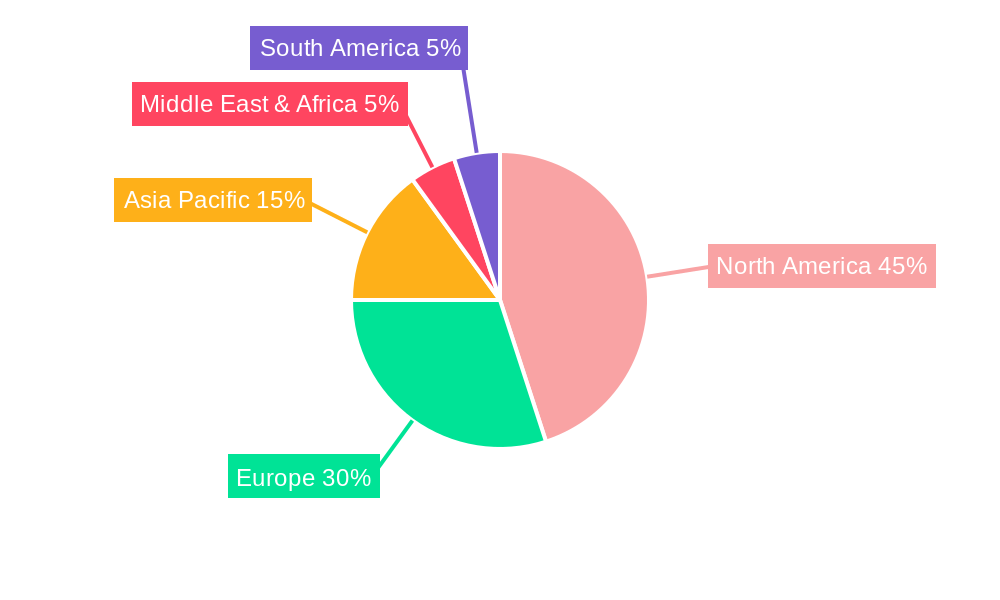
Segment-wise, companion diagnostic radiopharmaceuticals are expected to witness faster growth owing to their crucial role in guiding personalized treatment strategies. Geographically, North America and Europe currently dominate the market, primarily due to the presence of established healthcare infrastructure, high adoption rates of advanced technologies, and increased healthcare expenditure. However, the Asia-Pacific region is expected to exhibit substantial growth during the forecast period, driven by increasing healthcare awareness, rising disposable incomes, and a growing geriatric population. Competitive landscape analysis reveals the presence of major players such as Clarity Pharmaceuticals, Lantheus, Bayer AG, and Novartis AG, contributing to innovation and market expansion through continuous research and development efforts and strategic collaborations. While challenges such as regulatory hurdles and high manufacturing costs exist, the overall market outlook remains highly positive, underpinned by the substantial unmet clinical needs and ongoing technological breakthroughs.
Radiopharmaceutical Theranostics Market: A Comprehensive Report (2019-2033)
This in-depth report provides a comprehensive analysis of the Radiopharmaceutical Theranostics market, encompassing market dynamics, growth trends, regional dominance, product landscape, key players, and future outlook. The study period covers 2019-2033, with 2025 serving as the base and estimated year. The report is essential for industry professionals, investors, and researchers seeking to understand this rapidly evolving sector. The parent market is the broader nuclear medicine market, while the child market is focused specifically on theranostic applications.
Radiopharmaceutical Theranostics Market Dynamics & Structure
The radiopharmaceutical theranostics market is characterized by moderate concentration, with key players such as Clarity Pharmaceuticals, Lantheus, Bayer AG, and Novartis AG holding significant market share. Technological innovation, particularly in targeted delivery systems and novel radioisotopes, is a primary growth driver. Stringent regulatory frameworks governing radiopharmaceutical development and approval impact market entry and expansion. Competition from alternative diagnostic and therapeutic modalities exists, although the unique advantages of theranostics, such as personalized medicine approaches, maintain market appeal. The market is also shaped by evolving end-user demographics, including an aging population with increased cancer prevalence. M&A activity is significant, reflecting the strategic importance of this sector. In recent years, approximately xx M&A deals have been recorded, leading to an increase of xx% in market consolidation.
- Market Concentration: Moderately concentrated, with top 5 players holding approximately xx% market share in 2025.
- Technological Innovation: Focus on targeted therapies, improved imaging techniques, and novel radioisotopes.
- Regulatory Landscape: Stringent approval processes impacting time-to-market and market entry.
- Competitive Substitutes: Alternative diagnostic and treatment methods exert competitive pressure.
- End-User Demographics: Aging population and rising cancer incidence fuels market growth.
- M&A Activity: Significant M&A activity consolidating market share and driving innovation.
Radiopharmaceutical Theranostics Market Growth Trends & Insights
The radiopharmaceutical theranostics market is experiencing robust growth, driven by technological advancements, increasing adoption rates, and a growing understanding of the benefits of personalized medicine. The market size is projected to reach xx million units by 2025, exhibiting a CAGR of xx% during the forecast period (2025-2033). This growth is fueled by increased adoption of targeted therapeutic radiopharmaceuticals in oncology, coupled with technological disruptions such as the development of more efficient radioisotope production methods and improved imaging capabilities. Consumer behavior shifts towards personalized and precision medicine further contribute to market expansion. Market penetration is expected to reach xx% by 2033, driven primarily by the increasing prevalence of cancers and cardiovascular diseases, alongside improved reimbursement policies.
Dominant Regions, Countries, or Segments in Radiopharmaceutical Theranostics Market
North America currently dominates the radiopharmaceutical theranostics market, holding approximately xx% of the market share in 2025, followed by Europe with xx%. This dominance is attributed to factors such as high healthcare expenditure, robust regulatory frameworks supporting innovation, and a large patient pool. Within the segments, Targeted Therapeutic Radiopharmaceuticals holds the largest share (xx% in 2025) by type due to increasing demand for effective cancer treatments. The Lutetium (Lu)-based radioisotopes segment leads by radioisotope type, driven by its effectiveness in targeted alpha therapy. Cyclotrons are the dominant source, contributing xx% of the market due to higher production capacity and flexibility compared to nuclear reactors. Oncology applications are the main driver, holding xx% of the market due to the increasing prevalence of various cancers, followed by cardiology applications. Hospitals constitute the largest end-user segment, accounting for approximately xx% of the market share.
- North America: High healthcare expenditure, robust R&D infrastructure, and strong regulatory support.
- Europe: Significant investments in healthcare, established pharmaceutical industry, and substantial research initiatives.
- Targeted Therapeutic Radiopharmaceuticals: High efficacy and increasing adoption in cancer treatment.
- Lutetium (Lu)-based Radioisotopes: Superior therapeutic efficacy in targeted alpha therapy.
- Cyclotrons: High production capacity and flexibility for customized radioisotope production.
- Oncology Applications: Increasing cancer prevalence and demand for effective treatments.
- Hospitals: Large-scale deployment of radiopharmaceutical therapies and diagnostic imaging.
Radiopharmaceutical Theranostics Market Product Landscape
The radiopharmaceutical theranostics market is characterized by continuous innovation in radioisotope production, targeting vectors, and imaging techniques. Products are increasingly focused on improving therapeutic efficacy, reducing side effects, and enhancing patient outcomes. Recent advancements include the development of novel radioisotopes with improved targeting capabilities, and the use of advanced imaging modalities for precise treatment planning and monitoring. Unique selling propositions include personalized treatment plans and minimally invasive procedures. Technological advancements in AI and machine learning are improving treatment planning and dosage optimization.
Key Drivers, Barriers & Challenges in Radiopharmaceutical Theranostics Market
Key Drivers: Technological advancements in radioisotope production and targeting, increasing prevalence of cancers and other targeted diseases, growing adoption of personalized medicine, and supportive regulatory policies are driving market expansion. For example, the development of longer-lasting radioisotopes is expanding treatment options.
Key Barriers & Challenges: High development costs, stringent regulatory approvals, complex manufacturing processes, and potential supply chain disruptions hinder market growth. Regulatory hurdles contribute to delayed product launches and limited market entry. The cost of cyclotrons and other infrastructure poses a significant barrier for smaller companies.
Emerging Opportunities in Radiopharmaceutical Theranostics Market
Untapped markets in developing countries present significant growth potential. The increasing prevalence of theranostics in combination with immunotherapy represents a key emerging opportunity. Development of novel radioisotopes and targeting vectors will continue to expand treatment options and improve efficacy. The integration of AI and machine learning into treatment planning and dosage optimization is poised to transform the field.
Growth Accelerators in the Radiopharmaceutical Theranostics Market Industry
Strategic partnerships between pharmaceutical companies and research institutions are accelerating innovation and market penetration. Technological breakthroughs in radioisotope production and delivery systems are constantly improving treatment efficacy and broadening treatment options. Market expansion into developing countries with increasing healthcare budgets creates new opportunities for growth.
Key Players Shaping the Radiopharmaceutical Theranostics Market Market
- Clarity Pharmaceuticals
- Lantheus
- Bayer AG
- Novartis AG
- NuView Life Sciences
- Telix Pharmaceuticals Limited
- GE HealthCare
- Cardinal Health
- ARICEUM THERAPEUTICS
- Curium
- Jubilant Radiopharma
Notable Milestones in Radiopharmaceutical Theranostics Market Sector
- March 2023: Radiopharm Theranostics plans to acquire Pharma15 Corporation, expanding its portfolio in prostate cancer therapies.
- March 2023: Radiopharm Theranostics and GenesisCare initiate a two-year research collaboration focusing on novel radiopharmaceuticals for complex cancers.
In-Depth Radiopharmaceutical Theranostics Market Market Outlook
The radiopharmaceutical theranostics market is poised for continued robust growth, driven by technological advancements, increasing adoption rates, and the growing demand for personalized medicine. Future market potential is substantial, particularly in expanding treatment options for a wider range of diseases. Strategic partnerships and collaborations are crucial for fostering innovation and accelerating market penetration. The focus on developing more effective and safer therapies will continue to shape the market landscape, leading to improved patient outcomes and long-term growth.
Radiopharmaceutical Theranostics Market Segmentation
-
1. Type
- 1.1. Companion Diagnostic Radiopharmaceuticals
- 1.2. Targeted Therapeutic Radiopharmaceuticals
-
2. Radioisotopes
- 2.1. Technetium-99
- 2.2. Gallium-68
- 2.3. Iodine-131
- 2.4. Lutetium (Lu)- 177
- 2.5. Copper (Cu)- 67 & 64
- 2.6. Other Radioisotopes
-
3. Source
- 3.1. Nuclear Reactors
- 3.2. Cyclotrons
-
4. Application
- 4.1. Oncology
- 4.2. Cardiology
- 4.3. Neurology
- 4.4. Other Applications
-
5. End User
- 5.1. Hospitals
- 5.2. Diagnostic Imaging Centers
- 5.3. Research Institutes
- 5.4. Other End Users
Radiopharmaceutical Theranostics Market Segmentation By Geography
-
1. North America
- 1.1. United States
- 1.2. Canada
- 1.3. Mexico
-
2. Europe
- 2.1. Germany
- 2.2. United Kingdom
- 2.3. France
- 2.4. Italy
- 2.5. Spain
- 2.6. Rest of Europe
-
3. Asia Pacific
- 3.1. China
- 3.2. Japan
- 3.3. India
- 3.4. Australia
- 3.5. South Korea
- 3.6. Rest of Asia Pacific
-
4. Middle East and Africa
- 4.1. GCC
- 4.2. South Africa
- 4.3. Rest of Middle East and Africa
-
5. South America
- 5.1. Brazil
- 5.2. Argentina
- 5.3. Rest of South America
Radiopharmaceutical Theranostics Market REPORT HIGHLIGHTS
| Aspects | Details |
|---|---|
| Study Period | 2019-2033 |
| Base Year | 2024 |
| Estimated Year | 2025 |
| Forecast Period | 2025-2033 |
| Historical Period | 2019-2024 |
| Growth Rate | CAGR of 10.79% from 2019-2033 |
| Segmentation |
|
Table of Contents
- 1. Introduction
- 1.1. Research Scope
- 1.2. Market Segmentation
- 1.3. Research Methodology
- 1.4. Definitions and Assumptions
- 2. Executive Summary
- 2.1. Introduction
- 3. Market Dynamics
- 3.1. Introduction
- 3.2. Market Drivers
- 3.2.1. Advancements in Targeted Cancer Therapies; Growing Emphasis on Personalized Medicine; Expanding Applications in Diagnostic Imaging
- 3.3. Market Restrains
- 3.3.1. Supply Chain Complexities and Limited Production Capacity; Regulatory Challenges and Approval Processes
- 3.4. Market Trends
- 3.4.1. The Companion Diagnostic Radiopharmaceuticals Segment is Expected to Dominate the Radiopharmaceutical Theranostics Market During the Forecast Period
- 4. Market Factor Analysis
- 4.1. Porters Five Forces
- 4.2. Supply/Value Chain
- 4.3. PESTEL analysis
- 4.4. Market Entropy
- 4.5. Patent/Trademark Analysis
- 5. Global Radiopharmaceutical Theranostics Market Analysis, Insights and Forecast, 2019-2031
- 5.1. Market Analysis, Insights and Forecast - by Type
- 5.1.1. Companion Diagnostic Radiopharmaceuticals
- 5.1.2. Targeted Therapeutic Radiopharmaceuticals
- 5.2. Market Analysis, Insights and Forecast - by Radioisotopes
- 5.2.1. Technetium-99
- 5.2.2. Gallium-68
- 5.2.3. Iodine-131
- 5.2.4. Lutetium (Lu)- 177
- 5.2.5. Copper (Cu)- 67 & 64
- 5.2.6. Other Radioisotopes
- 5.3. Market Analysis, Insights and Forecast - by Source
- 5.3.1. Nuclear Reactors
- 5.3.2. Cyclotrons
- 5.4. Market Analysis, Insights and Forecast - by Application
- 5.4.1. Oncology
- 5.4.2. Cardiology
- 5.4.3. Neurology
- 5.4.4. Other Applications
- 5.5. Market Analysis, Insights and Forecast - by End User
- 5.5.1. Hospitals
- 5.5.2. Diagnostic Imaging Centers
- 5.5.3. Research Institutes
- 5.5.4. Other End Users
- 5.6. Market Analysis, Insights and Forecast - by Region
- 5.6.1. North America
- 5.6.2. Europe
- 5.6.3. Asia Pacific
- 5.6.4. Middle East and Africa
- 5.6.5. South America
- 5.1. Market Analysis, Insights and Forecast - by Type
- 6. North America Radiopharmaceutical Theranostics Market Analysis, Insights and Forecast, 2019-2031
- 6.1. Market Analysis, Insights and Forecast - by Type
- 6.1.1. Companion Diagnostic Radiopharmaceuticals
- 6.1.2. Targeted Therapeutic Radiopharmaceuticals
- 6.2. Market Analysis, Insights and Forecast - by Radioisotopes
- 6.2.1. Technetium-99
- 6.2.2. Gallium-68
- 6.2.3. Iodine-131
- 6.2.4. Lutetium (Lu)- 177
- 6.2.5. Copper (Cu)- 67 & 64
- 6.2.6. Other Radioisotopes
- 6.3. Market Analysis, Insights and Forecast - by Source
- 6.3.1. Nuclear Reactors
- 6.3.2. Cyclotrons
- 6.4. Market Analysis, Insights and Forecast - by Application
- 6.4.1. Oncology
- 6.4.2. Cardiology
- 6.4.3. Neurology
- 6.4.4. Other Applications
- 6.5. Market Analysis, Insights and Forecast - by End User
- 6.5.1. Hospitals
- 6.5.2. Diagnostic Imaging Centers
- 6.5.3. Research Institutes
- 6.5.4. Other End Users
- 6.1. Market Analysis, Insights and Forecast - by Type
- 7. Europe Radiopharmaceutical Theranostics Market Analysis, Insights and Forecast, 2019-2031
- 7.1. Market Analysis, Insights and Forecast - by Type
- 7.1.1. Companion Diagnostic Radiopharmaceuticals
- 7.1.2. Targeted Therapeutic Radiopharmaceuticals
- 7.2. Market Analysis, Insights and Forecast - by Radioisotopes
- 7.2.1. Technetium-99
- 7.2.2. Gallium-68
- 7.2.3. Iodine-131
- 7.2.4. Lutetium (Lu)- 177
- 7.2.5. Copper (Cu)- 67 & 64
- 7.2.6. Other Radioisotopes
- 7.3. Market Analysis, Insights and Forecast - by Source
- 7.3.1. Nuclear Reactors
- 7.3.2. Cyclotrons
- 7.4. Market Analysis, Insights and Forecast - by Application
- 7.4.1. Oncology
- 7.4.2. Cardiology
- 7.4.3. Neurology
- 7.4.4. Other Applications
- 7.5. Market Analysis, Insights and Forecast - by End User
- 7.5.1. Hospitals
- 7.5.2. Diagnostic Imaging Centers
- 7.5.3. Research Institutes
- 7.5.4. Other End Users
- 7.1. Market Analysis, Insights and Forecast - by Type
- 8. Asia Pacific Radiopharmaceutical Theranostics Market Analysis, Insights and Forecast, 2019-2031
- 8.1. Market Analysis, Insights and Forecast - by Type
- 8.1.1. Companion Diagnostic Radiopharmaceuticals
- 8.1.2. Targeted Therapeutic Radiopharmaceuticals
- 8.2. Market Analysis, Insights and Forecast - by Radioisotopes
- 8.2.1. Technetium-99
- 8.2.2. Gallium-68
- 8.2.3. Iodine-131
- 8.2.4. Lutetium (Lu)- 177
- 8.2.5. Copper (Cu)- 67 & 64
- 8.2.6. Other Radioisotopes
- 8.3. Market Analysis, Insights and Forecast - by Source
- 8.3.1. Nuclear Reactors
- 8.3.2. Cyclotrons
- 8.4. Market Analysis, Insights and Forecast - by Application
- 8.4.1. Oncology
- 8.4.2. Cardiology
- 8.4.3. Neurology
- 8.4.4. Other Applications
- 8.5. Market Analysis, Insights and Forecast - by End User
- 8.5.1. Hospitals
- 8.5.2. Diagnostic Imaging Centers
- 8.5.3. Research Institutes
- 8.5.4. Other End Users
- 8.1. Market Analysis, Insights and Forecast - by Type
- 9. Middle East and Africa Radiopharmaceutical Theranostics Market Analysis, Insights and Forecast, 2019-2031
- 9.1. Market Analysis, Insights and Forecast - by Type
- 9.1.1. Companion Diagnostic Radiopharmaceuticals
- 9.1.2. Targeted Therapeutic Radiopharmaceuticals
- 9.2. Market Analysis, Insights and Forecast - by Radioisotopes
- 9.2.1. Technetium-99
- 9.2.2. Gallium-68
- 9.2.3. Iodine-131
- 9.2.4. Lutetium (Lu)- 177
- 9.2.5. Copper (Cu)- 67 & 64
- 9.2.6. Other Radioisotopes
- 9.3. Market Analysis, Insights and Forecast - by Source
- 9.3.1. Nuclear Reactors
- 9.3.2. Cyclotrons
- 9.4. Market Analysis, Insights and Forecast - by Application
- 9.4.1. Oncology
- 9.4.2. Cardiology
- 9.4.3. Neurology
- 9.4.4. Other Applications
- 9.5. Market Analysis, Insights and Forecast - by End User
- 9.5.1. Hospitals
- 9.5.2. Diagnostic Imaging Centers
- 9.5.3. Research Institutes
- 9.5.4. Other End Users
- 9.1. Market Analysis, Insights and Forecast - by Type
- 10. South America Radiopharmaceutical Theranostics Market Analysis, Insights and Forecast, 2019-2031
- 10.1. Market Analysis, Insights and Forecast - by Type
- 10.1.1. Companion Diagnostic Radiopharmaceuticals
- 10.1.2. Targeted Therapeutic Radiopharmaceuticals
- 10.2. Market Analysis, Insights and Forecast - by Radioisotopes
- 10.2.1. Technetium-99
- 10.2.2. Gallium-68
- 10.2.3. Iodine-131
- 10.2.4. Lutetium (Lu)- 177
- 10.2.5. Copper (Cu)- 67 & 64
- 10.2.6. Other Radioisotopes
- 10.3. Market Analysis, Insights and Forecast - by Source
- 10.3.1. Nuclear Reactors
- 10.3.2. Cyclotrons
- 10.4. Market Analysis, Insights and Forecast - by Application
- 10.4.1. Oncology
- 10.4.2. Cardiology
- 10.4.3. Neurology
- 10.4.4. Other Applications
- 10.5. Market Analysis, Insights and Forecast - by End User
- 10.5.1. Hospitals
- 10.5.2. Diagnostic Imaging Centers
- 10.5.3. Research Institutes
- 10.5.4. Other End Users
- 10.1. Market Analysis, Insights and Forecast - by Type
- 11. North America Radiopharmaceutical Theranostics Market Analysis, Insights and Forecast, 2019-2031
- 11.1. Market Analysis, Insights and Forecast - By Country/Sub-region
- 11.1.1 United States
- 11.1.2 Canada
- 11.1.3 Mexico
- 12. Europe Radiopharmaceutical Theranostics Market Analysis, Insights and Forecast, 2019-2031
- 12.1. Market Analysis, Insights and Forecast - By Country/Sub-region
- 12.1.1 Germany
- 12.1.2 United Kingdom
- 12.1.3 France
- 12.1.4 Italy
- 12.1.5 Spain
- 12.1.6 Rest of Europe
- 13. Asia Pacific Radiopharmaceutical Theranostics Market Analysis, Insights and Forecast, 2019-2031
- 13.1. Market Analysis, Insights and Forecast - By Country/Sub-region
- 13.1.1 China
- 13.1.2 Japan
- 13.1.3 India
- 13.1.4 Australia
- 13.1.5 South Korea
- 13.1.6 Rest of Asia Pacific
- 14. Middle East and Africa Radiopharmaceutical Theranostics Market Analysis, Insights and Forecast, 2019-2031
- 14.1. Market Analysis, Insights and Forecast - By Country/Sub-region
- 14.1.1 GCC
- 14.1.2 South Africa
- 14.1.3 Rest of Middle East and Africa
- 15. South America Radiopharmaceutical Theranostics Market Analysis, Insights and Forecast, 2019-2031
- 15.1. Market Analysis, Insights and Forecast - By Country/Sub-region
- 15.1.1 Brazil
- 15.1.2 Argentina
- 15.1.3 Rest of South America
- 16. Competitive Analysis
- 16.1. Global Market Share Analysis 2024
- 16.2. Company Profiles
- 16.2.1 Clarity Pharmaceuticals*List Not Exhaustive
- 16.2.1.1. Overview
- 16.2.1.2. Products
- 16.2.1.3. SWOT Analysis
- 16.2.1.4. Recent Developments
- 16.2.1.5. Financials (Based on Availability)
- 16.2.2 Lantheus
- 16.2.2.1. Overview
- 16.2.2.2. Products
- 16.2.2.3. SWOT Analysis
- 16.2.2.4. Recent Developments
- 16.2.2.5. Financials (Based on Availability)
- 16.2.3 Bayer AG
- 16.2.3.1. Overview
- 16.2.3.2. Products
- 16.2.3.3. SWOT Analysis
- 16.2.3.4. Recent Developments
- 16.2.3.5. Financials (Based on Availability)
- 16.2.4 Novartis AG
- 16.2.4.1. Overview
- 16.2.4.2. Products
- 16.2.4.3. SWOT Analysis
- 16.2.4.4. Recent Developments
- 16.2.4.5. Financials (Based on Availability)
- 16.2.5 NuView Life Sciences
- 16.2.5.1. Overview
- 16.2.5.2. Products
- 16.2.5.3. SWOT Analysis
- 16.2.5.4. Recent Developments
- 16.2.5.5. Financials (Based on Availability)
- 16.2.6 Telix Pharmaceuticals Limited
- 16.2.6.1. Overview
- 16.2.6.2. Products
- 16.2.6.3. SWOT Analysis
- 16.2.6.4. Recent Developments
- 16.2.6.5. Financials (Based on Availability)
- 16.2.7 GE HealthCare
- 16.2.7.1. Overview
- 16.2.7.2. Products
- 16.2.7.3. SWOT Analysis
- 16.2.7.4. Recent Developments
- 16.2.7.5. Financials (Based on Availability)
- 16.2.8 Cardinal Health
- 16.2.8.1. Overview
- 16.2.8.2. Products
- 16.2.8.3. SWOT Analysis
- 16.2.8.4. Recent Developments
- 16.2.8.5. Financials (Based on Availability)
- 16.2.9 ARICEUM THERAPEUTICS
- 16.2.9.1. Overview
- 16.2.9.2. Products
- 16.2.9.3. SWOT Analysis
- 16.2.9.4. Recent Developments
- 16.2.9.5. Financials (Based on Availability)
- 16.2.10 Curium
- 16.2.10.1. Overview
- 16.2.10.2. Products
- 16.2.10.3. SWOT Analysis
- 16.2.10.4. Recent Developments
- 16.2.10.5. Financials (Based on Availability)
- 16.2.11 Jubilant Radiopharma
- 16.2.11.1. Overview
- 16.2.11.2. Products
- 16.2.11.3. SWOT Analysis
- 16.2.11.4. Recent Developments
- 16.2.11.5. Financials (Based on Availability)
- 16.2.1 Clarity Pharmaceuticals*List Not Exhaustive
List of Figures
- Figure 1: Global Radiopharmaceutical Theranostics Market Revenue Breakdown (Million, %) by Region 2024 & 2032
- Figure 2: North America Radiopharmaceutical Theranostics Market Revenue (Million), by Country 2024 & 2032
- Figure 3: North America Radiopharmaceutical Theranostics Market Revenue Share (%), by Country 2024 & 2032
- Figure 4: Europe Radiopharmaceutical Theranostics Market Revenue (Million), by Country 2024 & 2032
- Figure 5: Europe Radiopharmaceutical Theranostics Market Revenue Share (%), by Country 2024 & 2032
- Figure 6: Asia Pacific Radiopharmaceutical Theranostics Market Revenue (Million), by Country 2024 & 2032
- Figure 7: Asia Pacific Radiopharmaceutical Theranostics Market Revenue Share (%), by Country 2024 & 2032
- Figure 8: Middle East and Africa Radiopharmaceutical Theranostics Market Revenue (Million), by Country 2024 & 2032
- Figure 9: Middle East and Africa Radiopharmaceutical Theranostics Market Revenue Share (%), by Country 2024 & 2032
- Figure 10: South America Radiopharmaceutical Theranostics Market Revenue (Million), by Country 2024 & 2032
- Figure 11: South America Radiopharmaceutical Theranostics Market Revenue Share (%), by Country 2024 & 2032
- Figure 12: North America Radiopharmaceutical Theranostics Market Revenue (Million), by Type 2024 & 2032
- Figure 13: North America Radiopharmaceutical Theranostics Market Revenue Share (%), by Type 2024 & 2032
- Figure 14: North America Radiopharmaceutical Theranostics Market Revenue (Million), by Radioisotopes 2024 & 2032
- Figure 15: North America Radiopharmaceutical Theranostics Market Revenue Share (%), by Radioisotopes 2024 & 2032
- Figure 16: North America Radiopharmaceutical Theranostics Market Revenue (Million), by Source 2024 & 2032
- Figure 17: North America Radiopharmaceutical Theranostics Market Revenue Share (%), by Source 2024 & 2032
- Figure 18: North America Radiopharmaceutical Theranostics Market Revenue (Million), by Application 2024 & 2032
- Figure 19: North America Radiopharmaceutical Theranostics Market Revenue Share (%), by Application 2024 & 2032
- Figure 20: North America Radiopharmaceutical Theranostics Market Revenue (Million), by End User 2024 & 2032
- Figure 21: North America Radiopharmaceutical Theranostics Market Revenue Share (%), by End User 2024 & 2032
- Figure 22: North America Radiopharmaceutical Theranostics Market Revenue (Million), by Country 2024 & 2032
- Figure 23: North America Radiopharmaceutical Theranostics Market Revenue Share (%), by Country 2024 & 2032
- Figure 24: Europe Radiopharmaceutical Theranostics Market Revenue (Million), by Type 2024 & 2032
- Figure 25: Europe Radiopharmaceutical Theranostics Market Revenue Share (%), by Type 2024 & 2032
- Figure 26: Europe Radiopharmaceutical Theranostics Market Revenue (Million), by Radioisotopes 2024 & 2032
- Figure 27: Europe Radiopharmaceutical Theranostics Market Revenue Share (%), by Radioisotopes 2024 & 2032
- Figure 28: Europe Radiopharmaceutical Theranostics Market Revenue (Million), by Source 2024 & 2032
- Figure 29: Europe Radiopharmaceutical Theranostics Market Revenue Share (%), by Source 2024 & 2032
- Figure 30: Europe Radiopharmaceutical Theranostics Market Revenue (Million), by Application 2024 & 2032
- Figure 31: Europe Radiopharmaceutical Theranostics Market Revenue Share (%), by Application 2024 & 2032
- Figure 32: Europe Radiopharmaceutical Theranostics Market Revenue (Million), by End User 2024 & 2032
- Figure 33: Europe Radiopharmaceutical Theranostics Market Revenue Share (%), by End User 2024 & 2032
- Figure 34: Europe Radiopharmaceutical Theranostics Market Revenue (Million), by Country 2024 & 2032
- Figure 35: Europe Radiopharmaceutical Theranostics Market Revenue Share (%), by Country 2024 & 2032
- Figure 36: Asia Pacific Radiopharmaceutical Theranostics Market Revenue (Million), by Type 2024 & 2032
- Figure 37: Asia Pacific Radiopharmaceutical Theranostics Market Revenue Share (%), by Type 2024 & 2032
- Figure 38: Asia Pacific Radiopharmaceutical Theranostics Market Revenue (Million), by Radioisotopes 2024 & 2032
- Figure 39: Asia Pacific Radiopharmaceutical Theranostics Market Revenue Share (%), by Radioisotopes 2024 & 2032
- Figure 40: Asia Pacific Radiopharmaceutical Theranostics Market Revenue (Million), by Source 2024 & 2032
- Figure 41: Asia Pacific Radiopharmaceutical Theranostics Market Revenue Share (%), by Source 2024 & 2032
- Figure 42: Asia Pacific Radiopharmaceutical Theranostics Market Revenue (Million), by Application 2024 & 2032
- Figure 43: Asia Pacific Radiopharmaceutical Theranostics Market Revenue Share (%), by Application 2024 & 2032
- Figure 44: Asia Pacific Radiopharmaceutical Theranostics Market Revenue (Million), by End User 2024 & 2032
- Figure 45: Asia Pacific Radiopharmaceutical Theranostics Market Revenue Share (%), by End User 2024 & 2032
- Figure 46: Asia Pacific Radiopharmaceutical Theranostics Market Revenue (Million), by Country 2024 & 2032
- Figure 47: Asia Pacific Radiopharmaceutical Theranostics Market Revenue Share (%), by Country 2024 & 2032
- Figure 48: Middle East and Africa Radiopharmaceutical Theranostics Market Revenue (Million), by Type 2024 & 2032
- Figure 49: Middle East and Africa Radiopharmaceutical Theranostics Market Revenue Share (%), by Type 2024 & 2032
- Figure 50: Middle East and Africa Radiopharmaceutical Theranostics Market Revenue (Million), by Radioisotopes 2024 & 2032
- Figure 51: Middle East and Africa Radiopharmaceutical Theranostics Market Revenue Share (%), by Radioisotopes 2024 & 2032
- Figure 52: Middle East and Africa Radiopharmaceutical Theranostics Market Revenue (Million), by Source 2024 & 2032
- Figure 53: Middle East and Africa Radiopharmaceutical Theranostics Market Revenue Share (%), by Source 2024 & 2032
- Figure 54: Middle East and Africa Radiopharmaceutical Theranostics Market Revenue (Million), by Application 2024 & 2032
- Figure 55: Middle East and Africa Radiopharmaceutical Theranostics Market Revenue Share (%), by Application 2024 & 2032
- Figure 56: Middle East and Africa Radiopharmaceutical Theranostics Market Revenue (Million), by End User 2024 & 2032
- Figure 57: Middle East and Africa Radiopharmaceutical Theranostics Market Revenue Share (%), by End User 2024 & 2032
- Figure 58: Middle East and Africa Radiopharmaceutical Theranostics Market Revenue (Million), by Country 2024 & 2032
- Figure 59: Middle East and Africa Radiopharmaceutical Theranostics Market Revenue Share (%), by Country 2024 & 2032
- Figure 60: South America Radiopharmaceutical Theranostics Market Revenue (Million), by Type 2024 & 2032
- Figure 61: South America Radiopharmaceutical Theranostics Market Revenue Share (%), by Type 2024 & 2032
- Figure 62: South America Radiopharmaceutical Theranostics Market Revenue (Million), by Radioisotopes 2024 & 2032
- Figure 63: South America Radiopharmaceutical Theranostics Market Revenue Share (%), by Radioisotopes 2024 & 2032
- Figure 64: South America Radiopharmaceutical Theranostics Market Revenue (Million), by Source 2024 & 2032
- Figure 65: South America Radiopharmaceutical Theranostics Market Revenue Share (%), by Source 2024 & 2032
- Figure 66: South America Radiopharmaceutical Theranostics Market Revenue (Million), by Application 2024 & 2032
- Figure 67: South America Radiopharmaceutical Theranostics Market Revenue Share (%), by Application 2024 & 2032
- Figure 68: South America Radiopharmaceutical Theranostics Market Revenue (Million), by End User 2024 & 2032
- Figure 69: South America Radiopharmaceutical Theranostics Market Revenue Share (%), by End User 2024 & 2032
- Figure 70: South America Radiopharmaceutical Theranostics Market Revenue (Million), by Country 2024 & 2032
- Figure 71: South America Radiopharmaceutical Theranostics Market Revenue Share (%), by Country 2024 & 2032
List of Tables
- Table 1: Global Radiopharmaceutical Theranostics Market Revenue Million Forecast, by Region 2019 & 2032
- Table 2: Global Radiopharmaceutical Theranostics Market Revenue Million Forecast, by Type 2019 & 2032
- Table 3: Global Radiopharmaceutical Theranostics Market Revenue Million Forecast, by Radioisotopes 2019 & 2032
- Table 4: Global Radiopharmaceutical Theranostics Market Revenue Million Forecast, by Source 2019 & 2032
- Table 5: Global Radiopharmaceutical Theranostics Market Revenue Million Forecast, by Application 2019 & 2032
- Table 6: Global Radiopharmaceutical Theranostics Market Revenue Million Forecast, by End User 2019 & 2032
- Table 7: Global Radiopharmaceutical Theranostics Market Revenue Million Forecast, by Region 2019 & 2032
- Table 8: Global Radiopharmaceutical Theranostics Market Revenue Million Forecast, by Country 2019 & 2032
- Table 9: United States Radiopharmaceutical Theranostics Market Revenue (Million) Forecast, by Application 2019 & 2032
- Table 10: Canada Radiopharmaceutical Theranostics Market Revenue (Million) Forecast, by Application 2019 & 2032
- Table 11: Mexico Radiopharmaceutical Theranostics Market Revenue (Million) Forecast, by Application 2019 & 2032
- Table 12: Global Radiopharmaceutical Theranostics Market Revenue Million Forecast, by Country 2019 & 2032
- Table 13: Germany Radiopharmaceutical Theranostics Market Revenue (Million) Forecast, by Application 2019 & 2032
- Table 14: United Kingdom Radiopharmaceutical Theranostics Market Revenue (Million) Forecast, by Application 2019 & 2032
- Table 15: France Radiopharmaceutical Theranostics Market Revenue (Million) Forecast, by Application 2019 & 2032
- Table 16: Italy Radiopharmaceutical Theranostics Market Revenue (Million) Forecast, by Application 2019 & 2032
- Table 17: Spain Radiopharmaceutical Theranostics Market Revenue (Million) Forecast, by Application 2019 & 2032
- Table 18: Rest of Europe Radiopharmaceutical Theranostics Market Revenue (Million) Forecast, by Application 2019 & 2032
- Table 19: Global Radiopharmaceutical Theranostics Market Revenue Million Forecast, by Country 2019 & 2032
- Table 20: China Radiopharmaceutical Theranostics Market Revenue (Million) Forecast, by Application 2019 & 2032
- Table 21: Japan Radiopharmaceutical Theranostics Market Revenue (Million) Forecast, by Application 2019 & 2032
- Table 22: India Radiopharmaceutical Theranostics Market Revenue (Million) Forecast, by Application 2019 & 2032
- Table 23: Australia Radiopharmaceutical Theranostics Market Revenue (Million) Forecast, by Application 2019 & 2032
- Table 24: South Korea Radiopharmaceutical Theranostics Market Revenue (Million) Forecast, by Application 2019 & 2032
- Table 25: Rest of Asia Pacific Radiopharmaceutical Theranostics Market Revenue (Million) Forecast, by Application 2019 & 2032
- Table 26: Global Radiopharmaceutical Theranostics Market Revenue Million Forecast, by Country 2019 & 2032
- Table 27: GCC Radiopharmaceutical Theranostics Market Revenue (Million) Forecast, by Application 2019 & 2032
- Table 28: South Africa Radiopharmaceutical Theranostics Market Revenue (Million) Forecast, by Application 2019 & 2032
- Table 29: Rest of Middle East and Africa Radiopharmaceutical Theranostics Market Revenue (Million) Forecast, by Application 2019 & 2032
- Table 30: Global Radiopharmaceutical Theranostics Market Revenue Million Forecast, by Country 2019 & 2032
- Table 31: Brazil Radiopharmaceutical Theranostics Market Revenue (Million) Forecast, by Application 2019 & 2032
- Table 32: Argentina Radiopharmaceutical Theranostics Market Revenue (Million) Forecast, by Application 2019 & 2032
- Table 33: Rest of South America Radiopharmaceutical Theranostics Market Revenue (Million) Forecast, by Application 2019 & 2032
- Table 34: Global Radiopharmaceutical Theranostics Market Revenue Million Forecast, by Type 2019 & 2032
- Table 35: Global Radiopharmaceutical Theranostics Market Revenue Million Forecast, by Radioisotopes 2019 & 2032
- Table 36: Global Radiopharmaceutical Theranostics Market Revenue Million Forecast, by Source 2019 & 2032
- Table 37: Global Radiopharmaceutical Theranostics Market Revenue Million Forecast, by Application 2019 & 2032
- Table 38: Global Radiopharmaceutical Theranostics Market Revenue Million Forecast, by End User 2019 & 2032
- Table 39: Global Radiopharmaceutical Theranostics Market Revenue Million Forecast, by Country 2019 & 2032
- Table 40: United States Radiopharmaceutical Theranostics Market Revenue (Million) Forecast, by Application 2019 & 2032
- Table 41: Canada Radiopharmaceutical Theranostics Market Revenue (Million) Forecast, by Application 2019 & 2032
- Table 42: Mexico Radiopharmaceutical Theranostics Market Revenue (Million) Forecast, by Application 2019 & 2032
- Table 43: Global Radiopharmaceutical Theranostics Market Revenue Million Forecast, by Type 2019 & 2032
- Table 44: Global Radiopharmaceutical Theranostics Market Revenue Million Forecast, by Radioisotopes 2019 & 2032
- Table 45: Global Radiopharmaceutical Theranostics Market Revenue Million Forecast, by Source 2019 & 2032
- Table 46: Global Radiopharmaceutical Theranostics Market Revenue Million Forecast, by Application 2019 & 2032
- Table 47: Global Radiopharmaceutical Theranostics Market Revenue Million Forecast, by End User 2019 & 2032
- Table 48: Global Radiopharmaceutical Theranostics Market Revenue Million Forecast, by Country 2019 & 2032
- Table 49: Germany Radiopharmaceutical Theranostics Market Revenue (Million) Forecast, by Application 2019 & 2032
- Table 50: United Kingdom Radiopharmaceutical Theranostics Market Revenue (Million) Forecast, by Application 2019 & 2032
- Table 51: France Radiopharmaceutical Theranostics Market Revenue (Million) Forecast, by Application 2019 & 2032
- Table 52: Italy Radiopharmaceutical Theranostics Market Revenue (Million) Forecast, by Application 2019 & 2032
- Table 53: Spain Radiopharmaceutical Theranostics Market Revenue (Million) Forecast, by Application 2019 & 2032
- Table 54: Rest of Europe Radiopharmaceutical Theranostics Market Revenue (Million) Forecast, by Application 2019 & 2032
- Table 55: Global Radiopharmaceutical Theranostics Market Revenue Million Forecast, by Type 2019 & 2032
- Table 56: Global Radiopharmaceutical Theranostics Market Revenue Million Forecast, by Radioisotopes 2019 & 2032
- Table 57: Global Radiopharmaceutical Theranostics Market Revenue Million Forecast, by Source 2019 & 2032
- Table 58: Global Radiopharmaceutical Theranostics Market Revenue Million Forecast, by Application 2019 & 2032
- Table 59: Global Radiopharmaceutical Theranostics Market Revenue Million Forecast, by End User 2019 & 2032
- Table 60: Global Radiopharmaceutical Theranostics Market Revenue Million Forecast, by Country 2019 & 2032
- Table 61: China Radiopharmaceutical Theranostics Market Revenue (Million) Forecast, by Application 2019 & 2032
- Table 62: Japan Radiopharmaceutical Theranostics Market Revenue (Million) Forecast, by Application 2019 & 2032
- Table 63: India Radiopharmaceutical Theranostics Market Revenue (Million) Forecast, by Application 2019 & 2032
- Table 64: Australia Radiopharmaceutical Theranostics Market Revenue (Million) Forecast, by Application 2019 & 2032
- Table 65: South Korea Radiopharmaceutical Theranostics Market Revenue (Million) Forecast, by Application 2019 & 2032
- Table 66: Rest of Asia Pacific Radiopharmaceutical Theranostics Market Revenue (Million) Forecast, by Application 2019 & 2032
- Table 67: Global Radiopharmaceutical Theranostics Market Revenue Million Forecast, by Type 2019 & 2032
- Table 68: Global Radiopharmaceutical Theranostics Market Revenue Million Forecast, by Radioisotopes 2019 & 2032
- Table 69: Global Radiopharmaceutical Theranostics Market Revenue Million Forecast, by Source 2019 & 2032
- Table 70: Global Radiopharmaceutical Theranostics Market Revenue Million Forecast, by Application 2019 & 2032
- Table 71: Global Radiopharmaceutical Theranostics Market Revenue Million Forecast, by End User 2019 & 2032
- Table 72: Global Radiopharmaceutical Theranostics Market Revenue Million Forecast, by Country 2019 & 2032
- Table 73: GCC Radiopharmaceutical Theranostics Market Revenue (Million) Forecast, by Application 2019 & 2032
- Table 74: South Africa Radiopharmaceutical Theranostics Market Revenue (Million) Forecast, by Application 2019 & 2032
- Table 75: Rest of Middle East and Africa Radiopharmaceutical Theranostics Market Revenue (Million) Forecast, by Application 2019 & 2032
- Table 76: Global Radiopharmaceutical Theranostics Market Revenue Million Forecast, by Type 2019 & 2032
- Table 77: Global Radiopharmaceutical Theranostics Market Revenue Million Forecast, by Radioisotopes 2019 & 2032
- Table 78: Global Radiopharmaceutical Theranostics Market Revenue Million Forecast, by Source 2019 & 2032
- Table 79: Global Radiopharmaceutical Theranostics Market Revenue Million Forecast, by Application 2019 & 2032
- Table 80: Global Radiopharmaceutical Theranostics Market Revenue Million Forecast, by End User 2019 & 2032
- Table 81: Global Radiopharmaceutical Theranostics Market Revenue Million Forecast, by Country 2019 & 2032
- Table 82: Brazil Radiopharmaceutical Theranostics Market Revenue (Million) Forecast, by Application 2019 & 2032
- Table 83: Argentina Radiopharmaceutical Theranostics Market Revenue (Million) Forecast, by Application 2019 & 2032
- Table 84: Rest of South America Radiopharmaceutical Theranostics Market Revenue (Million) Forecast, by Application 2019 & 2032
Frequently Asked Questions
1. What is the projected Compound Annual Growth Rate (CAGR) of the Radiopharmaceutical Theranostics Market?
The projected CAGR is approximately 10.79%.
2. Which companies are prominent players in the Radiopharmaceutical Theranostics Market?
Key companies in the market include Clarity Pharmaceuticals*List Not Exhaustive, Lantheus, Bayer AG, Novartis AG, NuView Life Sciences, Telix Pharmaceuticals Limited, GE HealthCare, Cardinal Health, ARICEUM THERAPEUTICS, Curium, Jubilant Radiopharma.
3. What are the main segments of the Radiopharmaceutical Theranostics Market?
The market segments include Type, Radioisotopes, Source, Application, End User.
4. Can you provide details about the market size?
The market size is estimated to be USD 2.49 Million as of 2022.
5. What are some drivers contributing to market growth?
Advancements in Targeted Cancer Therapies; Growing Emphasis on Personalized Medicine; Expanding Applications in Diagnostic Imaging.
6. What are the notable trends driving market growth?
The Companion Diagnostic Radiopharmaceuticals Segment is Expected to Dominate the Radiopharmaceutical Theranostics Market During the Forecast Period.
7. Are there any restraints impacting market growth?
Supply Chain Complexities and Limited Production Capacity; Regulatory Challenges and Approval Processes.
8. Can you provide examples of recent developments in the market?
March 2023: Australian radiopharmaceuticals manufacturer Radiopharm Theranostics, through its wholly-owned US subsidiary, planned to acquire Pharma15 Corporation, a private US-based venture developing next-generation therapeutic radiopharmaceuticals for prostate cancer.
9. What pricing options are available for accessing the report?
Pricing options include single-user, multi-user, and enterprise licenses priced at USD 4750, USD 5250, and USD 8750 respectively.
10. Is the market size provided in terms of value or volume?
The market size is provided in terms of value, measured in Million.
11. Are there any specific market keywords associated with the report?
Yes, the market keyword associated with the report is "Radiopharmaceutical Theranostics Market," which aids in identifying and referencing the specific market segment covered.
12. How do I determine which pricing option suits my needs best?
The pricing options vary based on user requirements and access needs. Individual users may opt for single-user licenses, while businesses requiring broader access may choose multi-user or enterprise licenses for cost-effective access to the report.
13. Are there any additional resources or data provided in the Radiopharmaceutical Theranostics Market report?
While the report offers comprehensive insights, it's advisable to review the specific contents or supplementary materials provided to ascertain if additional resources or data are available.
14. How can I stay updated on further developments or reports in the Radiopharmaceutical Theranostics Market?
To stay informed about further developments, trends, and reports in the Radiopharmaceutical Theranostics Market, consider subscribing to industry newsletters, following relevant companies and organizations, or regularly checking reputable industry news sources and publications.
Methodology
Step 1 - Identification of Relevant Samples Size from Population Database


Step 2 - Approaches for Defining Global Market Size (Value, Volume* & Price*)

Note*: In applicable scenarios
Step 3 - Data Sources
Primary Research
- Web Analytics
- Survey Reports
- Research Institute
- Latest Research Reports
- Opinion Leaders
Secondary Research
- Annual Reports
- White Paper
- Latest Press Release
- Industry Association
- Paid Database
- Investor Presentations

Step 4 - Data Triangulation
Involves using different sources of information in order to increase the validity of a study
These sources are likely to be stakeholders in a program - participants, other researchers, program staff, other community members, and so on.
Then we put all data in single framework & apply various statistical tools to find out the dynamic on the market.
During the analysis stage, feedback from the stakeholder groups would be compared to determine areas of agreement as well as areas of divergence
