

Key Insights
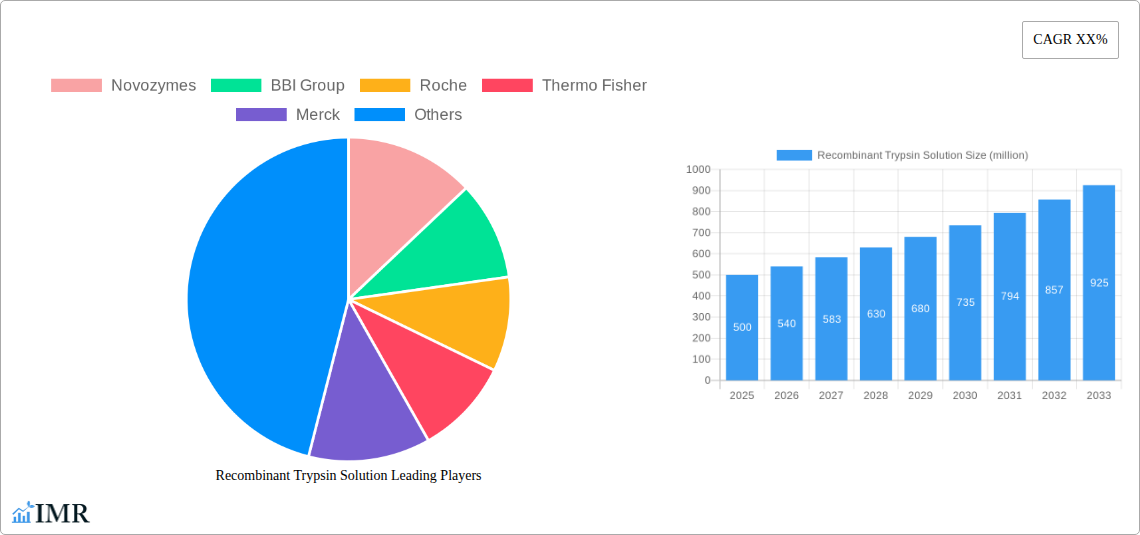
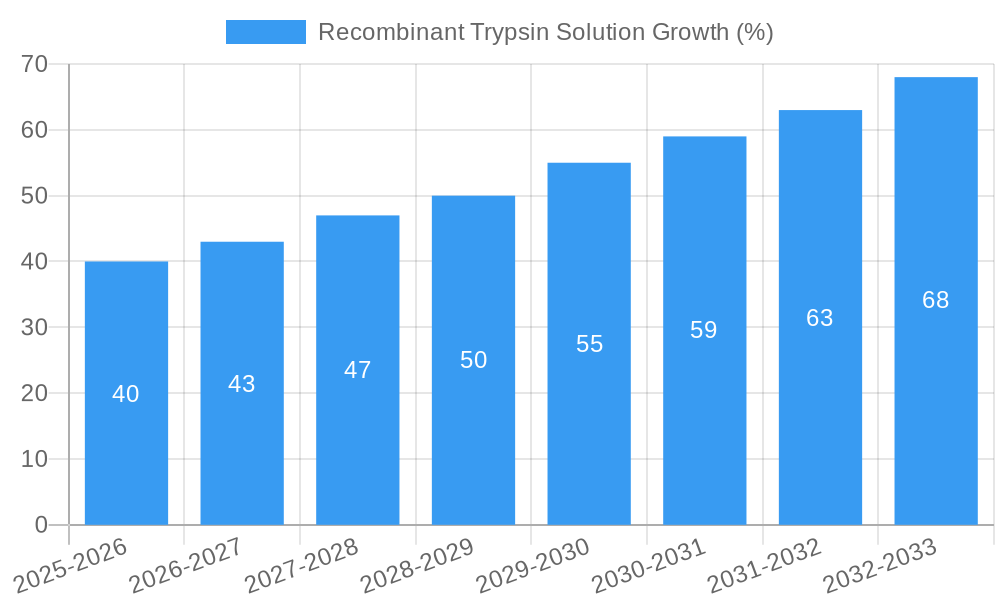
The recombinant trypsin solution market is experiencing robust growth, driven by increasing demand in various life science applications. The market's expansion is fueled by the advantages of recombinant trypsin over traditional porcine trypsin, including higher purity, consistent quality, and reduced risk of contamination, making it ideal for sensitive applications like cell culture and protein purification. The market size is estimated at $500 million in 2025, projecting a Compound Annual Growth Rate (CAGR) of 8% from 2025 to 2033. This growth is primarily attributed to advancements in biotechnology and pharmaceuticals, along with rising investments in research and development activities globally. Key market segments include research, pharmaceutical manufacturing, and diagnostic applications, with the research segment currently holding the largest market share. Major players like Novozymes, BBI Group, and Roche are driving innovation and expanding their product portfolios to cater to the growing demand. Furthermore, the increasing adoption of cell-based therapies and personalized medicine is expected to significantly contribute to market expansion in the forecast period. Geographical expansion, especially in emerging economies, presents significant growth opportunities for market players.
However, challenges like high production costs and stringent regulatory approvals for recombinant proteins are hindering market growth. Despite this, the ongoing development of cost-effective production methods and a rising preference for recombinant trypsin in various applications are expected to mitigate these challenges in the long run. The competitive landscape is characterized by both established industry giants and emerging players, leading to increased competition and innovation within the market. To maintain a competitive edge, companies are increasingly focusing on developing novel technologies and expanding their geographic reach to capture a larger market share. Future growth will depend on continuous technological advancements, regulatory approvals, and increasing collaborations between research institutions and industry players.
Recombinant Trypsin Solution Market Report: 2019-2033
This comprehensive report provides an in-depth analysis of the global Recombinant Trypsin Solution market, encompassing market dynamics, growth trends, regional segmentation, competitive landscape, and future outlook. The study period covers 2019-2033, with 2025 as the base and estimated year. The forecast period spans 2025-2033, and the historical period encompasses 2019-2024. This report is crucial for industry professionals, investors, and researchers seeking to understand and capitalize on the opportunities within this rapidly evolving market. The parent market is the enzyme market (valued at xx million units in 2025), and the child market is the life science research reagents market (valued at xx million units in 2025).
Recombinant Trypsin Solution Market Dynamics & Structure
The Recombinant Trypsin Solution market is characterized by moderate concentration, with key players like Novozymes, BBI Group, Roche, and Thermo Fisher holding significant market share (estimated at xx% collectively in 2025). Technological innovation, particularly in improving enzyme purity and stability, is a major driver. Stringent regulatory frameworks governing enzyme production and application influence market growth. Competitive substitutes, such as other proteolytic enzymes, exert pressure, while end-user demographics (primarily research institutions and pharmaceutical companies) shape demand. M&A activity in the past five years has been relatively low, with approximately xx deals recorded (2019-2024), mostly focused on smaller companies being acquired by larger players.
- Market Concentration: Moderately concentrated, with top 4 players holding xx% market share in 2025.
- Technological Innovation: Focus on enhanced purity, stability, and specific activity.
- Regulatory Framework: Stringent guidelines for enzyme production and use impact market dynamics.
- Competitive Substitutes: Presence of alternative proteolytic enzymes creates competitive pressure.
- End-User Demographics: Primarily research institutions and pharmaceutical companies.
- M&A Activity: Relatively low, with approximately xx deals recorded between 2019 and 2024.
Recombinant Trypsin Solution Growth Trends & Insights
The global Recombinant Trypsin Solution market exhibited a CAGR of xx% during the historical period (2019-2024), reaching a market size of xx million units in 2025. This growth is driven by increasing demand from the biotechnology and pharmaceutical industries, fueled by advancements in cell culture technologies and drug discovery research. The market penetration of recombinant trypsin is expected to increase further, driven by its superior purity, consistency, and ease of use compared to traditional trypsin sources. Technological disruptions, such as the development of novel enzyme engineering techniques, are continuously improving product performance. Consumer behavior shifts toward higher quality and more reliable reagents further contribute to market expansion. The forecast period (2025-2033) projects a CAGR of xx%, reaching a market size of xx million units by 2033.
Dominant Regions, Countries, or Segments in Recombinant Trypsin Solution
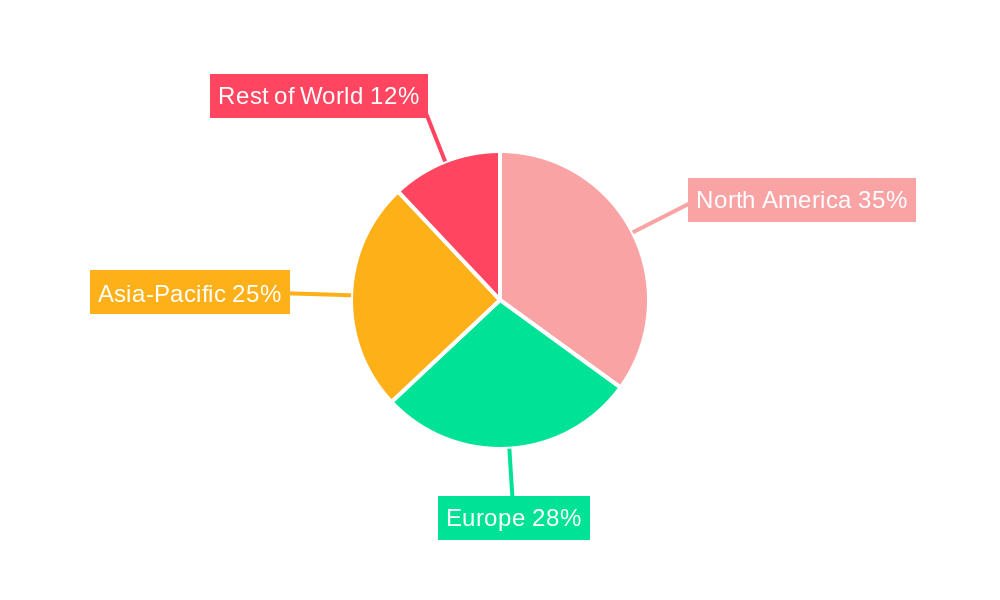
North America currently holds the largest market share in the recombinant trypsin solution market, driven by a robust life sciences research sector and strong regulatory support. This dominance is attributed to a high concentration of pharmaceutical and biotechnology companies, coupled with significant investments in research and development. Europe follows as a key region, with substantial growth potential driven by increasing government funding for research and development and growing demand from pharmaceutical companies. Asia-Pacific is emerging as a rapidly growing market, driven by increasing government initiatives promoting biotechnology innovation and a rising number of research institutions.
- North America: High concentration of biotech and pharma companies, strong R&D investment.
- Europe: Substantial growth potential, driven by government funding and pharmaceutical demand.
- Asia-Pacific: Rapidly emerging market with increasing R&D investment and government support.
Recombinant Trypsin Solution Product Landscape
Recombinant trypsin solutions are available in various formats, including liquid solutions, lyophilized powders, and immobilized enzymes, each tailored to specific applications. Innovations focus on enhancing enzymatic activity, improving stability, and reducing impurities. The unique selling propositions often include higher purity, consistent performance, and reduced batch-to-batch variability, making them suitable for diverse applications in cell culture, protein purification, and diagnostics. Technological advancements in protein engineering enhance enzyme specificity and efficiency.
Key Drivers, Barriers & Challenges in Recombinant Trypsin Solution
Key Drivers:
- Increasing demand from the biotechnology and pharmaceutical industries.
- Advancements in cell culture technologies and drug discovery research.
- Superior purity, consistency, and ease of use of recombinant trypsin compared to traditional sources.
Key Challenges:
- High production costs associated with recombinant protein expression.
- Stringent regulatory requirements for enzyme production and application.
- Competition from other proteolytic enzymes and alternative technologies. This results in an estimated xx% reduction in market growth annually.
Emerging Opportunities in Recombinant Trypsin Solution
Emerging opportunities include the development of novel trypsin variants with enhanced properties, expansion into new applications like regenerative medicine and personalized medicine, and exploring untapped markets in developing countries. Tailoring trypsin solutions for specific cell types or applications will also present significant growth opportunities. Furthermore, the development of advanced analytical methods for quality control and characterization will also boost adoption.
Growth Accelerators in the Recombinant Trypsin Solution Industry
Strategic partnerships between enzyme manufacturers and biotechnology companies are accelerating growth by improving access to advanced technologies and expanding market reach. Technological breakthroughs in enzyme engineering are constantly improving product performance and efficiency. Expanding into emerging markets and developing customized solutions for specific applications will unlock significant growth potential. Investments in R&D are also key in driving new product development and improved production processes.
Key Players Shaping the Recombinant Trypsin Solution Market
- Novozymes
- BBI Group
- Roche
- Thermo Fisher
- Merck
- Applied Biotechnology Institute
- Biological Industries
- Yaxin Bio
- Yocon Hengye Bio
- BasalMedia
- Biosera
Notable Milestones in Recombinant Trypsin Solution Sector
- 2020: Launch of a novel recombinant trypsin variant with improved stability by Novozymes.
- 2021: Acquisition of a smaller enzyme producer by Thermo Fisher, expanding its market share.
- 2022: Introduction of a new high-purity recombinant trypsin by BBI Group.
- 2023: Publication of several studies highlighting the benefits of recombinant trypsin in cell culture.
- 2024: Several regulatory approvals for new recombinant trypsin-based products are granted.
In-Depth Recombinant Trypsin Solution Market Outlook
The future of the recombinant trypsin solution market is bright, driven by sustained growth in the biotechnology and pharmaceutical industries and continuous innovations in enzyme technology. Strategic partnerships, technological breakthroughs, and expansion into new application areas will continue to propel market growth. The market is projected to witness significant expansion over the next decade, presenting lucrative opportunities for companies actively involved in research, development, and commercialization. The focus will be on developing highly specialized, high-quality products tailored to specific applications, maximizing efficiency, and streamlining production processes.
Recombinant Trypsin Solution Segmentation
-
1. Application
- 1.1. Insulin Manufacturing
- 1.2. Vaccines Manufacturing
- 1.3. Cell Culture
- 1.4. Other
-
2. Types
- 2.1. Solid
- 2.2. Liquid
Recombinant Trypsin Solution Segmentation By Geography
-
1. North America
- 1.1. United States
- 1.2. Canada
- 1.3. Mexico
-
2. South America
- 2.1. Brazil
- 2.2. Argentina
- 2.3. Rest of South America
-
3. Europe
- 3.1. United Kingdom
- 3.2. Germany
- 3.3. France
- 3.4. Italy
- 3.5. Spain
- 3.6. Russia
- 3.7. Benelux
- 3.8. Nordics
- 3.9. Rest of Europe
-
4. Middle East & Africa
- 4.1. Turkey
- 4.2. Israel
- 4.3. GCC
- 4.4. North Africa
- 4.5. South Africa
- 4.6. Rest of Middle East & Africa
-
5. Asia Pacific
- 5.1. China
- 5.2. India
- 5.3. Japan
- 5.4. South Korea
- 5.5. ASEAN
- 5.6. Oceania
- 5.7. Rest of Asia Pacific
Recombinant Trypsin Solution REPORT HIGHLIGHTS
| Aspects | Details |
|---|---|
| Study Period | 2019-2033 |
| Base Year | 2024 |
| Estimated Year | 2025 |
| Forecast Period | 2025-2033 |
| Historical Period | 2019-2024 |
| Growth Rate | CAGR of XX% from 2019-2033 |
| Segmentation |
|
Table of Contents
- 1. Introduction
- 1.1. Research Scope
- 1.2. Market Segmentation
- 1.3. Research Methodology
- 1.4. Definitions and Assumptions
- 2. Executive Summary
- 2.1. Introduction
- 3. Market Dynamics
- 3.1. Introduction
- 3.2. Market Drivers
- 3.3. Market Restrains
- 3.4. Market Trends
- 4. Market Factor Analysis
- 4.1. Porters Five Forces
- 4.2. Supply/Value Chain
- 4.3. PESTEL analysis
- 4.4. Market Entropy
- 4.5. Patent/Trademark Analysis
- 5. Global Recombinant Trypsin Solution Analysis, Insights and Forecast, 2019-2031
- 5.1. Market Analysis, Insights and Forecast - by Application
- 5.1.1. Insulin Manufacturing
- 5.1.2. Vaccines Manufacturing
- 5.1.3. Cell Culture
- 5.1.4. Other
- 5.2. Market Analysis, Insights and Forecast - by Types
- 5.2.1. Solid
- 5.2.2. Liquid
- 5.3. Market Analysis, Insights and Forecast - by Region
- 5.3.1. North America
- 5.3.2. South America
- 5.3.3. Europe
- 5.3.4. Middle East & Africa
- 5.3.5. Asia Pacific
- 5.1. Market Analysis, Insights and Forecast - by Application
- 6. North America Recombinant Trypsin Solution Analysis, Insights and Forecast, 2019-2031
- 6.1. Market Analysis, Insights and Forecast - by Application
- 6.1.1. Insulin Manufacturing
- 6.1.2. Vaccines Manufacturing
- 6.1.3. Cell Culture
- 6.1.4. Other
- 6.2. Market Analysis, Insights and Forecast - by Types
- 6.2.1. Solid
- 6.2.2. Liquid
- 6.1. Market Analysis, Insights and Forecast - by Application
- 7. South America Recombinant Trypsin Solution Analysis, Insights and Forecast, 2019-2031
- 7.1. Market Analysis, Insights and Forecast - by Application
- 7.1.1. Insulin Manufacturing
- 7.1.2. Vaccines Manufacturing
- 7.1.3. Cell Culture
- 7.1.4. Other
- 7.2. Market Analysis, Insights and Forecast - by Types
- 7.2.1. Solid
- 7.2.2. Liquid
- 7.1. Market Analysis, Insights and Forecast - by Application
- 8. Europe Recombinant Trypsin Solution Analysis, Insights and Forecast, 2019-2031
- 8.1. Market Analysis, Insights and Forecast - by Application
- 8.1.1. Insulin Manufacturing
- 8.1.2. Vaccines Manufacturing
- 8.1.3. Cell Culture
- 8.1.4. Other
- 8.2. Market Analysis, Insights and Forecast - by Types
- 8.2.1. Solid
- 8.2.2. Liquid
- 8.1. Market Analysis, Insights and Forecast - by Application
- 9. Middle East & Africa Recombinant Trypsin Solution Analysis, Insights and Forecast, 2019-2031
- 9.1. Market Analysis, Insights and Forecast - by Application
- 9.1.1. Insulin Manufacturing
- 9.1.2. Vaccines Manufacturing
- 9.1.3. Cell Culture
- 9.1.4. Other
- 9.2. Market Analysis, Insights and Forecast - by Types
- 9.2.1. Solid
- 9.2.2. Liquid
- 9.1. Market Analysis, Insights and Forecast - by Application
- 10. Asia Pacific Recombinant Trypsin Solution Analysis, Insights and Forecast, 2019-2031
- 10.1. Market Analysis, Insights and Forecast - by Application
- 10.1.1. Insulin Manufacturing
- 10.1.2. Vaccines Manufacturing
- 10.1.3. Cell Culture
- 10.1.4. Other
- 10.2. Market Analysis, Insights and Forecast - by Types
- 10.2.1. Solid
- 10.2.2. Liquid
- 10.1. Market Analysis, Insights and Forecast - by Application
- 11. Competitive Analysis
- 11.1. Global Market Share Analysis 2024
- 11.2. Company Profiles
- 11.2.1 Novozymes
- 11.2.1.1. Overview
- 11.2.1.2. Products
- 11.2.1.3. SWOT Analysis
- 11.2.1.4. Recent Developments
- 11.2.1.5. Financials (Based on Availability)
- 11.2.2 BBI Group
- 11.2.2.1. Overview
- 11.2.2.2. Products
- 11.2.2.3. SWOT Analysis
- 11.2.2.4. Recent Developments
- 11.2.2.5. Financials (Based on Availability)
- 11.2.3 Roche
- 11.2.3.1. Overview
- 11.2.3.2. Products
- 11.2.3.3. SWOT Analysis
- 11.2.3.4. Recent Developments
- 11.2.3.5. Financials (Based on Availability)
- 11.2.4 Thermo Fisher
- 11.2.4.1. Overview
- 11.2.4.2. Products
- 11.2.4.3. SWOT Analysis
- 11.2.4.4. Recent Developments
- 11.2.4.5. Financials (Based on Availability)
- 11.2.5 Merck
- 11.2.5.1. Overview
- 11.2.5.2. Products
- 11.2.5.3. SWOT Analysis
- 11.2.5.4. Recent Developments
- 11.2.5.5. Financials (Based on Availability)
- 11.2.6 Applied Biotechnology Institute
- 11.2.6.1. Overview
- 11.2.6.2. Products
- 11.2.6.3. SWOT Analysis
- 11.2.6.4. Recent Developments
- 11.2.6.5. Financials (Based on Availability)
- 11.2.7 Biological Industries
- 11.2.7.1. Overview
- 11.2.7.2. Products
- 11.2.7.3. SWOT Analysis
- 11.2.7.4. Recent Developments
- 11.2.7.5. Financials (Based on Availability)
- 11.2.8 Yaxin Bio
- 11.2.8.1. Overview
- 11.2.8.2. Products
- 11.2.8.3. SWOT Analysis
- 11.2.8.4. Recent Developments
- 11.2.8.5. Financials (Based on Availability)
- 11.2.9 Yocon Hengye Bio
- 11.2.9.1. Overview
- 11.2.9.2. Products
- 11.2.9.3. SWOT Analysis
- 11.2.9.4. Recent Developments
- 11.2.9.5. Financials (Based on Availability)
- 11.2.10 BasalMedia
- 11.2.10.1. Overview
- 11.2.10.2. Products
- 11.2.10.3. SWOT Analysis
- 11.2.10.4. Recent Developments
- 11.2.10.5. Financials (Based on Availability)
- 11.2.11 Biosera
- 11.2.11.1. Overview
- 11.2.11.2. Products
- 11.2.11.3. SWOT Analysis
- 11.2.11.4. Recent Developments
- 11.2.11.5. Financials (Based on Availability)
- 11.2.1 Novozymes
List of Figures
- Figure 1: Global Recombinant Trypsin Solution Revenue Breakdown (million, %) by Region 2024 & 2032
- Figure 2: Global Recombinant Trypsin Solution Volume Breakdown (K, %) by Region 2024 & 2032
- Figure 3: North America Recombinant Trypsin Solution Revenue (million), by Application 2024 & 2032
- Figure 4: North America Recombinant Trypsin Solution Volume (K), by Application 2024 & 2032
- Figure 5: North America Recombinant Trypsin Solution Revenue Share (%), by Application 2024 & 2032
- Figure 6: North America Recombinant Trypsin Solution Volume Share (%), by Application 2024 & 2032
- Figure 7: North America Recombinant Trypsin Solution Revenue (million), by Types 2024 & 2032
- Figure 8: North America Recombinant Trypsin Solution Volume (K), by Types 2024 & 2032
- Figure 9: North America Recombinant Trypsin Solution Revenue Share (%), by Types 2024 & 2032
- Figure 10: North America Recombinant Trypsin Solution Volume Share (%), by Types 2024 & 2032
- Figure 11: North America Recombinant Trypsin Solution Revenue (million), by Country 2024 & 2032
- Figure 12: North America Recombinant Trypsin Solution Volume (K), by Country 2024 & 2032
- Figure 13: North America Recombinant Trypsin Solution Revenue Share (%), by Country 2024 & 2032
- Figure 14: North America Recombinant Trypsin Solution Volume Share (%), by Country 2024 & 2032
- Figure 15: South America Recombinant Trypsin Solution Revenue (million), by Application 2024 & 2032
- Figure 16: South America Recombinant Trypsin Solution Volume (K), by Application 2024 & 2032
- Figure 17: South America Recombinant Trypsin Solution Revenue Share (%), by Application 2024 & 2032
- Figure 18: South America Recombinant Trypsin Solution Volume Share (%), by Application 2024 & 2032
- Figure 19: South America Recombinant Trypsin Solution Revenue (million), by Types 2024 & 2032
- Figure 20: South America Recombinant Trypsin Solution Volume (K), by Types 2024 & 2032
- Figure 21: South America Recombinant Trypsin Solution Revenue Share (%), by Types 2024 & 2032
- Figure 22: South America Recombinant Trypsin Solution Volume Share (%), by Types 2024 & 2032
- Figure 23: South America Recombinant Trypsin Solution Revenue (million), by Country 2024 & 2032
- Figure 24: South America Recombinant Trypsin Solution Volume (K), by Country 2024 & 2032
- Figure 25: South America Recombinant Trypsin Solution Revenue Share (%), by Country 2024 & 2032
- Figure 26: South America Recombinant Trypsin Solution Volume Share (%), by Country 2024 & 2032
- Figure 27: Europe Recombinant Trypsin Solution Revenue (million), by Application 2024 & 2032
- Figure 28: Europe Recombinant Trypsin Solution Volume (K), by Application 2024 & 2032
- Figure 29: Europe Recombinant Trypsin Solution Revenue Share (%), by Application 2024 & 2032
- Figure 30: Europe Recombinant Trypsin Solution Volume Share (%), by Application 2024 & 2032
- Figure 31: Europe Recombinant Trypsin Solution Revenue (million), by Types 2024 & 2032
- Figure 32: Europe Recombinant Trypsin Solution Volume (K), by Types 2024 & 2032
- Figure 33: Europe Recombinant Trypsin Solution Revenue Share (%), by Types 2024 & 2032
- Figure 34: Europe Recombinant Trypsin Solution Volume Share (%), by Types 2024 & 2032
- Figure 35: Europe Recombinant Trypsin Solution Revenue (million), by Country 2024 & 2032
- Figure 36: Europe Recombinant Trypsin Solution Volume (K), by Country 2024 & 2032
- Figure 37: Europe Recombinant Trypsin Solution Revenue Share (%), by Country 2024 & 2032
- Figure 38: Europe Recombinant Trypsin Solution Volume Share (%), by Country 2024 & 2032
- Figure 39: Middle East & Africa Recombinant Trypsin Solution Revenue (million), by Application 2024 & 2032
- Figure 40: Middle East & Africa Recombinant Trypsin Solution Volume (K), by Application 2024 & 2032
- Figure 41: Middle East & Africa Recombinant Trypsin Solution Revenue Share (%), by Application 2024 & 2032
- Figure 42: Middle East & Africa Recombinant Trypsin Solution Volume Share (%), by Application 2024 & 2032
- Figure 43: Middle East & Africa Recombinant Trypsin Solution Revenue (million), by Types 2024 & 2032
- Figure 44: Middle East & Africa Recombinant Trypsin Solution Volume (K), by Types 2024 & 2032
- Figure 45: Middle East & Africa Recombinant Trypsin Solution Revenue Share (%), by Types 2024 & 2032
- Figure 46: Middle East & Africa Recombinant Trypsin Solution Volume Share (%), by Types 2024 & 2032
- Figure 47: Middle East & Africa Recombinant Trypsin Solution Revenue (million), by Country 2024 & 2032
- Figure 48: Middle East & Africa Recombinant Trypsin Solution Volume (K), by Country 2024 & 2032
- Figure 49: Middle East & Africa Recombinant Trypsin Solution Revenue Share (%), by Country 2024 & 2032
- Figure 50: Middle East & Africa Recombinant Trypsin Solution Volume Share (%), by Country 2024 & 2032
- Figure 51: Asia Pacific Recombinant Trypsin Solution Revenue (million), by Application 2024 & 2032
- Figure 52: Asia Pacific Recombinant Trypsin Solution Volume (K), by Application 2024 & 2032
- Figure 53: Asia Pacific Recombinant Trypsin Solution Revenue Share (%), by Application 2024 & 2032
- Figure 54: Asia Pacific Recombinant Trypsin Solution Volume Share (%), by Application 2024 & 2032
- Figure 55: Asia Pacific Recombinant Trypsin Solution Revenue (million), by Types 2024 & 2032
- Figure 56: Asia Pacific Recombinant Trypsin Solution Volume (K), by Types 2024 & 2032
- Figure 57: Asia Pacific Recombinant Trypsin Solution Revenue Share (%), by Types 2024 & 2032
- Figure 58: Asia Pacific Recombinant Trypsin Solution Volume Share (%), by Types 2024 & 2032
- Figure 59: Asia Pacific Recombinant Trypsin Solution Revenue (million), by Country 2024 & 2032
- Figure 60: Asia Pacific Recombinant Trypsin Solution Volume (K), by Country 2024 & 2032
- Figure 61: Asia Pacific Recombinant Trypsin Solution Revenue Share (%), by Country 2024 & 2032
- Figure 62: Asia Pacific Recombinant Trypsin Solution Volume Share (%), by Country 2024 & 2032
List of Tables
- Table 1: Global Recombinant Trypsin Solution Revenue million Forecast, by Region 2019 & 2032
- Table 2: Global Recombinant Trypsin Solution Volume K Forecast, by Region 2019 & 2032
- Table 3: Global Recombinant Trypsin Solution Revenue million Forecast, by Application 2019 & 2032
- Table 4: Global Recombinant Trypsin Solution Volume K Forecast, by Application 2019 & 2032
- Table 5: Global Recombinant Trypsin Solution Revenue million Forecast, by Types 2019 & 2032
- Table 6: Global Recombinant Trypsin Solution Volume K Forecast, by Types 2019 & 2032
- Table 7: Global Recombinant Trypsin Solution Revenue million Forecast, by Region 2019 & 2032
- Table 8: Global Recombinant Trypsin Solution Volume K Forecast, by Region 2019 & 2032
- Table 9: Global Recombinant Trypsin Solution Revenue million Forecast, by Application 2019 & 2032
- Table 10: Global Recombinant Trypsin Solution Volume K Forecast, by Application 2019 & 2032
- Table 11: Global Recombinant Trypsin Solution Revenue million Forecast, by Types 2019 & 2032
- Table 12: Global Recombinant Trypsin Solution Volume K Forecast, by Types 2019 & 2032
- Table 13: Global Recombinant Trypsin Solution Revenue million Forecast, by Country 2019 & 2032
- Table 14: Global Recombinant Trypsin Solution Volume K Forecast, by Country 2019 & 2032
- Table 15: United States Recombinant Trypsin Solution Revenue (million) Forecast, by Application 2019 & 2032
- Table 16: United States Recombinant Trypsin Solution Volume (K) Forecast, by Application 2019 & 2032
- Table 17: Canada Recombinant Trypsin Solution Revenue (million) Forecast, by Application 2019 & 2032
- Table 18: Canada Recombinant Trypsin Solution Volume (K) Forecast, by Application 2019 & 2032
- Table 19: Mexico Recombinant Trypsin Solution Revenue (million) Forecast, by Application 2019 & 2032
- Table 20: Mexico Recombinant Trypsin Solution Volume (K) Forecast, by Application 2019 & 2032
- Table 21: Global Recombinant Trypsin Solution Revenue million Forecast, by Application 2019 & 2032
- Table 22: Global Recombinant Trypsin Solution Volume K Forecast, by Application 2019 & 2032
- Table 23: Global Recombinant Trypsin Solution Revenue million Forecast, by Types 2019 & 2032
- Table 24: Global Recombinant Trypsin Solution Volume K Forecast, by Types 2019 & 2032
- Table 25: Global Recombinant Trypsin Solution Revenue million Forecast, by Country 2019 & 2032
- Table 26: Global Recombinant Trypsin Solution Volume K Forecast, by Country 2019 & 2032
- Table 27: Brazil Recombinant Trypsin Solution Revenue (million) Forecast, by Application 2019 & 2032
- Table 28: Brazil Recombinant Trypsin Solution Volume (K) Forecast, by Application 2019 & 2032
- Table 29: Argentina Recombinant Trypsin Solution Revenue (million) Forecast, by Application 2019 & 2032
- Table 30: Argentina Recombinant Trypsin Solution Volume (K) Forecast, by Application 2019 & 2032
- Table 31: Rest of South America Recombinant Trypsin Solution Revenue (million) Forecast, by Application 2019 & 2032
- Table 32: Rest of South America Recombinant Trypsin Solution Volume (K) Forecast, by Application 2019 & 2032
- Table 33: Global Recombinant Trypsin Solution Revenue million Forecast, by Application 2019 & 2032
- Table 34: Global Recombinant Trypsin Solution Volume K Forecast, by Application 2019 & 2032
- Table 35: Global Recombinant Trypsin Solution Revenue million Forecast, by Types 2019 & 2032
- Table 36: Global Recombinant Trypsin Solution Volume K Forecast, by Types 2019 & 2032
- Table 37: Global Recombinant Trypsin Solution Revenue million Forecast, by Country 2019 & 2032
- Table 38: Global Recombinant Trypsin Solution Volume K Forecast, by Country 2019 & 2032
- Table 39: United Kingdom Recombinant Trypsin Solution Revenue (million) Forecast, by Application 2019 & 2032
- Table 40: United Kingdom Recombinant Trypsin Solution Volume (K) Forecast, by Application 2019 & 2032
- Table 41: Germany Recombinant Trypsin Solution Revenue (million) Forecast, by Application 2019 & 2032
- Table 42: Germany Recombinant Trypsin Solution Volume (K) Forecast, by Application 2019 & 2032
- Table 43: France Recombinant Trypsin Solution Revenue (million) Forecast, by Application 2019 & 2032
- Table 44: France Recombinant Trypsin Solution Volume (K) Forecast, by Application 2019 & 2032
- Table 45: Italy Recombinant Trypsin Solution Revenue (million) Forecast, by Application 2019 & 2032
- Table 46: Italy Recombinant Trypsin Solution Volume (K) Forecast, by Application 2019 & 2032
- Table 47: Spain Recombinant Trypsin Solution Revenue (million) Forecast, by Application 2019 & 2032
- Table 48: Spain Recombinant Trypsin Solution Volume (K) Forecast, by Application 2019 & 2032
- Table 49: Russia Recombinant Trypsin Solution Revenue (million) Forecast, by Application 2019 & 2032
- Table 50: Russia Recombinant Trypsin Solution Volume (K) Forecast, by Application 2019 & 2032
- Table 51: Benelux Recombinant Trypsin Solution Revenue (million) Forecast, by Application 2019 & 2032
- Table 52: Benelux Recombinant Trypsin Solution Volume (K) Forecast, by Application 2019 & 2032
- Table 53: Nordics Recombinant Trypsin Solution Revenue (million) Forecast, by Application 2019 & 2032
- Table 54: Nordics Recombinant Trypsin Solution Volume (K) Forecast, by Application 2019 & 2032
- Table 55: Rest of Europe Recombinant Trypsin Solution Revenue (million) Forecast, by Application 2019 & 2032
- Table 56: Rest of Europe Recombinant Trypsin Solution Volume (K) Forecast, by Application 2019 & 2032
- Table 57: Global Recombinant Trypsin Solution Revenue million Forecast, by Application 2019 & 2032
- Table 58: Global Recombinant Trypsin Solution Volume K Forecast, by Application 2019 & 2032
- Table 59: Global Recombinant Trypsin Solution Revenue million Forecast, by Types 2019 & 2032
- Table 60: Global Recombinant Trypsin Solution Volume K Forecast, by Types 2019 & 2032
- Table 61: Global Recombinant Trypsin Solution Revenue million Forecast, by Country 2019 & 2032
- Table 62: Global Recombinant Trypsin Solution Volume K Forecast, by Country 2019 & 2032
- Table 63: Turkey Recombinant Trypsin Solution Revenue (million) Forecast, by Application 2019 & 2032
- Table 64: Turkey Recombinant Trypsin Solution Volume (K) Forecast, by Application 2019 & 2032
- Table 65: Israel Recombinant Trypsin Solution Revenue (million) Forecast, by Application 2019 & 2032
- Table 66: Israel Recombinant Trypsin Solution Volume (K) Forecast, by Application 2019 & 2032
- Table 67: GCC Recombinant Trypsin Solution Revenue (million) Forecast, by Application 2019 & 2032
- Table 68: GCC Recombinant Trypsin Solution Volume (K) Forecast, by Application 2019 & 2032
- Table 69: North Africa Recombinant Trypsin Solution Revenue (million) Forecast, by Application 2019 & 2032
- Table 70: North Africa Recombinant Trypsin Solution Volume (K) Forecast, by Application 2019 & 2032
- Table 71: South Africa Recombinant Trypsin Solution Revenue (million) Forecast, by Application 2019 & 2032
- Table 72: South Africa Recombinant Trypsin Solution Volume (K) Forecast, by Application 2019 & 2032
- Table 73: Rest of Middle East & Africa Recombinant Trypsin Solution Revenue (million) Forecast, by Application 2019 & 2032
- Table 74: Rest of Middle East & Africa Recombinant Trypsin Solution Volume (K) Forecast, by Application 2019 & 2032
- Table 75: Global Recombinant Trypsin Solution Revenue million Forecast, by Application 2019 & 2032
- Table 76: Global Recombinant Trypsin Solution Volume K Forecast, by Application 2019 & 2032
- Table 77: Global Recombinant Trypsin Solution Revenue million Forecast, by Types 2019 & 2032
- Table 78: Global Recombinant Trypsin Solution Volume K Forecast, by Types 2019 & 2032
- Table 79: Global Recombinant Trypsin Solution Revenue million Forecast, by Country 2019 & 2032
- Table 80: Global Recombinant Trypsin Solution Volume K Forecast, by Country 2019 & 2032
- Table 81: China Recombinant Trypsin Solution Revenue (million) Forecast, by Application 2019 & 2032
- Table 82: China Recombinant Trypsin Solution Volume (K) Forecast, by Application 2019 & 2032
- Table 83: India Recombinant Trypsin Solution Revenue (million) Forecast, by Application 2019 & 2032
- Table 84: India Recombinant Trypsin Solution Volume (K) Forecast, by Application 2019 & 2032
- Table 85: Japan Recombinant Trypsin Solution Revenue (million) Forecast, by Application 2019 & 2032
- Table 86: Japan Recombinant Trypsin Solution Volume (K) Forecast, by Application 2019 & 2032
- Table 87: South Korea Recombinant Trypsin Solution Revenue (million) Forecast, by Application 2019 & 2032
- Table 88: South Korea Recombinant Trypsin Solution Volume (K) Forecast, by Application 2019 & 2032
- Table 89: ASEAN Recombinant Trypsin Solution Revenue (million) Forecast, by Application 2019 & 2032
- Table 90: ASEAN Recombinant Trypsin Solution Volume (K) Forecast, by Application 2019 & 2032
- Table 91: Oceania Recombinant Trypsin Solution Revenue (million) Forecast, by Application 2019 & 2032
- Table 92: Oceania Recombinant Trypsin Solution Volume (K) Forecast, by Application 2019 & 2032
- Table 93: Rest of Asia Pacific Recombinant Trypsin Solution Revenue (million) Forecast, by Application 2019 & 2032
- Table 94: Rest of Asia Pacific Recombinant Trypsin Solution Volume (K) Forecast, by Application 2019 & 2032
Frequently Asked Questions
1. What is the projected Compound Annual Growth Rate (CAGR) of the Recombinant Trypsin Solution?
The projected CAGR is approximately XX%.
2. Which companies are prominent players in the Recombinant Trypsin Solution?
Key companies in the market include Novozymes, BBI Group, Roche, Thermo Fisher, Merck, Applied Biotechnology Institute, Biological Industries, Yaxin Bio, Yocon Hengye Bio, BasalMedia, Biosera.
3. What are the main segments of the Recombinant Trypsin Solution?
The market segments include Application, Types.
4. Can you provide details about the market size?
The market size is estimated to be USD XXX million as of 2022.
5. What are some drivers contributing to market growth?
N/A
6. What are the notable trends driving market growth?
N/A
7. Are there any restraints impacting market growth?
N/A
8. Can you provide examples of recent developments in the market?
N/A
9. What pricing options are available for accessing the report?
Pricing options include single-user, multi-user, and enterprise licenses priced at USD 3350.00, USD 5025.00, and USD 6700.00 respectively.
10. Is the market size provided in terms of value or volume?
The market size is provided in terms of value, measured in million and volume, measured in K.
11. Are there any specific market keywords associated with the report?
Yes, the market keyword associated with the report is "Recombinant Trypsin Solution," which aids in identifying and referencing the specific market segment covered.
12. How do I determine which pricing option suits my needs best?
The pricing options vary based on user requirements and access needs. Individual users may opt for single-user licenses, while businesses requiring broader access may choose multi-user or enterprise licenses for cost-effective access to the report.
13. Are there any additional resources or data provided in the Recombinant Trypsin Solution report?
While the report offers comprehensive insights, it's advisable to review the specific contents or supplementary materials provided to ascertain if additional resources or data are available.
14. How can I stay updated on further developments or reports in the Recombinant Trypsin Solution?
To stay informed about further developments, trends, and reports in the Recombinant Trypsin Solution, consider subscribing to industry newsletters, following relevant companies and organizations, or regularly checking reputable industry news sources and publications.
Methodology
Step 1 - Identification of Relevant Samples Size from Population Database


Step 2 - Approaches for Defining Global Market Size (Value, Volume* & Price*)

Note*: In applicable scenarios
Step 3 - Data Sources
Primary Research
- Web Analytics
- Survey Reports
- Research Institute
- Latest Research Reports
- Opinion Leaders
Secondary Research
- Annual Reports
- White Paper
- Latest Press Release
- Industry Association
- Paid Database
- Investor Presentations

Step 4 - Data Triangulation
Involves using different sources of information in order to increase the validity of a study
These sources are likely to be stakeholders in a program - participants, other researchers, program staff, other community members, and so on.
Then we put all data in single framework & apply various statistical tools to find out the dynamic on the market.
During the analysis stage, feedback from the stakeholder groups would be compared to determine areas of agreement as well as areas of divergence
