

Key Insights
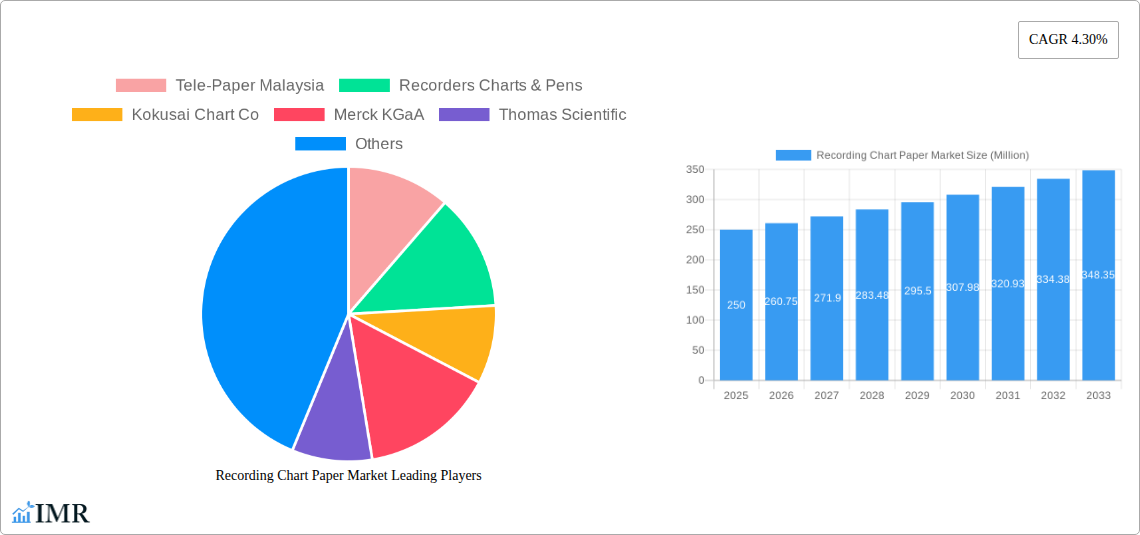
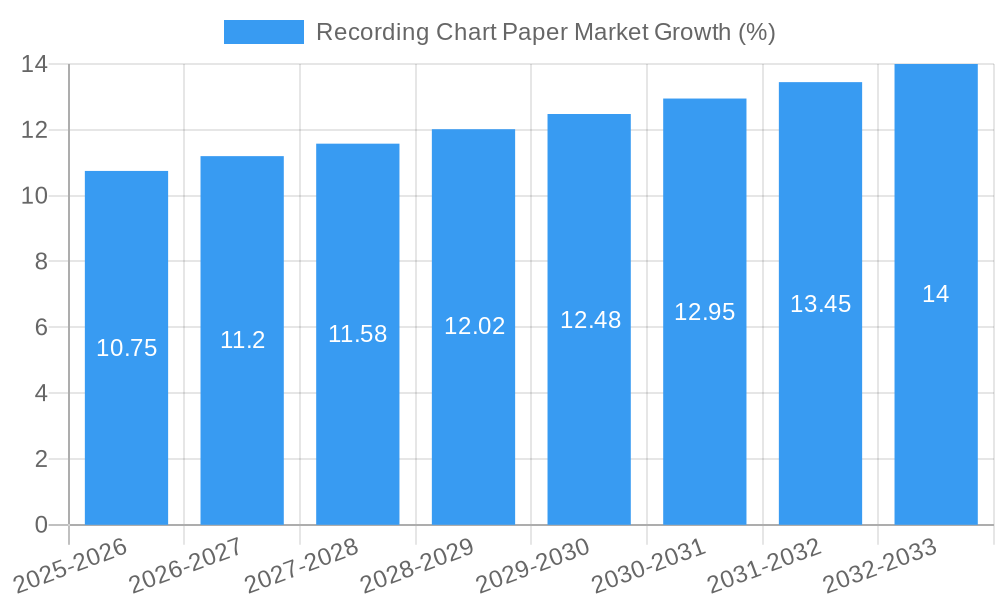
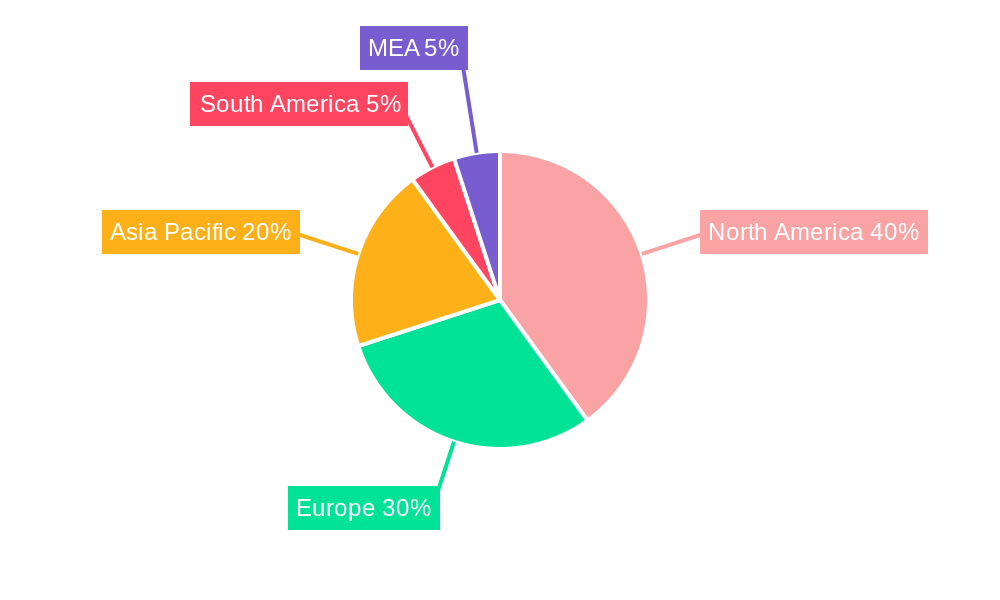
The global Recording Chart Paper market, valued at approximately $250 million in 2025, is projected to experience steady growth, driven by a Compound Annual Growth Rate (CAGR) of 4.30% from 2025 to 2033. This growth is fueled by several key factors. The increasing prevalence of chronic diseases necessitating extensive medical record-keeping contributes significantly to market demand. Furthermore, technological advancements in medical monitoring equipment, though increasingly digital, still maintain a reliance on paper charts for certain applications, especially in areas with limited access to advanced technology or where digital systems are not fully integrated. Hospitals, diagnostic centers, and clinics remain the primary end-users, with a substantial portion of demand coming from cardiology, fetal monitoring, and OBGYN applications. The market also benefits from the relatively low cost and ease of use of paper charts, particularly in comparison to the initial investment and maintenance required for fully digital solutions. However, the gradual shift toward electronic health records (EHRs) and the rising cost of paper and printing pose challenges to market expansion. The market is segmented geographically, with North America and Europe currently holding significant market shares due to high healthcare expenditure and technological advancement in those regions. However, emerging economies in Asia-Pacific are expected to show significant growth potential driven by increasing healthcare infrastructure development and rising disposable incomes. Competition within the market is moderate, with both established players and smaller regional manufacturers catering to diverse needs.
The competitive landscape is characterized by a mix of large multinational corporations supplying a wide range of medical supplies and smaller, specialized manufacturers focusing on specific chart paper types or regional markets. Strategies employed by market players include product diversification, focusing on quality improvements, exploring sustainable production methods, and expanding distribution networks to increase market penetration. Future market growth hinges on technological advancements impacting medical record-keeping, the evolving regulatory environment regarding data privacy and storage, and the fluctuating costs of raw materials. The industry must continually adapt to these dynamic forces to ensure sustainable growth and maintain its relevance in an increasingly digital healthcare landscape. The growing emphasis on patient data security and compliance with regulations like HIPAA (in the US) and GDPR (in Europe) is also impacting the industry, driving a need for integrated paper and digital solutions.
Recording Chart Paper Market: A Comprehensive Report (2019-2033)
This in-depth report provides a comprehensive analysis of the Recording Chart Paper Market, encompassing market dynamics, growth trends, regional segmentation, product landscape, key players, and future outlook. The report covers the period from 2019 to 2033, with a base year of 2025 and a forecast period of 2025-2033. The parent market is the Medical Supplies Market, and the child market is the Medical Charting Supplies Market. The market size is expected to reach xx Million units by 2033.
Recording Chart Paper Market Dynamics & Structure
The Recording Chart Paper market is moderately fragmented, with several key players competing based on product quality, pricing, and distribution networks. Technological innovation, driven by the need for improved accuracy, efficiency, and integration with electronic health records (EHR) systems, is a key driver. Stringent regulatory frameworks regarding medical device safety and data integrity significantly influence market dynamics. Competitive substitutes include digital recording systems, although paper-based charts remain prevalent, particularly in certain settings. End-user demographics, especially the aging population and the rising prevalence of chronic diseases, are pushing market growth. M&A activity in the sector has been moderate, with xx deals recorded between 2019 and 2024, resulting in a market concentration increase of approximately xx%.
- Market Concentration: Moderately fragmented (xx% CR4 in 2024)
- Technological Innovation: Focus on improved accuracy, integration with EHR systems
- Regulatory Framework: Stringent safety and data integrity standards
- Competitive Substitutes: Digital recording systems
- End-User Demographics: Aging population, rising chronic disease prevalence
- M&A Activity: xx deals between 2019-2024, leading to xx% increase in market concentration
Recording Chart Paper Market Growth Trends & Insights
The Recording Chart Paper market experienced a CAGR of xx% during the historical period (2019-2024). This growth is attributed to increasing healthcare expenditure, rising adoption of paper-based recording systems in emerging economies, and persistent demand for reliable and cost-effective recording solutions in certain clinical settings. However, the market is facing challenges from the transition toward digital healthcare systems. The adoption rate of paper-based charts is expected to decline gradually, but significant demand is predicted to persist particularly in developing nations and specific clinical areas, such as smaller clinics, and for certain medical procedures. We anticipate a CAGR of xx% from 2025 to 2033, driven by persistent demand in niche segments, despite the increasing shift toward digital technology. Market penetration is currently at approximately xx% globally.
Dominant Regions, Countries, or Segments in Recording Chart Paper Market
North America currently holds the largest market share, driven by high healthcare expenditure and the prevalence of advanced medical facilities. However, the Asia-Pacific region is expected to witness significant growth in the forecast period due to increasing healthcare infrastructure development and rising disposable incomes. Within product types, Cardiology Monitoring Recording Chart Papers command the largest segment share, followed by Fetal Monitoring and OBGYN Recording Chart Papers. Hospitals remain the primary end-user segment.
- Key Drivers (North America): High healthcare expenditure, advanced medical infrastructure
- Key Drivers (Asia-Pacific): Rising healthcare infrastructure development, increasing disposable incomes
- Dominant Product Type: Cardiology Monitoring Recording Chart Papers (xx% market share in 2024)
- Dominant End-User: Hospitals (xx% market share in 2024)
Recording Chart Paper Market Product Landscape
The market offers a range of chart papers catering to diverse medical specialties, with variations in size, paper quality, and printing capabilities. Recent innovations include improved ink formulations for enhanced readability and durability, along with specialized coatings for better resistance to smudging and moisture. Unique selling propositions often center on ease of use, compatibility with existing recording systems, and cost-effectiveness.
Key Drivers, Barriers & Challenges in Recording Chart Paper Market
Key Drivers:
- Increasing demand from developing economies.
- Continued preference for physical charts in specific applications.
- Cost-effectiveness compared to digital alternatives in certain settings.
Challenges:
- Transition to digital healthcare systems.
- Supply chain disruptions impacting raw material availability and cost.
- Regulatory pressures regarding environmental sustainability and waste management. The estimated impact of supply chain issues led to a xx% decrease in production in 2022.
Emerging Opportunities in Recording Chart Paper Market
- Expanding into untapped markets in developing regions.
- Development of specialized chart papers for niche medical applications.
- Leveraging sustainable materials and eco-friendly manufacturing processes.
Growth Accelerators in the Recording Chart Paper Market Industry
Technological advancements in paper production leading to improved quality and durability are significant growth catalysts. Strategic partnerships between chart paper manufacturers and healthcare providers to streamline distribution and meet specific needs offer further expansion opportunities. Expansion into developing economies with a focus on providing cost-effective solutions to a growing population will fuel market growth.
Key Players Shaping the Recording Chart Paper Market Market
- Tele-Paper Malaysia
- Recorders Charts & Pens
- Kokusai Chart Co
- Merck KGaA
- Thomas Scientific
- Precision Charts Inc
- Pirrone srl
- Cardinal Health
- GlobalSpec
- DART TECHNOLOGIES
Notable Milestones in Recording Chart Paper Market Sector
- 2020: Introduction of a new eco-friendly chart paper by Kokusai Chart Co.
- 2022: Merck KGaA acquires a smaller chart paper manufacturer, expanding its market reach.
- 2023: Tele-Paper Malaysia launches a new line of specialized chart papers for cardiology applications.
In-Depth Recording Chart Paper Market Market Outlook
The Recording Chart Paper market is poised for continued growth, albeit at a moderate pace, driven by persistent demand in niche segments and regional expansion. Strategic partnerships focusing on customized solutions and incorporating sustainable practices are crucial for success in a market increasingly impacted by the shift toward digital health records. Opportunities exist in developing specialized products for emerging medical applications and penetrating underserved markets in developing regions.
Recording Chart Paper Market Segmentation
-
1. Product Type
- 1.1. Cardiology Monitoring Recording Chart Papers
- 1.2. Fetal Monitoring Recording Chart Papers
- 1.3. OBGYN Recording Chart Paper
- 1.4. Other Product Types
-
2. End User
- 2.1. Hospitals
- 2.2. Diagnostic Centers
- 2.3. Clinics
Recording Chart Paper Market Segmentation By Geography
-
1. North America
- 1.1. United States
- 1.2. Canada
- 1.3. Mexico
-
2. Europe
- 2.1. Germany
- 2.2. United Kingdom
- 2.3. France
- 2.4. Italy
- 2.5. Spain
- 2.6. Rest of Europe
-
3. Asia Pacific
- 3.1. China
- 3.2. Japan
- 3.3. India
- 3.4. Australia
- 3.5. South Korea
- 3.6. Rest of Asia Pacific
- 4. Middle East
-
5. GCC
- 5.1. South Africa
- 5.2. Rest of Middle East
-
6. South America
- 6.1. Brazil
- 6.2. Argentina
- 6.3. Rest of South America
Recording Chart Paper Market REPORT HIGHLIGHTS
| Aspects | Details |
|---|---|
| Study Period | 2019-2033 |
| Base Year | 2024 |
| Estimated Year | 2025 |
| Forecast Period | 2025-2033 |
| Historical Period | 2019-2024 |
| Growth Rate | CAGR of 4.30% from 2019-2033 |
| Segmentation |
|
Table of Contents
- 1. Introduction
- 1.1. Research Scope
- 1.2. Market Segmentation
- 1.3. Research Methodology
- 1.4. Definitions and Assumptions
- 2. Executive Summary
- 2.1. Introduction
- 3. Market Dynamics
- 3.1. Introduction
- 3.2. Market Drivers
- 3.2.1. ; Increasing Prevalence of Cardiovascular Diseases; Increasing Geriatric Population and Births
- 3.3. Market Restrains
- 3.3.1. ; Growing Usage of Alternative Digital Instruments
- 3.4. Market Trends
- 3.4.1. Fetal Monitoring Recording Chart Papers Segment is Expected to be the Fastest Growing Segment.
- 4. Market Factor Analysis
- 4.1. Porters Five Forces
- 4.2. Supply/Value Chain
- 4.3. PESTEL analysis
- 4.4. Market Entropy
- 4.5. Patent/Trademark Analysis
- 5. Global Recording Chart Paper Market Analysis, Insights and Forecast, 2019-2031
- 5.1. Market Analysis, Insights and Forecast - by Product Type
- 5.1.1. Cardiology Monitoring Recording Chart Papers
- 5.1.2. Fetal Monitoring Recording Chart Papers
- 5.1.3. OBGYN Recording Chart Paper
- 5.1.4. Other Product Types
- 5.2. Market Analysis, Insights and Forecast - by End User
- 5.2.1. Hospitals
- 5.2.2. Diagnostic Centers
- 5.2.3. Clinics
- 5.3. Market Analysis, Insights and Forecast - by Region
- 5.3.1. North America
- 5.3.2. Europe
- 5.3.3. Asia Pacific
- 5.3.4. Middle East
- 5.3.5. GCC
- 5.3.6. South America
- 5.1. Market Analysis, Insights and Forecast - by Product Type
- 6. North America Recording Chart Paper Market Analysis, Insights and Forecast, 2019-2031
- 6.1. Market Analysis, Insights and Forecast - by Product Type
- 6.1.1. Cardiology Monitoring Recording Chart Papers
- 6.1.2. Fetal Monitoring Recording Chart Papers
- 6.1.3. OBGYN Recording Chart Paper
- 6.1.4. Other Product Types
- 6.2. Market Analysis, Insights and Forecast - by End User
- 6.2.1. Hospitals
- 6.2.2. Diagnostic Centers
- 6.2.3. Clinics
- 6.1. Market Analysis, Insights and Forecast - by Product Type
- 7. Europe Recording Chart Paper Market Analysis, Insights and Forecast, 2019-2031
- 7.1. Market Analysis, Insights and Forecast - by Product Type
- 7.1.1. Cardiology Monitoring Recording Chart Papers
- 7.1.2. Fetal Monitoring Recording Chart Papers
- 7.1.3. OBGYN Recording Chart Paper
- 7.1.4. Other Product Types
- 7.2. Market Analysis, Insights and Forecast - by End User
- 7.2.1. Hospitals
- 7.2.2. Diagnostic Centers
- 7.2.3. Clinics
- 7.1. Market Analysis, Insights and Forecast - by Product Type
- 8. Asia Pacific Recording Chart Paper Market Analysis, Insights and Forecast, 2019-2031
- 8.1. Market Analysis, Insights and Forecast - by Product Type
- 8.1.1. Cardiology Monitoring Recording Chart Papers
- 8.1.2. Fetal Monitoring Recording Chart Papers
- 8.1.3. OBGYN Recording Chart Paper
- 8.1.4. Other Product Types
- 8.2. Market Analysis, Insights and Forecast - by End User
- 8.2.1. Hospitals
- 8.2.2. Diagnostic Centers
- 8.2.3. Clinics
- 8.1. Market Analysis, Insights and Forecast - by Product Type
- 9. Middle East Recording Chart Paper Market Analysis, Insights and Forecast, 2019-2031
- 9.1. Market Analysis, Insights and Forecast - by Product Type
- 9.1.1. Cardiology Monitoring Recording Chart Papers
- 9.1.2. Fetal Monitoring Recording Chart Papers
- 9.1.3. OBGYN Recording Chart Paper
- 9.1.4. Other Product Types
- 9.2. Market Analysis, Insights and Forecast - by End User
- 9.2.1. Hospitals
- 9.2.2. Diagnostic Centers
- 9.2.3. Clinics
- 9.1. Market Analysis, Insights and Forecast - by Product Type
- 10. GCC Recording Chart Paper Market Analysis, Insights and Forecast, 2019-2031
- 10.1. Market Analysis, Insights and Forecast - by Product Type
- 10.1.1. Cardiology Monitoring Recording Chart Papers
- 10.1.2. Fetal Monitoring Recording Chart Papers
- 10.1.3. OBGYN Recording Chart Paper
- 10.1.4. Other Product Types
- 10.2. Market Analysis, Insights and Forecast - by End User
- 10.2.1. Hospitals
- 10.2.2. Diagnostic Centers
- 10.2.3. Clinics
- 10.1. Market Analysis, Insights and Forecast - by Product Type
- 11. South America Recording Chart Paper Market Analysis, Insights and Forecast, 2019-2031
- 11.1. Market Analysis, Insights and Forecast - by Product Type
- 11.1.1. Cardiology Monitoring Recording Chart Papers
- 11.1.2. Fetal Monitoring Recording Chart Papers
- 11.1.3. OBGYN Recording Chart Paper
- 11.1.4. Other Product Types
- 11.2. Market Analysis, Insights and Forecast - by End User
- 11.2.1. Hospitals
- 11.2.2. Diagnostic Centers
- 11.2.3. Clinics
- 11.1. Market Analysis, Insights and Forecast - by Product Type
- 12. North America Recording Chart Paper Market Analysis, Insights and Forecast, 2019-2031
- 12.1. Market Analysis, Insights and Forecast - By Country/Sub-region
- 12.1.1 United States
- 12.1.2 Canada
- 12.1.3 Mexico
- 13. Europe Recording Chart Paper Market Analysis, Insights and Forecast, 2019-2031
- 13.1. Market Analysis, Insights and Forecast - By Country/Sub-region
- 13.1.1 Germany
- 13.1.2 United Kingdom
- 13.1.3 France
- 13.1.4 Italy
- 13.1.5 Spain
- 13.1.6 Rest of Europe
- 14. Asia Pacific Recording Chart Paper Market Analysis, Insights and Forecast, 2019-2031
- 14.1. Market Analysis, Insights and Forecast - By Country/Sub-region
- 14.1.1 China
- 14.1.2 Japan
- 14.1.3 India
- 14.1.4 Australia
- 14.1.5 South Korea
- 14.1.6 Rest of Asia Pacific
- 15. South America Recording Chart Paper Market Analysis, Insights and Forecast, 2019-2031
- 15.1. Market Analysis, Insights and Forecast - By Country/Sub-region
- 15.1.1 Brazil
- 15.1.2 Argentina
- 15.1.3 Rest of South America
- 16. MEA Recording Chart Paper Market Analysis, Insights and Forecast, 2019-2031
- 16.1. Market Analysis, Insights and Forecast - By Country/Sub-region
- 16.1.1 United Arab Emirates
- 16.1.2 Saudi Arabia
- 16.1.3 South Africa
- 16.1.4 Rest of Middle East and Africa
- 17. Competitive Analysis
- 17.1. Global Market Share Analysis 2024
- 17.2. Company Profiles
- 17.2.1 Tele-Paper Malaysia
- 17.2.1.1. Overview
- 17.2.1.2. Products
- 17.2.1.3. SWOT Analysis
- 17.2.1.4. Recent Developments
- 17.2.1.5. Financials (Based on Availability)
- 17.2.2 Recorders Charts & Pens
- 17.2.2.1. Overview
- 17.2.2.2. Products
- 17.2.2.3. SWOT Analysis
- 17.2.2.4. Recent Developments
- 17.2.2.5. Financials (Based on Availability)
- 17.2.3 Kokusai Chart Co
- 17.2.3.1. Overview
- 17.2.3.2. Products
- 17.2.3.3. SWOT Analysis
- 17.2.3.4. Recent Developments
- 17.2.3.5. Financials (Based on Availability)
- 17.2.4 Merck KGaA
- 17.2.4.1. Overview
- 17.2.4.2. Products
- 17.2.4.3. SWOT Analysis
- 17.2.4.4. Recent Developments
- 17.2.4.5. Financials (Based on Availability)
- 17.2.5 Thomas Scientific
- 17.2.5.1. Overview
- 17.2.5.2. Products
- 17.2.5.3. SWOT Analysis
- 17.2.5.4. Recent Developments
- 17.2.5.5. Financials (Based on Availability)
- 17.2.6 Precision Charts Inc
- 17.2.6.1. Overview
- 17.2.6.2. Products
- 17.2.6.3. SWOT Analysis
- 17.2.6.4. Recent Developments
- 17.2.6.5. Financials (Based on Availability)
- 17.2.7 Pirrone srl
- 17.2.7.1. Overview
- 17.2.7.2. Products
- 17.2.7.3. SWOT Analysis
- 17.2.7.4. Recent Developments
- 17.2.7.5. Financials (Based on Availability)
- 17.2.8 Cardinal Health
- 17.2.8.1. Overview
- 17.2.8.2. Products
- 17.2.8.3. SWOT Analysis
- 17.2.8.4. Recent Developments
- 17.2.8.5. Financials (Based on Availability)
- 17.2.9 GlobalSpec
- 17.2.9.1. Overview
- 17.2.9.2. Products
- 17.2.9.3. SWOT Analysis
- 17.2.9.4. Recent Developments
- 17.2.9.5. Financials (Based on Availability)
- 17.2.10 DART TECHNOLOGIES
- 17.2.10.1. Overview
- 17.2.10.2. Products
- 17.2.10.3. SWOT Analysis
- 17.2.10.4. Recent Developments
- 17.2.10.5. Financials (Based on Availability)
- 17.2.1 Tele-Paper Malaysia
List of Figures
- Figure 1: Global Recording Chart Paper Market Revenue Breakdown (Million, %) by Region 2024 & 2032
- Figure 2: Global Recording Chart Paper Market Volume Breakdown (Units, %) by Region 2024 & 2032
- Figure 3: North America Recording Chart Paper Market Revenue (Million), by Country 2024 & 2032
- Figure 4: North America Recording Chart Paper Market Volume (Units), by Country 2024 & 2032
- Figure 5: North America Recording Chart Paper Market Revenue Share (%), by Country 2024 & 2032
- Figure 6: North America Recording Chart Paper Market Volume Share (%), by Country 2024 & 2032
- Figure 7: Europe Recording Chart Paper Market Revenue (Million), by Country 2024 & 2032
- Figure 8: Europe Recording Chart Paper Market Volume (Units), by Country 2024 & 2032
- Figure 9: Europe Recording Chart Paper Market Revenue Share (%), by Country 2024 & 2032
- Figure 10: Europe Recording Chart Paper Market Volume Share (%), by Country 2024 & 2032
- Figure 11: Asia Pacific Recording Chart Paper Market Revenue (Million), by Country 2024 & 2032
- Figure 12: Asia Pacific Recording Chart Paper Market Volume (Units), by Country 2024 & 2032
- Figure 13: Asia Pacific Recording Chart Paper Market Revenue Share (%), by Country 2024 & 2032
- Figure 14: Asia Pacific Recording Chart Paper Market Volume Share (%), by Country 2024 & 2032
- Figure 15: South America Recording Chart Paper Market Revenue (Million), by Country 2024 & 2032
- Figure 16: South America Recording Chart Paper Market Volume (Units), by Country 2024 & 2032
- Figure 17: South America Recording Chart Paper Market Revenue Share (%), by Country 2024 & 2032
- Figure 18: South America Recording Chart Paper Market Volume Share (%), by Country 2024 & 2032
- Figure 19: MEA Recording Chart Paper Market Revenue (Million), by Country 2024 & 2032
- Figure 20: MEA Recording Chart Paper Market Volume (Units), by Country 2024 & 2032
- Figure 21: MEA Recording Chart Paper Market Revenue Share (%), by Country 2024 & 2032
- Figure 22: MEA Recording Chart Paper Market Volume Share (%), by Country 2024 & 2032
- Figure 23: North America Recording Chart Paper Market Revenue (Million), by Product Type 2024 & 2032
- Figure 24: North America Recording Chart Paper Market Volume (Units), by Product Type 2024 & 2032
- Figure 25: North America Recording Chart Paper Market Revenue Share (%), by Product Type 2024 & 2032
- Figure 26: North America Recording Chart Paper Market Volume Share (%), by Product Type 2024 & 2032
- Figure 27: North America Recording Chart Paper Market Revenue (Million), by End User 2024 & 2032
- Figure 28: North America Recording Chart Paper Market Volume (Units), by End User 2024 & 2032
- Figure 29: North America Recording Chart Paper Market Revenue Share (%), by End User 2024 & 2032
- Figure 30: North America Recording Chart Paper Market Volume Share (%), by End User 2024 & 2032
- Figure 31: North America Recording Chart Paper Market Revenue (Million), by Country 2024 & 2032
- Figure 32: North America Recording Chart Paper Market Volume (Units), by Country 2024 & 2032
- Figure 33: North America Recording Chart Paper Market Revenue Share (%), by Country 2024 & 2032
- Figure 34: North America Recording Chart Paper Market Volume Share (%), by Country 2024 & 2032
- Figure 35: Europe Recording Chart Paper Market Revenue (Million), by Product Type 2024 & 2032
- Figure 36: Europe Recording Chart Paper Market Volume (Units), by Product Type 2024 & 2032
- Figure 37: Europe Recording Chart Paper Market Revenue Share (%), by Product Type 2024 & 2032
- Figure 38: Europe Recording Chart Paper Market Volume Share (%), by Product Type 2024 & 2032
- Figure 39: Europe Recording Chart Paper Market Revenue (Million), by End User 2024 & 2032
- Figure 40: Europe Recording Chart Paper Market Volume (Units), by End User 2024 & 2032
- Figure 41: Europe Recording Chart Paper Market Revenue Share (%), by End User 2024 & 2032
- Figure 42: Europe Recording Chart Paper Market Volume Share (%), by End User 2024 & 2032
- Figure 43: Europe Recording Chart Paper Market Revenue (Million), by Country 2024 & 2032
- Figure 44: Europe Recording Chart Paper Market Volume (Units), by Country 2024 & 2032
- Figure 45: Europe Recording Chart Paper Market Revenue Share (%), by Country 2024 & 2032
- Figure 46: Europe Recording Chart Paper Market Volume Share (%), by Country 2024 & 2032
- Figure 47: Asia Pacific Recording Chart Paper Market Revenue (Million), by Product Type 2024 & 2032
- Figure 48: Asia Pacific Recording Chart Paper Market Volume (Units), by Product Type 2024 & 2032
- Figure 49: Asia Pacific Recording Chart Paper Market Revenue Share (%), by Product Type 2024 & 2032
- Figure 50: Asia Pacific Recording Chart Paper Market Volume Share (%), by Product Type 2024 & 2032
- Figure 51: Asia Pacific Recording Chart Paper Market Revenue (Million), by End User 2024 & 2032
- Figure 52: Asia Pacific Recording Chart Paper Market Volume (Units), by End User 2024 & 2032
- Figure 53: Asia Pacific Recording Chart Paper Market Revenue Share (%), by End User 2024 & 2032
- Figure 54: Asia Pacific Recording Chart Paper Market Volume Share (%), by End User 2024 & 2032
- Figure 55: Asia Pacific Recording Chart Paper Market Revenue (Million), by Country 2024 & 2032
- Figure 56: Asia Pacific Recording Chart Paper Market Volume (Units), by Country 2024 & 2032
- Figure 57: Asia Pacific Recording Chart Paper Market Revenue Share (%), by Country 2024 & 2032
- Figure 58: Asia Pacific Recording Chart Paper Market Volume Share (%), by Country 2024 & 2032
- Figure 59: Middle East Recording Chart Paper Market Revenue (Million), by Product Type 2024 & 2032
- Figure 60: Middle East Recording Chart Paper Market Volume (Units), by Product Type 2024 & 2032
- Figure 61: Middle East Recording Chart Paper Market Revenue Share (%), by Product Type 2024 & 2032
- Figure 62: Middle East Recording Chart Paper Market Volume Share (%), by Product Type 2024 & 2032
- Figure 63: Middle East Recording Chart Paper Market Revenue (Million), by End User 2024 & 2032
- Figure 64: Middle East Recording Chart Paper Market Volume (Units), by End User 2024 & 2032
- Figure 65: Middle East Recording Chart Paper Market Revenue Share (%), by End User 2024 & 2032
- Figure 66: Middle East Recording Chart Paper Market Volume Share (%), by End User 2024 & 2032
- Figure 67: Middle East Recording Chart Paper Market Revenue (Million), by Country 2024 & 2032
- Figure 68: Middle East Recording Chart Paper Market Volume (Units), by Country 2024 & 2032
- Figure 69: Middle East Recording Chart Paper Market Revenue Share (%), by Country 2024 & 2032
- Figure 70: Middle East Recording Chart Paper Market Volume Share (%), by Country 2024 & 2032
- Figure 71: GCC Recording Chart Paper Market Revenue (Million), by Product Type 2024 & 2032
- Figure 72: GCC Recording Chart Paper Market Volume (Units), by Product Type 2024 & 2032
- Figure 73: GCC Recording Chart Paper Market Revenue Share (%), by Product Type 2024 & 2032
- Figure 74: GCC Recording Chart Paper Market Volume Share (%), by Product Type 2024 & 2032
- Figure 75: GCC Recording Chart Paper Market Revenue (Million), by End User 2024 & 2032
- Figure 76: GCC Recording Chart Paper Market Volume (Units), by End User 2024 & 2032
- Figure 77: GCC Recording Chart Paper Market Revenue Share (%), by End User 2024 & 2032
- Figure 78: GCC Recording Chart Paper Market Volume Share (%), by End User 2024 & 2032
- Figure 79: GCC Recording Chart Paper Market Revenue (Million), by Country 2024 & 2032
- Figure 80: GCC Recording Chart Paper Market Volume (Units), by Country 2024 & 2032
- Figure 81: GCC Recording Chart Paper Market Revenue Share (%), by Country 2024 & 2032
- Figure 82: GCC Recording Chart Paper Market Volume Share (%), by Country 2024 & 2032
- Figure 83: South America Recording Chart Paper Market Revenue (Million), by Product Type 2024 & 2032
- Figure 84: South America Recording Chart Paper Market Volume (Units), by Product Type 2024 & 2032
- Figure 85: South America Recording Chart Paper Market Revenue Share (%), by Product Type 2024 & 2032
- Figure 86: South America Recording Chart Paper Market Volume Share (%), by Product Type 2024 & 2032
- Figure 87: South America Recording Chart Paper Market Revenue (Million), by End User 2024 & 2032
- Figure 88: South America Recording Chart Paper Market Volume (Units), by End User 2024 & 2032
- Figure 89: South America Recording Chart Paper Market Revenue Share (%), by End User 2024 & 2032
- Figure 90: South America Recording Chart Paper Market Volume Share (%), by End User 2024 & 2032
- Figure 91: South America Recording Chart Paper Market Revenue (Million), by Country 2024 & 2032
- Figure 92: South America Recording Chart Paper Market Volume (Units), by Country 2024 & 2032
- Figure 93: South America Recording Chart Paper Market Revenue Share (%), by Country 2024 & 2032
- Figure 94: South America Recording Chart Paper Market Volume Share (%), by Country 2024 & 2032
List of Tables
- Table 1: Global Recording Chart Paper Market Revenue Million Forecast, by Region 2019 & 2032
- Table 2: Global Recording Chart Paper Market Volume Units Forecast, by Region 2019 & 2032
- Table 3: Global Recording Chart Paper Market Revenue Million Forecast, by Product Type 2019 & 2032
- Table 4: Global Recording Chart Paper Market Volume Units Forecast, by Product Type 2019 & 2032
- Table 5: Global Recording Chart Paper Market Revenue Million Forecast, by End User 2019 & 2032
- Table 6: Global Recording Chart Paper Market Volume Units Forecast, by End User 2019 & 2032
- Table 7: Global Recording Chart Paper Market Revenue Million Forecast, by Region 2019 & 2032
- Table 8: Global Recording Chart Paper Market Volume Units Forecast, by Region 2019 & 2032
- Table 9: Global Recording Chart Paper Market Revenue Million Forecast, by Country 2019 & 2032
- Table 10: Global Recording Chart Paper Market Volume Units Forecast, by Country 2019 & 2032
- Table 11: United States Recording Chart Paper Market Revenue (Million) Forecast, by Application 2019 & 2032
- Table 12: United States Recording Chart Paper Market Volume (Units) Forecast, by Application 2019 & 2032
- Table 13: Canada Recording Chart Paper Market Revenue (Million) Forecast, by Application 2019 & 2032
- Table 14: Canada Recording Chart Paper Market Volume (Units) Forecast, by Application 2019 & 2032
- Table 15: Mexico Recording Chart Paper Market Revenue (Million) Forecast, by Application 2019 & 2032
- Table 16: Mexico Recording Chart Paper Market Volume (Units) Forecast, by Application 2019 & 2032
- Table 17: Global Recording Chart Paper Market Revenue Million Forecast, by Country 2019 & 2032
- Table 18: Global Recording Chart Paper Market Volume Units Forecast, by Country 2019 & 2032
- Table 19: Germany Recording Chart Paper Market Revenue (Million) Forecast, by Application 2019 & 2032
- Table 20: Germany Recording Chart Paper Market Volume (Units) Forecast, by Application 2019 & 2032
- Table 21: United Kingdom Recording Chart Paper Market Revenue (Million) Forecast, by Application 2019 & 2032
- Table 22: United Kingdom Recording Chart Paper Market Volume (Units) Forecast, by Application 2019 & 2032
- Table 23: France Recording Chart Paper Market Revenue (Million) Forecast, by Application 2019 & 2032
- Table 24: France Recording Chart Paper Market Volume (Units) Forecast, by Application 2019 & 2032
- Table 25: Italy Recording Chart Paper Market Revenue (Million) Forecast, by Application 2019 & 2032
- Table 26: Italy Recording Chart Paper Market Volume (Units) Forecast, by Application 2019 & 2032
- Table 27: Spain Recording Chart Paper Market Revenue (Million) Forecast, by Application 2019 & 2032
- Table 28: Spain Recording Chart Paper Market Volume (Units) Forecast, by Application 2019 & 2032
- Table 29: Rest of Europe Recording Chart Paper Market Revenue (Million) Forecast, by Application 2019 & 2032
- Table 30: Rest of Europe Recording Chart Paper Market Volume (Units) Forecast, by Application 2019 & 2032
- Table 31: Global Recording Chart Paper Market Revenue Million Forecast, by Country 2019 & 2032
- Table 32: Global Recording Chart Paper Market Volume Units Forecast, by Country 2019 & 2032
- Table 33: China Recording Chart Paper Market Revenue (Million) Forecast, by Application 2019 & 2032
- Table 34: China Recording Chart Paper Market Volume (Units) Forecast, by Application 2019 & 2032
- Table 35: Japan Recording Chart Paper Market Revenue (Million) Forecast, by Application 2019 & 2032
- Table 36: Japan Recording Chart Paper Market Volume (Units) Forecast, by Application 2019 & 2032
- Table 37: India Recording Chart Paper Market Revenue (Million) Forecast, by Application 2019 & 2032
- Table 38: India Recording Chart Paper Market Volume (Units) Forecast, by Application 2019 & 2032
- Table 39: Australia Recording Chart Paper Market Revenue (Million) Forecast, by Application 2019 & 2032
- Table 40: Australia Recording Chart Paper Market Volume (Units) Forecast, by Application 2019 & 2032
- Table 41: South Korea Recording Chart Paper Market Revenue (Million) Forecast, by Application 2019 & 2032
- Table 42: South Korea Recording Chart Paper Market Volume (Units) Forecast, by Application 2019 & 2032
- Table 43: Rest of Asia Pacific Recording Chart Paper Market Revenue (Million) Forecast, by Application 2019 & 2032
- Table 44: Rest of Asia Pacific Recording Chart Paper Market Volume (Units) Forecast, by Application 2019 & 2032
- Table 45: Global Recording Chart Paper Market Revenue Million Forecast, by Country 2019 & 2032
- Table 46: Global Recording Chart Paper Market Volume Units Forecast, by Country 2019 & 2032
- Table 47: Brazil Recording Chart Paper Market Revenue (Million) Forecast, by Application 2019 & 2032
- Table 48: Brazil Recording Chart Paper Market Volume (Units) Forecast, by Application 2019 & 2032
- Table 49: Argentina Recording Chart Paper Market Revenue (Million) Forecast, by Application 2019 & 2032
- Table 50: Argentina Recording Chart Paper Market Volume (Units) Forecast, by Application 2019 & 2032
- Table 51: Rest of South America Recording Chart Paper Market Revenue (Million) Forecast, by Application 2019 & 2032
- Table 52: Rest of South America Recording Chart Paper Market Volume (Units) Forecast, by Application 2019 & 2032
- Table 53: Global Recording Chart Paper Market Revenue Million Forecast, by Country 2019 & 2032
- Table 54: Global Recording Chart Paper Market Volume Units Forecast, by Country 2019 & 2032
- Table 55: United Arab Emirates Recording Chart Paper Market Revenue (Million) Forecast, by Application 2019 & 2032
- Table 56: United Arab Emirates Recording Chart Paper Market Volume (Units) Forecast, by Application 2019 & 2032
- Table 57: Saudi Arabia Recording Chart Paper Market Revenue (Million) Forecast, by Application 2019 & 2032
- Table 58: Saudi Arabia Recording Chart Paper Market Volume (Units) Forecast, by Application 2019 & 2032
- Table 59: South Africa Recording Chart Paper Market Revenue (Million) Forecast, by Application 2019 & 2032
- Table 60: South Africa Recording Chart Paper Market Volume (Units) Forecast, by Application 2019 & 2032
- Table 61: Rest of Middle East and Africa Recording Chart Paper Market Revenue (Million) Forecast, by Application 2019 & 2032
- Table 62: Rest of Middle East and Africa Recording Chart Paper Market Volume (Units) Forecast, by Application 2019 & 2032
- Table 63: Global Recording Chart Paper Market Revenue Million Forecast, by Product Type 2019 & 2032
- Table 64: Global Recording Chart Paper Market Volume Units Forecast, by Product Type 2019 & 2032
- Table 65: Global Recording Chart Paper Market Revenue Million Forecast, by End User 2019 & 2032
- Table 66: Global Recording Chart Paper Market Volume Units Forecast, by End User 2019 & 2032
- Table 67: Global Recording Chart Paper Market Revenue Million Forecast, by Country 2019 & 2032
- Table 68: Global Recording Chart Paper Market Volume Units Forecast, by Country 2019 & 2032
- Table 69: United States Recording Chart Paper Market Revenue (Million) Forecast, by Application 2019 & 2032
- Table 70: United States Recording Chart Paper Market Volume (Units) Forecast, by Application 2019 & 2032
- Table 71: Canada Recording Chart Paper Market Revenue (Million) Forecast, by Application 2019 & 2032
- Table 72: Canada Recording Chart Paper Market Volume (Units) Forecast, by Application 2019 & 2032
- Table 73: Mexico Recording Chart Paper Market Revenue (Million) Forecast, by Application 2019 & 2032
- Table 74: Mexico Recording Chart Paper Market Volume (Units) Forecast, by Application 2019 & 2032
- Table 75: Global Recording Chart Paper Market Revenue Million Forecast, by Product Type 2019 & 2032
- Table 76: Global Recording Chart Paper Market Volume Units Forecast, by Product Type 2019 & 2032
- Table 77: Global Recording Chart Paper Market Revenue Million Forecast, by End User 2019 & 2032
- Table 78: Global Recording Chart Paper Market Volume Units Forecast, by End User 2019 & 2032
- Table 79: Global Recording Chart Paper Market Revenue Million Forecast, by Country 2019 & 2032
- Table 80: Global Recording Chart Paper Market Volume Units Forecast, by Country 2019 & 2032
- Table 81: Germany Recording Chart Paper Market Revenue (Million) Forecast, by Application 2019 & 2032
- Table 82: Germany Recording Chart Paper Market Volume (Units) Forecast, by Application 2019 & 2032
- Table 83: United Kingdom Recording Chart Paper Market Revenue (Million) Forecast, by Application 2019 & 2032
- Table 84: United Kingdom Recording Chart Paper Market Volume (Units) Forecast, by Application 2019 & 2032
- Table 85: France Recording Chart Paper Market Revenue (Million) Forecast, by Application 2019 & 2032
- Table 86: France Recording Chart Paper Market Volume (Units) Forecast, by Application 2019 & 2032
- Table 87: Italy Recording Chart Paper Market Revenue (Million) Forecast, by Application 2019 & 2032
- Table 88: Italy Recording Chart Paper Market Volume (Units) Forecast, by Application 2019 & 2032
- Table 89: Spain Recording Chart Paper Market Revenue (Million) Forecast, by Application 2019 & 2032
- Table 90: Spain Recording Chart Paper Market Volume (Units) Forecast, by Application 2019 & 2032
- Table 91: Rest of Europe Recording Chart Paper Market Revenue (Million) Forecast, by Application 2019 & 2032
- Table 92: Rest of Europe Recording Chart Paper Market Volume (Units) Forecast, by Application 2019 & 2032
- Table 93: Global Recording Chart Paper Market Revenue Million Forecast, by Product Type 2019 & 2032
- Table 94: Global Recording Chart Paper Market Volume Units Forecast, by Product Type 2019 & 2032
- Table 95: Global Recording Chart Paper Market Revenue Million Forecast, by End User 2019 & 2032
- Table 96: Global Recording Chart Paper Market Volume Units Forecast, by End User 2019 & 2032
- Table 97: Global Recording Chart Paper Market Revenue Million Forecast, by Country 2019 & 2032
- Table 98: Global Recording Chart Paper Market Volume Units Forecast, by Country 2019 & 2032
- Table 99: China Recording Chart Paper Market Revenue (Million) Forecast, by Application 2019 & 2032
- Table 100: China Recording Chart Paper Market Volume (Units) Forecast, by Application 2019 & 2032
- Table 101: Japan Recording Chart Paper Market Revenue (Million) Forecast, by Application 2019 & 2032
- Table 102: Japan Recording Chart Paper Market Volume (Units) Forecast, by Application 2019 & 2032
- Table 103: India Recording Chart Paper Market Revenue (Million) Forecast, by Application 2019 & 2032
- Table 104: India Recording Chart Paper Market Volume (Units) Forecast, by Application 2019 & 2032
- Table 105: Australia Recording Chart Paper Market Revenue (Million) Forecast, by Application 2019 & 2032
- Table 106: Australia Recording Chart Paper Market Volume (Units) Forecast, by Application 2019 & 2032
- Table 107: South Korea Recording Chart Paper Market Revenue (Million) Forecast, by Application 2019 & 2032
- Table 108: South Korea Recording Chart Paper Market Volume (Units) Forecast, by Application 2019 & 2032
- Table 109: Rest of Asia Pacific Recording Chart Paper Market Revenue (Million) Forecast, by Application 2019 & 2032
- Table 110: Rest of Asia Pacific Recording Chart Paper Market Volume (Units) Forecast, by Application 2019 & 2032
- Table 111: Global Recording Chart Paper Market Revenue Million Forecast, by Product Type 2019 & 2032
- Table 112: Global Recording Chart Paper Market Volume Units Forecast, by Product Type 2019 & 2032
- Table 113: Global Recording Chart Paper Market Revenue Million Forecast, by End User 2019 & 2032
- Table 114: Global Recording Chart Paper Market Volume Units Forecast, by End User 2019 & 2032
- Table 115: Global Recording Chart Paper Market Revenue Million Forecast, by Country 2019 & 2032
- Table 116: Global Recording Chart Paper Market Volume Units Forecast, by Country 2019 & 2032
- Table 117: Global Recording Chart Paper Market Revenue Million Forecast, by Product Type 2019 & 2032
- Table 118: Global Recording Chart Paper Market Volume Units Forecast, by Product Type 2019 & 2032
- Table 119: Global Recording Chart Paper Market Revenue Million Forecast, by End User 2019 & 2032
- Table 120: Global Recording Chart Paper Market Volume Units Forecast, by End User 2019 & 2032
- Table 121: Global Recording Chart Paper Market Revenue Million Forecast, by Country 2019 & 2032
- Table 122: Global Recording Chart Paper Market Volume Units Forecast, by Country 2019 & 2032
- Table 123: South Africa Recording Chart Paper Market Revenue (Million) Forecast, by Application 2019 & 2032
- Table 124: South Africa Recording Chart Paper Market Volume (Units) Forecast, by Application 2019 & 2032
- Table 125: Rest of Middle East Recording Chart Paper Market Revenue (Million) Forecast, by Application 2019 & 2032
- Table 126: Rest of Middle East Recording Chart Paper Market Volume (Units) Forecast, by Application 2019 & 2032
- Table 127: Global Recording Chart Paper Market Revenue Million Forecast, by Product Type 2019 & 2032
- Table 128: Global Recording Chart Paper Market Volume Units Forecast, by Product Type 2019 & 2032
- Table 129: Global Recording Chart Paper Market Revenue Million Forecast, by End User 2019 & 2032
- Table 130: Global Recording Chart Paper Market Volume Units Forecast, by End User 2019 & 2032
- Table 131: Global Recording Chart Paper Market Revenue Million Forecast, by Country 2019 & 2032
- Table 132: Global Recording Chart Paper Market Volume Units Forecast, by Country 2019 & 2032
- Table 133: Brazil Recording Chart Paper Market Revenue (Million) Forecast, by Application 2019 & 2032
- Table 134: Brazil Recording Chart Paper Market Volume (Units) Forecast, by Application 2019 & 2032
- Table 135: Argentina Recording Chart Paper Market Revenue (Million) Forecast, by Application 2019 & 2032
- Table 136: Argentina Recording Chart Paper Market Volume (Units) Forecast, by Application 2019 & 2032
- Table 137: Rest of South America Recording Chart Paper Market Revenue (Million) Forecast, by Application 2019 & 2032
- Table 138: Rest of South America Recording Chart Paper Market Volume (Units) Forecast, by Application 2019 & 2032
Frequently Asked Questions
1. What is the projected Compound Annual Growth Rate (CAGR) of the Recording Chart Paper Market?
The projected CAGR is approximately 4.30%.
2. Which companies are prominent players in the Recording Chart Paper Market?
Key companies in the market include Tele-Paper Malaysia, Recorders Charts & Pens, Kokusai Chart Co, Merck KGaA, Thomas Scientific, Precision Charts Inc, Pirrone srl, Cardinal Health, GlobalSpec, DART TECHNOLOGIES.
3. What are the main segments of the Recording Chart Paper Market?
The market segments include Product Type, End User.
4. Can you provide details about the market size?
The market size is estimated to be USD XX Million as of 2022.
5. What are some drivers contributing to market growth?
; Increasing Prevalence of Cardiovascular Diseases; Increasing Geriatric Population and Births.
6. What are the notable trends driving market growth?
Fetal Monitoring Recording Chart Papers Segment is Expected to be the Fastest Growing Segment..
7. Are there any restraints impacting market growth?
; Growing Usage of Alternative Digital Instruments.
8. Can you provide examples of recent developments in the market?
N/A
9. What pricing options are available for accessing the report?
Pricing options include single-user, multi-user, and enterprise licenses priced at USD 4750, USD 5250, and USD 8750 respectively.
10. Is the market size provided in terms of value or volume?
The market size is provided in terms of value, measured in Million and volume, measured in Units.
11. Are there any specific market keywords associated with the report?
Yes, the market keyword associated with the report is "Recording Chart Paper Market," which aids in identifying and referencing the specific market segment covered.
12. How do I determine which pricing option suits my needs best?
The pricing options vary based on user requirements and access needs. Individual users may opt for single-user licenses, while businesses requiring broader access may choose multi-user or enterprise licenses for cost-effective access to the report.
13. Are there any additional resources or data provided in the Recording Chart Paper Market report?
While the report offers comprehensive insights, it's advisable to review the specific contents or supplementary materials provided to ascertain if additional resources or data are available.
14. How can I stay updated on further developments or reports in the Recording Chart Paper Market?
To stay informed about further developments, trends, and reports in the Recording Chart Paper Market, consider subscribing to industry newsletters, following relevant companies and organizations, or regularly checking reputable industry news sources and publications.
Methodology
Step 1 - Identification of Relevant Samples Size from Population Database


Step 2 - Approaches for Defining Global Market Size (Value, Volume* & Price*)

Note*: In applicable scenarios
Step 3 - Data Sources
Primary Research
- Web Analytics
- Survey Reports
- Research Institute
- Latest Research Reports
- Opinion Leaders
Secondary Research
- Annual Reports
- White Paper
- Latest Press Release
- Industry Association
- Paid Database
- Investor Presentations

Step 4 - Data Triangulation
Involves using different sources of information in order to increase the validity of a study
These sources are likely to be stakeholders in a program - participants, other researchers, program staff, other community members, and so on.
Then we put all data in single framework & apply various statistical tools to find out the dynamic on the market.
During the analysis stage, feedback from the stakeholder groups would be compared to determine areas of agreement as well as areas of divergence
