

Key Insights
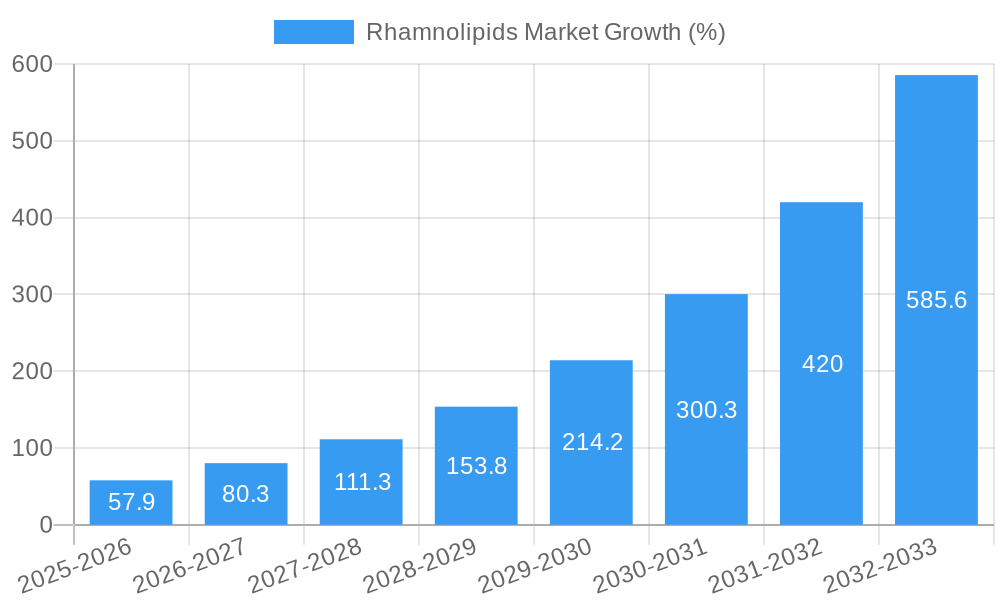
The global rhamnolipids market is experiencing robust growth, projected to reach a substantial value in the coming years, driven by a 38.03% CAGR. This expansion is fueled by increasing demand across diverse sectors. The surging popularity of bio-based and sustainable surfactants is a key driver, with rhamnolipids offering a compelling alternative to chemically synthesized counterparts due to their biodegradability and low toxicity. Significant growth is anticipated in the cosmetics and personal care segments, driven by consumer preference for natural and eco-friendly ingredients. Furthermore, the agricultural sector is adopting rhamnolipids as effective biopesticides and biostimulants, contributing to market expansion. The pharmaceutical industry is also exploring the potential of rhamnolipids as drug delivery systems and antimicrobial agents, further fueling market growth. While challenges remain, including relatively high production costs compared to conventional surfactants and the need for further research to optimize production efficiency, the overall market outlook remains positive. The market segmentation reveals strong growth potential across various application areas: surfactants (holding the largest share), cosmetics, agriculture, food, and pharmaceuticals. Regional analysis suggests North America and Europe as leading markets, followed by the Asia-Pacific region, which is projected to witness significant growth driven by increasing industrialization and rising consumer awareness of sustainable products.
The competitive landscape includes both established players and emerging companies, indicating a dynamic market with ongoing innovation. Companies are focusing on developing advanced production technologies to reduce costs and enhance the efficiency of rhamnolipid production. Strategic partnerships and collaborations between producers and end-users are emerging as key strategies to accelerate market penetration. Future growth will likely be influenced by government policies promoting sustainable technologies, increasing consumer demand for eco-friendly products, and advancements in rhamnolipid production methods. The focus on developing new applications and exploring niche markets will further contribute to the expansion of the rhamnolipids market throughout the forecast period. The market's continued evolution will depend on sustained technological advancements and a growing understanding of rhamnolipids' diverse potential applications.

Rhamnolipids Market: A Comprehensive Report (2019-2033)
This in-depth report provides a comprehensive analysis of the global Rhamnolipids market, encompassing market dynamics, growth trends, regional dominance, product landscape, key challenges, emerging opportunities, and key players. The study period covers 2019-2033, with 2025 serving as the base and estimated year. The report is invaluable for industry professionals, investors, and researchers seeking to understand this rapidly evolving market within the broader biosurfactants sector.
Rhamnolipids Market Dynamics & Structure
The rhamnolipids market, a segment within the larger biosurfactants market, is characterized by moderate concentration, with key players like Evonik Industries AG and AGAE Technologies LLC holding significant market share (xx%). Technological innovation, particularly in fermentation processes and strain optimization, is a major driver. Stringent regulatory frameworks concerning bio-based products influence market growth, while the emergence of alternative surfactants presents competitive pressures. End-user demographics are expanding across diverse sectors, including cosmetics, agriculture, and pharmaceuticals. M&A activity within the industry remains relatively modest, with xx deals recorded between 2019-2024 (estimated). Innovation barriers include the high cost of production and the need for efficient upscaling of production processes.
- Market Concentration: Moderately concentrated, with top 5 players holding xx% market share (2024 estimate).
- Technological Innovation: Focus on improving fermentation yields and reducing production costs.
- Regulatory Landscape: Stringent regulations for bio-based products impact market entry.
- Competitive Substitutes: Conventional chemical surfactants pose a competitive challenge.
- End-User Demographics: Expanding across diverse sectors like cosmetics, agriculture, and pharmaceuticals.
- M&A Activity: Moderate activity with xx deals (estimated) during 2019-2024.
Rhamnolipids Market Growth Trends & Insights
The global rhamnolipids market is experiencing robust growth, driven by increasing demand for sustainable and biodegradable alternatives to conventional surfactants. The market size is projected to reach xx million units by 2025 and further expand to xx million units by 2033, exhibiting a CAGR of xx% during the forecast period (2025-2033). This growth is fueled by the rising adoption of rhamnolipids in various applications, including cosmetics, agriculture, and pharmaceuticals. Technological disruptions, such as advancements in fermentation technology and strain engineering, are significantly accelerating market growth. Shifting consumer preferences towards eco-friendly products further bolster market expansion. Market penetration in key sectors like personal care and bioremediation is steadily increasing.
Dominant Regions, Countries, or Segments in Rhamnolipids Market
The rhamnolipids market is currently dominated by North America and Europe. This leadership position is fueled by robust regulatory frameworks that favor bio-based alternatives and a heightened consumer awareness of environmentally sustainable products. Analyzing the product segments, di-rhamnolipids command a significantly larger market share than mono-rhamnolipids (estimated at xx% versus xx% in 2024) due to their superior surfactant properties and enhanced performance characteristics. The surfactants application segment remains the most lucrative, accounting for xx% of total market revenue in 2024, followed by the cosmetics and agricultural sectors. However, the Asia-Pacific region presents a considerable growth opportunity, driven by escalating demand and a burgeoning market for sustainable solutions.
- North America and Europe: Leading market share due to strong regulatory support for bio-based products and high consumer demand for sustainable alternatives. These regions benefit from established infrastructure and a more mature market for green technologies.
- Di-Rhamnolipids segment: Holds a dominant market share owing to its superior emulsification, wetting, and foaming capabilities compared to mono-rhamnolipids, making it more suitable for a wider range of applications.
- Surfactants application: This segment’s dominance stems from the widespread use of rhamnolipids as effective and eco-friendly alternatives to conventional chemical surfactants across numerous industries.
- Asia-Pacific growth potential: This region's substantial untapped potential is fueled by rapidly increasing industrialization, rising consumer disposable incomes, and growing environmental concerns, leading to increased demand for sustainable products.
Rhamnolipids Market Product Landscape
Rhamnolipids are offered in various forms, including liquid and powder, tailored to specific applications. Product innovation focuses on enhancing properties like surface tension reduction, biodegradability, and cost-effectiveness. Recent advancements include the development of rhamnolipids with improved efficacy in specific applications, such as enhanced oil recovery and improved bioremediation capabilities. Unique selling propositions include superior biodegradability, low toxicity, and high efficacy as compared to their chemical counterparts.
Key Drivers, Barriers & Challenges in Rhamnolipids Market
Key Drivers: The rhamnolipids market is experiencing robust growth propelled by several key factors. The increasing global demand for eco-friendly and biodegradable surfactants is a significant driver, alongside stringent regulations aimed at phasing out harmful chemical surfactants. Growing consumer awareness of environmental sustainability and the inherent biodegradability of rhamnolipids further boosts market demand. Significant advancements in fermentation technology have resulted in lower production costs, enhancing the economic viability of rhamnolipids.
Key Challenges: Despite the positive market outlook, several challenges hinder widespread rhamnolipids adoption. High production costs relative to conventional chemical surfactants remain a significant obstacle. Scaling up production to meet the burgeoning demand presents logistical and technological hurdles. The limited availability of high-quality raw materials, especially those sourced sustainably, poses a constraint. Furthermore, navigating varying regional regulatory hurdles and obtaining necessary approvals can delay market entry. The substantial initial investment required for production facilities acts as a significant barrier to entry for smaller companies. Intense competition from established chemical surfactant manufacturers also presents a formidable challenge.
Emerging Opportunities in Rhamnolipids Market
Untapped markets like bioremediation, enhanced oil recovery, and specialized agricultural applications present significant growth opportunities. Innovation in application-specific formulations can further expand market reach. Evolving consumer preferences towards natural and sustainable products continue to fuel market expansion. Expansion into developing economies with a growing demand for bio-based products presents significant opportunities.
Growth Accelerators in the Rhamnolipids Market Industry
Several factors are accelerating the growth of the rhamnolipids market. Strategic collaborations between rhamnolipid producers and end-users are fostering market expansion by facilitating product development, application optimization, and streamlined supply chains. Continued technological advancements in fermentation processes and downstream processing are crucial for reducing production costs, improving product quality and purity, and enhancing overall efficiency. Targeted market expansion strategies focusing on high-growth application segments, such as enhanced oil recovery and personal care products, are actively driving market penetration. Furthermore, increasing investments in research and development are exploring novel applications and expanding the overall market potential.
Key Players Shaping the Rhamnolipids Market Market
- Biotensidon GmbH
- TensioGreen
- GlycoSurf
- AGAE Technologies LLC
- Evonik Industries AG
- Stepan Company
- Jeneil Biotech
- DEGUAN Biosurfactant Supplier
Notable Milestones in Rhamnolipids Market Sector
- September 2022: AGAE Technologies, LLC announced a 200% increase in rhamnolipid yields and a 67% reduction in production costs through optimized fermentation.
- June 2022: Evonik Industries AG invested a three-digit million-euro sum in a new rhamnolipid production plant in Slovakia, scheduled to open in two years.
In-Depth Rhamnolipids Market Market Outlook
The future of the rhamnolipids market appears promising, driven by sustained growth in demand for sustainable alternatives and technological advancements. Strategic partnerships, focus on application-specific formulations, and expansion into new geographical markets will further accelerate market growth. The market's potential is vast, particularly in sectors with growing environmental concerns and the increasing demand for bio-based products.
Rhamnolipids Market Segmentation
-
1. Type
- 1.1. Mono-Rhamnolipids
- 1.2. Di-Rhamnolipids
-
2. Application
- 2.1. Surfactants
- 2.2. Cosmetics
- 2.3. Agriculture
- 2.4. Food
- 2.5. Pharmaceutical
- 2.6. Other Applications
Rhamnolipids Market Segmentation By Geography
- 1. Asia Pacific
- 2. North America
- 3. Europe
- 4. South America
- 5. Middle East and Africa

Rhamnolipids Market REPORT HIGHLIGHTS
| Aspects | Details |
|---|---|
| Study Period | 2019-2033 |
| Base Year | 2024 |
| Estimated Year | 2025 |
| Forecast Period | 2025-2033 |
| Historical Period | 2019-2024 |
| Growth Rate | CAGR of 38.03% from 2019-2033 |
| Segmentation |
|
Table of Contents
- 1. Introduction
- 1.1. Research Scope
- 1.2. Market Segmentation
- 1.3. Research Methodology
- 1.4. Definitions and Assumptions
- 2. Executive Summary
- 2.1. Introduction
- 3. Market Dynamics
- 3.1. Introduction
- 3.2. Market Drivers
- 3.2.1. Emergence of Eco-friendly Surfactant; Increasing Demand For Personal Care Products
- 3.3. Market Restrains
- 3.3.1. Limitation in the Production of Rhamnolipids on an Industrial Scale
- 3.4. Market Trends
- 3.4.1. Growing Demand of Rhamnolipids from Surfactants
- 4. Market Factor Analysis
- 4.1. Porters Five Forces
- 4.2. Supply/Value Chain
- 4.3. PESTEL analysis
- 4.4. Market Entropy
- 4.5. Patent/Trademark Analysis
- 5. Global Rhamnolipids Market Analysis, Insights and Forecast, 2019-2031
- 5.1. Market Analysis, Insights and Forecast - by Type
- 5.1.1. Mono-Rhamnolipids
- 5.1.2. Di-Rhamnolipids
- 5.2. Market Analysis, Insights and Forecast - by Application
- 5.2.1. Surfactants
- 5.2.2. Cosmetics
- 5.2.3. Agriculture
- 5.2.4. Food
- 5.2.5. Pharmaceutical
- 5.2.6. Other Applications
- 5.3. Market Analysis, Insights and Forecast - by Region
- 5.3.1. Asia Pacific
- 5.3.2. North America
- 5.3.3. Europe
- 5.3.4. South America
- 5.3.5. Middle East and Africa
- 5.1. Market Analysis, Insights and Forecast - by Type
- 6. Asia Pacific Rhamnolipids Market Analysis, Insights and Forecast, 2019-2031
- 6.1. Market Analysis, Insights and Forecast - by Type
- 6.1.1. Mono-Rhamnolipids
- 6.1.2. Di-Rhamnolipids
- 6.2. Market Analysis, Insights and Forecast - by Application
- 6.2.1. Surfactants
- 6.2.2. Cosmetics
- 6.2.3. Agriculture
- 6.2.4. Food
- 6.2.5. Pharmaceutical
- 6.2.6. Other Applications
- 6.1. Market Analysis, Insights and Forecast - by Type
- 7. North America Rhamnolipids Market Analysis, Insights and Forecast, 2019-2031
- 7.1. Market Analysis, Insights and Forecast - by Type
- 7.1.1. Mono-Rhamnolipids
- 7.1.2. Di-Rhamnolipids
- 7.2. Market Analysis, Insights and Forecast - by Application
- 7.2.1. Surfactants
- 7.2.2. Cosmetics
- 7.2.3. Agriculture
- 7.2.4. Food
- 7.2.5. Pharmaceutical
- 7.2.6. Other Applications
- 7.1. Market Analysis, Insights and Forecast - by Type
- 8. Europe Rhamnolipids Market Analysis, Insights and Forecast, 2019-2031
- 8.1. Market Analysis, Insights and Forecast - by Type
- 8.1.1. Mono-Rhamnolipids
- 8.1.2. Di-Rhamnolipids
- 8.2. Market Analysis, Insights and Forecast - by Application
- 8.2.1. Surfactants
- 8.2.2. Cosmetics
- 8.2.3. Agriculture
- 8.2.4. Food
- 8.2.5. Pharmaceutical
- 8.2.6. Other Applications
- 8.1. Market Analysis, Insights and Forecast - by Type
- 9. South America Rhamnolipids Market Analysis, Insights and Forecast, 2019-2031
- 9.1. Market Analysis, Insights and Forecast - by Type
- 9.1.1. Mono-Rhamnolipids
- 9.1.2. Di-Rhamnolipids
- 9.2. Market Analysis, Insights and Forecast - by Application
- 9.2.1. Surfactants
- 9.2.2. Cosmetics
- 9.2.3. Agriculture
- 9.2.4. Food
- 9.2.5. Pharmaceutical
- 9.2.6. Other Applications
- 9.1. Market Analysis, Insights and Forecast - by Type
- 10. Middle East and Africa Rhamnolipids Market Analysis, Insights and Forecast, 2019-2031
- 10.1. Market Analysis, Insights and Forecast - by Type
- 10.1.1. Mono-Rhamnolipids
- 10.1.2. Di-Rhamnolipids
- 10.2. Market Analysis, Insights and Forecast - by Application
- 10.2.1. Surfactants
- 10.2.2. Cosmetics
- 10.2.3. Agriculture
- 10.2.4. Food
- 10.2.5. Pharmaceutical
- 10.2.6. Other Applications
- 10.1. Market Analysis, Insights and Forecast - by Type
- 11. North America Rhamnolipids Market Analysis, Insights and Forecast, 2019-2031
- 11.1. Market Analysis, Insights and Forecast - By Country/Sub-region
- 11.1.1 United States
- 11.1.2 Canada
- 11.1.3 Mexico
- 12. Europe Rhamnolipids Market Analysis, Insights and Forecast, 2019-2031
- 12.1. Market Analysis, Insights and Forecast - By Country/Sub-region
- 12.1.1 Germany
- 12.1.2 United Kingdom
- 12.1.3 France
- 12.1.4 Spain
- 12.1.5 Italy
- 12.1.6 Spain
- 12.1.7 Belgium
- 12.1.8 Netherland
- 12.1.9 Nordics
- 12.1.10 Rest of Europe
- 13. Asia Pacific Rhamnolipids Market Analysis, Insights and Forecast, 2019-2031
- 13.1. Market Analysis, Insights and Forecast - By Country/Sub-region
- 13.1.1 China
- 13.1.2 Japan
- 13.1.3 India
- 13.1.4 South Korea
- 13.1.5 Southeast Asia
- 13.1.6 Australia
- 13.1.7 Indonesia
- 13.1.8 Phillipes
- 13.1.9 Singapore
- 13.1.10 Thailandc
- 13.1.11 Rest of Asia Pacific
- 14. South America Rhamnolipids Market Analysis, Insights and Forecast, 2019-2031
- 14.1. Market Analysis, Insights and Forecast - By Country/Sub-region
- 14.1.1 Brazil
- 14.1.2 Argentina
- 14.1.3 Peru
- 14.1.4 Chile
- 14.1.5 Colombia
- 14.1.6 Ecuador
- 14.1.7 Venezuela
- 14.1.8 Rest of South America
- 15. North America Rhamnolipids Market Analysis, Insights and Forecast, 2019-2031
- 15.1. Market Analysis, Insights and Forecast - By Country/Sub-region
- 15.1.1 United States
- 15.1.2 Canada
- 15.1.3 Mexico
- 16. MEA Rhamnolipids Market Analysis, Insights and Forecast, 2019-2031
- 16.1. Market Analysis, Insights and Forecast - By Country/Sub-region
- 16.1.1 United Arab Emirates
- 16.1.2 Saudi Arabia
- 16.1.3 South Africa
- 16.1.4 Rest of Middle East and Africa
- 17. Competitive Analysis
- 17.1. Global Market Share Analysis 2024
- 17.2. Company Profiles
- 17.2.1 Biotensidon GmbH
- 17.2.1.1. Overview
- 17.2.1.2. Products
- 17.2.1.3. SWOT Analysis
- 17.2.1.4. Recent Developments
- 17.2.1.5. Financials (Based on Availability)
- 17.2.2 TensioGreen*List Not Exhaustive
- 17.2.2.1. Overview
- 17.2.2.2. Products
- 17.2.2.3. SWOT Analysis
- 17.2.2.4. Recent Developments
- 17.2.2.5. Financials (Based on Availability)
- 17.2.3 GlycoSurf
- 17.2.3.1. Overview
- 17.2.3.2. Products
- 17.2.3.3. SWOT Analysis
- 17.2.3.4. Recent Developments
- 17.2.3.5. Financials (Based on Availability)
- 17.2.4 AGAE Technologies LLC
- 17.2.4.1. Overview
- 17.2.4.2. Products
- 17.2.4.3. SWOT Analysis
- 17.2.4.4. Recent Developments
- 17.2.4.5. Financials (Based on Availability)
- 17.2.5 Evonik Industries AG
- 17.2.5.1. Overview
- 17.2.5.2. Products
- 17.2.5.3. SWOT Analysis
- 17.2.5.4. Recent Developments
- 17.2.5.5. Financials (Based on Availability)
- 17.2.6 Stepan Company
- 17.2.6.1. Overview
- 17.2.6.2. Products
- 17.2.6.3. SWOT Analysis
- 17.2.6.4. Recent Developments
- 17.2.6.5. Financials (Based on Availability)
- 17.2.7 Jeneil Biotech
- 17.2.7.1. Overview
- 17.2.7.2. Products
- 17.2.7.3. SWOT Analysis
- 17.2.7.4. Recent Developments
- 17.2.7.5. Financials (Based on Availability)
- 17.2.8 DEGUAN Biosurfactant Supplier
- 17.2.8.1. Overview
- 17.2.8.2. Products
- 17.2.8.3. SWOT Analysis
- 17.2.8.4. Recent Developments
- 17.2.8.5. Financials (Based on Availability)
- 17.2.1 Biotensidon GmbH
List of Figures
- Figure 1: Global Rhamnolipids Market Revenue Breakdown (Million, %) by Region 2024 & 2032
- Figure 2: Global Rhamnolipids Market Volume Breakdown (Million, %) by Region 2024 & 2032
- Figure 3: North America Rhamnolipids Market Revenue (Million), by Country 2024 & 2032
- Figure 4: North America Rhamnolipids Market Volume (Million), by Country 2024 & 2032
- Figure 5: North America Rhamnolipids Market Revenue Share (%), by Country 2024 & 2032
- Figure 6: North America Rhamnolipids Market Volume Share (%), by Country 2024 & 2032
- Figure 7: Europe Rhamnolipids Market Revenue (Million), by Country 2024 & 2032
- Figure 8: Europe Rhamnolipids Market Volume (Million), by Country 2024 & 2032
- Figure 9: Europe Rhamnolipids Market Revenue Share (%), by Country 2024 & 2032
- Figure 10: Europe Rhamnolipids Market Volume Share (%), by Country 2024 & 2032
- Figure 11: Asia Pacific Rhamnolipids Market Revenue (Million), by Country 2024 & 2032
- Figure 12: Asia Pacific Rhamnolipids Market Volume (Million), by Country 2024 & 2032
- Figure 13: Asia Pacific Rhamnolipids Market Revenue Share (%), by Country 2024 & 2032
- Figure 14: Asia Pacific Rhamnolipids Market Volume Share (%), by Country 2024 & 2032
- Figure 15: South America Rhamnolipids Market Revenue (Million), by Country 2024 & 2032
- Figure 16: South America Rhamnolipids Market Volume (Million), by Country 2024 & 2032
- Figure 17: South America Rhamnolipids Market Revenue Share (%), by Country 2024 & 2032
- Figure 18: South America Rhamnolipids Market Volume Share (%), by Country 2024 & 2032
- Figure 19: North America Rhamnolipids Market Revenue (Million), by Country 2024 & 2032
- Figure 20: North America Rhamnolipids Market Volume (Million), by Country 2024 & 2032
- Figure 21: North America Rhamnolipids Market Revenue Share (%), by Country 2024 & 2032
- Figure 22: North America Rhamnolipids Market Volume Share (%), by Country 2024 & 2032
- Figure 23: MEA Rhamnolipids Market Revenue (Million), by Country 2024 & 2032
- Figure 24: MEA Rhamnolipids Market Volume (Million), by Country 2024 & 2032
- Figure 25: MEA Rhamnolipids Market Revenue Share (%), by Country 2024 & 2032
- Figure 26: MEA Rhamnolipids Market Volume Share (%), by Country 2024 & 2032
- Figure 27: Asia Pacific Rhamnolipids Market Revenue (Million), by Type 2024 & 2032
- Figure 28: Asia Pacific Rhamnolipids Market Volume (Million), by Type 2024 & 2032
- Figure 29: Asia Pacific Rhamnolipids Market Revenue Share (%), by Type 2024 & 2032
- Figure 30: Asia Pacific Rhamnolipids Market Volume Share (%), by Type 2024 & 2032
- Figure 31: Asia Pacific Rhamnolipids Market Revenue (Million), by Application 2024 & 2032
- Figure 32: Asia Pacific Rhamnolipids Market Volume (Million), by Application 2024 & 2032
- Figure 33: Asia Pacific Rhamnolipids Market Revenue Share (%), by Application 2024 & 2032
- Figure 34: Asia Pacific Rhamnolipids Market Volume Share (%), by Application 2024 & 2032
- Figure 35: Asia Pacific Rhamnolipids Market Revenue (Million), by Country 2024 & 2032
- Figure 36: Asia Pacific Rhamnolipids Market Volume (Million), by Country 2024 & 2032
- Figure 37: Asia Pacific Rhamnolipids Market Revenue Share (%), by Country 2024 & 2032
- Figure 38: Asia Pacific Rhamnolipids Market Volume Share (%), by Country 2024 & 2032
- Figure 39: North America Rhamnolipids Market Revenue (Million), by Type 2024 & 2032
- Figure 40: North America Rhamnolipids Market Volume (Million), by Type 2024 & 2032
- Figure 41: North America Rhamnolipids Market Revenue Share (%), by Type 2024 & 2032
- Figure 42: North America Rhamnolipids Market Volume Share (%), by Type 2024 & 2032
- Figure 43: North America Rhamnolipids Market Revenue (Million), by Application 2024 & 2032
- Figure 44: North America Rhamnolipids Market Volume (Million), by Application 2024 & 2032
- Figure 45: North America Rhamnolipids Market Revenue Share (%), by Application 2024 & 2032
- Figure 46: North America Rhamnolipids Market Volume Share (%), by Application 2024 & 2032
- Figure 47: North America Rhamnolipids Market Revenue (Million), by Country 2024 & 2032
- Figure 48: North America Rhamnolipids Market Volume (Million), by Country 2024 & 2032
- Figure 49: North America Rhamnolipids Market Revenue Share (%), by Country 2024 & 2032
- Figure 50: North America Rhamnolipids Market Volume Share (%), by Country 2024 & 2032
- Figure 51: Europe Rhamnolipids Market Revenue (Million), by Type 2024 & 2032
- Figure 52: Europe Rhamnolipids Market Volume (Million), by Type 2024 & 2032
- Figure 53: Europe Rhamnolipids Market Revenue Share (%), by Type 2024 & 2032
- Figure 54: Europe Rhamnolipids Market Volume Share (%), by Type 2024 & 2032
- Figure 55: Europe Rhamnolipids Market Revenue (Million), by Application 2024 & 2032
- Figure 56: Europe Rhamnolipids Market Volume (Million), by Application 2024 & 2032
- Figure 57: Europe Rhamnolipids Market Revenue Share (%), by Application 2024 & 2032
- Figure 58: Europe Rhamnolipids Market Volume Share (%), by Application 2024 & 2032
- Figure 59: Europe Rhamnolipids Market Revenue (Million), by Country 2024 & 2032
- Figure 60: Europe Rhamnolipids Market Volume (Million), by Country 2024 & 2032
- Figure 61: Europe Rhamnolipids Market Revenue Share (%), by Country 2024 & 2032
- Figure 62: Europe Rhamnolipids Market Volume Share (%), by Country 2024 & 2032
- Figure 63: South America Rhamnolipids Market Revenue (Million), by Type 2024 & 2032
- Figure 64: South America Rhamnolipids Market Volume (Million), by Type 2024 & 2032
- Figure 65: South America Rhamnolipids Market Revenue Share (%), by Type 2024 & 2032
- Figure 66: South America Rhamnolipids Market Volume Share (%), by Type 2024 & 2032
- Figure 67: South America Rhamnolipids Market Revenue (Million), by Application 2024 & 2032
- Figure 68: South America Rhamnolipids Market Volume (Million), by Application 2024 & 2032
- Figure 69: South America Rhamnolipids Market Revenue Share (%), by Application 2024 & 2032
- Figure 70: South America Rhamnolipids Market Volume Share (%), by Application 2024 & 2032
- Figure 71: South America Rhamnolipids Market Revenue (Million), by Country 2024 & 2032
- Figure 72: South America Rhamnolipids Market Volume (Million), by Country 2024 & 2032
- Figure 73: South America Rhamnolipids Market Revenue Share (%), by Country 2024 & 2032
- Figure 74: South America Rhamnolipids Market Volume Share (%), by Country 2024 & 2032
- Figure 75: Middle East and Africa Rhamnolipids Market Revenue (Million), by Type 2024 & 2032
- Figure 76: Middle East and Africa Rhamnolipids Market Volume (Million), by Type 2024 & 2032
- Figure 77: Middle East and Africa Rhamnolipids Market Revenue Share (%), by Type 2024 & 2032
- Figure 78: Middle East and Africa Rhamnolipids Market Volume Share (%), by Type 2024 & 2032
- Figure 79: Middle East and Africa Rhamnolipids Market Revenue (Million), by Application 2024 & 2032
- Figure 80: Middle East and Africa Rhamnolipids Market Volume (Million), by Application 2024 & 2032
- Figure 81: Middle East and Africa Rhamnolipids Market Revenue Share (%), by Application 2024 & 2032
- Figure 82: Middle East and Africa Rhamnolipids Market Volume Share (%), by Application 2024 & 2032
- Figure 83: Middle East and Africa Rhamnolipids Market Revenue (Million), by Country 2024 & 2032
- Figure 84: Middle East and Africa Rhamnolipids Market Volume (Million), by Country 2024 & 2032
- Figure 85: Middle East and Africa Rhamnolipids Market Revenue Share (%), by Country 2024 & 2032
- Figure 86: Middle East and Africa Rhamnolipids Market Volume Share (%), by Country 2024 & 2032
List of Tables
- Table 1: Global Rhamnolipids Market Revenue Million Forecast, by Region 2019 & 2032
- Table 2: Global Rhamnolipids Market Volume Million Forecast, by Region 2019 & 2032
- Table 3: Global Rhamnolipids Market Revenue Million Forecast, by Type 2019 & 2032
- Table 4: Global Rhamnolipids Market Volume Million Forecast, by Type 2019 & 2032
- Table 5: Global Rhamnolipids Market Revenue Million Forecast, by Application 2019 & 2032
- Table 6: Global Rhamnolipids Market Volume Million Forecast, by Application 2019 & 2032
- Table 7: Global Rhamnolipids Market Revenue Million Forecast, by Region 2019 & 2032
- Table 8: Global Rhamnolipids Market Volume Million Forecast, by Region 2019 & 2032
- Table 9: Global Rhamnolipids Market Revenue Million Forecast, by Country 2019 & 2032
- Table 10: Global Rhamnolipids Market Volume Million Forecast, by Country 2019 & 2032
- Table 11: United States Rhamnolipids Market Revenue (Million) Forecast, by Application 2019 & 2032
- Table 12: United States Rhamnolipids Market Volume (Million) Forecast, by Application 2019 & 2032
- Table 13: Canada Rhamnolipids Market Revenue (Million) Forecast, by Application 2019 & 2032
- Table 14: Canada Rhamnolipids Market Volume (Million) Forecast, by Application 2019 & 2032
- Table 15: Mexico Rhamnolipids Market Revenue (Million) Forecast, by Application 2019 & 2032
- Table 16: Mexico Rhamnolipids Market Volume (Million) Forecast, by Application 2019 & 2032
- Table 17: Global Rhamnolipids Market Revenue Million Forecast, by Country 2019 & 2032
- Table 18: Global Rhamnolipids Market Volume Million Forecast, by Country 2019 & 2032
- Table 19: Germany Rhamnolipids Market Revenue (Million) Forecast, by Application 2019 & 2032
- Table 20: Germany Rhamnolipids Market Volume (Million) Forecast, by Application 2019 & 2032
- Table 21: United Kingdom Rhamnolipids Market Revenue (Million) Forecast, by Application 2019 & 2032
- Table 22: United Kingdom Rhamnolipids Market Volume (Million) Forecast, by Application 2019 & 2032
- Table 23: France Rhamnolipids Market Revenue (Million) Forecast, by Application 2019 & 2032
- Table 24: France Rhamnolipids Market Volume (Million) Forecast, by Application 2019 & 2032
- Table 25: Spain Rhamnolipids Market Revenue (Million) Forecast, by Application 2019 & 2032
- Table 26: Spain Rhamnolipids Market Volume (Million) Forecast, by Application 2019 & 2032
- Table 27: Italy Rhamnolipids Market Revenue (Million) Forecast, by Application 2019 & 2032
- Table 28: Italy Rhamnolipids Market Volume (Million) Forecast, by Application 2019 & 2032
- Table 29: Spain Rhamnolipids Market Revenue (Million) Forecast, by Application 2019 & 2032
- Table 30: Spain Rhamnolipids Market Volume (Million) Forecast, by Application 2019 & 2032
- Table 31: Belgium Rhamnolipids Market Revenue (Million) Forecast, by Application 2019 & 2032
- Table 32: Belgium Rhamnolipids Market Volume (Million) Forecast, by Application 2019 & 2032
- Table 33: Netherland Rhamnolipids Market Revenue (Million) Forecast, by Application 2019 & 2032
- Table 34: Netherland Rhamnolipids Market Volume (Million) Forecast, by Application 2019 & 2032
- Table 35: Nordics Rhamnolipids Market Revenue (Million) Forecast, by Application 2019 & 2032
- Table 36: Nordics Rhamnolipids Market Volume (Million) Forecast, by Application 2019 & 2032
- Table 37: Rest of Europe Rhamnolipids Market Revenue (Million) Forecast, by Application 2019 & 2032
- Table 38: Rest of Europe Rhamnolipids Market Volume (Million) Forecast, by Application 2019 & 2032
- Table 39: Global Rhamnolipids Market Revenue Million Forecast, by Country 2019 & 2032
- Table 40: Global Rhamnolipids Market Volume Million Forecast, by Country 2019 & 2032
- Table 41: China Rhamnolipids Market Revenue (Million) Forecast, by Application 2019 & 2032
- Table 42: China Rhamnolipids Market Volume (Million) Forecast, by Application 2019 & 2032
- Table 43: Japan Rhamnolipids Market Revenue (Million) Forecast, by Application 2019 & 2032
- Table 44: Japan Rhamnolipids Market Volume (Million) Forecast, by Application 2019 & 2032
- Table 45: India Rhamnolipids Market Revenue (Million) Forecast, by Application 2019 & 2032
- Table 46: India Rhamnolipids Market Volume (Million) Forecast, by Application 2019 & 2032
- Table 47: South Korea Rhamnolipids Market Revenue (Million) Forecast, by Application 2019 & 2032
- Table 48: South Korea Rhamnolipids Market Volume (Million) Forecast, by Application 2019 & 2032
- Table 49: Southeast Asia Rhamnolipids Market Revenue (Million) Forecast, by Application 2019 & 2032
- Table 50: Southeast Asia Rhamnolipids Market Volume (Million) Forecast, by Application 2019 & 2032
- Table 51: Australia Rhamnolipids Market Revenue (Million) Forecast, by Application 2019 & 2032
- Table 52: Australia Rhamnolipids Market Volume (Million) Forecast, by Application 2019 & 2032
- Table 53: Indonesia Rhamnolipids Market Revenue (Million) Forecast, by Application 2019 & 2032
- Table 54: Indonesia Rhamnolipids Market Volume (Million) Forecast, by Application 2019 & 2032
- Table 55: Phillipes Rhamnolipids Market Revenue (Million) Forecast, by Application 2019 & 2032
- Table 56: Phillipes Rhamnolipids Market Volume (Million) Forecast, by Application 2019 & 2032
- Table 57: Singapore Rhamnolipids Market Revenue (Million) Forecast, by Application 2019 & 2032
- Table 58: Singapore Rhamnolipids Market Volume (Million) Forecast, by Application 2019 & 2032
- Table 59: Thailandc Rhamnolipids Market Revenue (Million) Forecast, by Application 2019 & 2032
- Table 60: Thailandc Rhamnolipids Market Volume (Million) Forecast, by Application 2019 & 2032
- Table 61: Rest of Asia Pacific Rhamnolipids Market Revenue (Million) Forecast, by Application 2019 & 2032
- Table 62: Rest of Asia Pacific Rhamnolipids Market Volume (Million) Forecast, by Application 2019 & 2032
- Table 63: Global Rhamnolipids Market Revenue Million Forecast, by Country 2019 & 2032
- Table 64: Global Rhamnolipids Market Volume Million Forecast, by Country 2019 & 2032
- Table 65: Brazil Rhamnolipids Market Revenue (Million) Forecast, by Application 2019 & 2032
- Table 66: Brazil Rhamnolipids Market Volume (Million) Forecast, by Application 2019 & 2032
- Table 67: Argentina Rhamnolipids Market Revenue (Million) Forecast, by Application 2019 & 2032
- Table 68: Argentina Rhamnolipids Market Volume (Million) Forecast, by Application 2019 & 2032
- Table 69: Peru Rhamnolipids Market Revenue (Million) Forecast, by Application 2019 & 2032
- Table 70: Peru Rhamnolipids Market Volume (Million) Forecast, by Application 2019 & 2032
- Table 71: Chile Rhamnolipids Market Revenue (Million) Forecast, by Application 2019 & 2032
- Table 72: Chile Rhamnolipids Market Volume (Million) Forecast, by Application 2019 & 2032
- Table 73: Colombia Rhamnolipids Market Revenue (Million) Forecast, by Application 2019 & 2032
- Table 74: Colombia Rhamnolipids Market Volume (Million) Forecast, by Application 2019 & 2032
- Table 75: Ecuador Rhamnolipids Market Revenue (Million) Forecast, by Application 2019 & 2032
- Table 76: Ecuador Rhamnolipids Market Volume (Million) Forecast, by Application 2019 & 2032
- Table 77: Venezuela Rhamnolipids Market Revenue (Million) Forecast, by Application 2019 & 2032
- Table 78: Venezuela Rhamnolipids Market Volume (Million) Forecast, by Application 2019 & 2032
- Table 79: Rest of South America Rhamnolipids Market Revenue (Million) Forecast, by Application 2019 & 2032
- Table 80: Rest of South America Rhamnolipids Market Volume (Million) Forecast, by Application 2019 & 2032
- Table 81: Global Rhamnolipids Market Revenue Million Forecast, by Country 2019 & 2032
- Table 82: Global Rhamnolipids Market Volume Million Forecast, by Country 2019 & 2032
- Table 83: United States Rhamnolipids Market Revenue (Million) Forecast, by Application 2019 & 2032
- Table 84: United States Rhamnolipids Market Volume (Million) Forecast, by Application 2019 & 2032
- Table 85: Canada Rhamnolipids Market Revenue (Million) Forecast, by Application 2019 & 2032
- Table 86: Canada Rhamnolipids Market Volume (Million) Forecast, by Application 2019 & 2032
- Table 87: Mexico Rhamnolipids Market Revenue (Million) Forecast, by Application 2019 & 2032
- Table 88: Mexico Rhamnolipids Market Volume (Million) Forecast, by Application 2019 & 2032
- Table 89: Global Rhamnolipids Market Revenue Million Forecast, by Country 2019 & 2032
- Table 90: Global Rhamnolipids Market Volume Million Forecast, by Country 2019 & 2032
- Table 91: United Arab Emirates Rhamnolipids Market Revenue (Million) Forecast, by Application 2019 & 2032
- Table 92: United Arab Emirates Rhamnolipids Market Volume (Million) Forecast, by Application 2019 & 2032
- Table 93: Saudi Arabia Rhamnolipids Market Revenue (Million) Forecast, by Application 2019 & 2032
- Table 94: Saudi Arabia Rhamnolipids Market Volume (Million) Forecast, by Application 2019 & 2032
- Table 95: South Africa Rhamnolipids Market Revenue (Million) Forecast, by Application 2019 & 2032
- Table 96: South Africa Rhamnolipids Market Volume (Million) Forecast, by Application 2019 & 2032
- Table 97: Rest of Middle East and Africa Rhamnolipids Market Revenue (Million) Forecast, by Application 2019 & 2032
- Table 98: Rest of Middle East and Africa Rhamnolipids Market Volume (Million) Forecast, by Application 2019 & 2032
- Table 99: Global Rhamnolipids Market Revenue Million Forecast, by Type 2019 & 2032
- Table 100: Global Rhamnolipids Market Volume Million Forecast, by Type 2019 & 2032
- Table 101: Global Rhamnolipids Market Revenue Million Forecast, by Application 2019 & 2032
- Table 102: Global Rhamnolipids Market Volume Million Forecast, by Application 2019 & 2032
- Table 103: Global Rhamnolipids Market Revenue Million Forecast, by Country 2019 & 2032
- Table 104: Global Rhamnolipids Market Volume Million Forecast, by Country 2019 & 2032
- Table 105: Global Rhamnolipids Market Revenue Million Forecast, by Type 2019 & 2032
- Table 106: Global Rhamnolipids Market Volume Million Forecast, by Type 2019 & 2032
- Table 107: Global Rhamnolipids Market Revenue Million Forecast, by Application 2019 & 2032
- Table 108: Global Rhamnolipids Market Volume Million Forecast, by Application 2019 & 2032
- Table 109: Global Rhamnolipids Market Revenue Million Forecast, by Country 2019 & 2032
- Table 110: Global Rhamnolipids Market Volume Million Forecast, by Country 2019 & 2032
- Table 111: Global Rhamnolipids Market Revenue Million Forecast, by Type 2019 & 2032
- Table 112: Global Rhamnolipids Market Volume Million Forecast, by Type 2019 & 2032
- Table 113: Global Rhamnolipids Market Revenue Million Forecast, by Application 2019 & 2032
- Table 114: Global Rhamnolipids Market Volume Million Forecast, by Application 2019 & 2032
- Table 115: Global Rhamnolipids Market Revenue Million Forecast, by Country 2019 & 2032
- Table 116: Global Rhamnolipids Market Volume Million Forecast, by Country 2019 & 2032
- Table 117: Global Rhamnolipids Market Revenue Million Forecast, by Type 2019 & 2032
- Table 118: Global Rhamnolipids Market Volume Million Forecast, by Type 2019 & 2032
- Table 119: Global Rhamnolipids Market Revenue Million Forecast, by Application 2019 & 2032
- Table 120: Global Rhamnolipids Market Volume Million Forecast, by Application 2019 & 2032
- Table 121: Global Rhamnolipids Market Revenue Million Forecast, by Country 2019 & 2032
- Table 122: Global Rhamnolipids Market Volume Million Forecast, by Country 2019 & 2032
- Table 123: Global Rhamnolipids Market Revenue Million Forecast, by Type 2019 & 2032
- Table 124: Global Rhamnolipids Market Volume Million Forecast, by Type 2019 & 2032
- Table 125: Global Rhamnolipids Market Revenue Million Forecast, by Application 2019 & 2032
- Table 126: Global Rhamnolipids Market Volume Million Forecast, by Application 2019 & 2032
- Table 127: Global Rhamnolipids Market Revenue Million Forecast, by Country 2019 & 2032
- Table 128: Global Rhamnolipids Market Volume Million Forecast, by Country 2019 & 2032
Frequently Asked Questions
1. What is the projected Compound Annual Growth Rate (CAGR) of the Rhamnolipids Market?
The projected CAGR is approximately 38.03%.
2. Which companies are prominent players in the Rhamnolipids Market?
Key companies in the market include Biotensidon GmbH, TensioGreen*List Not Exhaustive, GlycoSurf, AGAE Technologies LLC, Evonik Industries AG, Stepan Company, Jeneil Biotech, DEGUAN Biosurfactant Supplier.
3. What are the main segments of the Rhamnolipids Market?
The market segments include Type, Application.
4. Can you provide details about the market size?
The market size is estimated to be USD XX Million as of 2022.
5. What are some drivers contributing to market growth?
Emergence of Eco-friendly Surfactant; Increasing Demand For Personal Care Products.
6. What are the notable trends driving market growth?
Growing Demand of Rhamnolipids from Surfactants.
7. Are there any restraints impacting market growth?
Limitation in the Production of Rhamnolipids on an Industrial Scale.
8. Can you provide examples of recent developments in the market?
September 2022: AGAE Technologies, LLC announced the discovery of employing certain strains and mediums under optimized fermentation conditions to obtain record-high rhamnolipid yields at the lowest possible cost. When compared to traditionally optimized fermentation settings, the fermentation methods enhanced yields by approximately 200% while lowering production costs to about one-third of the conventionally optimized conditions.
9. What pricing options are available for accessing the report?
Pricing options include single-user, multi-user, and enterprise licenses priced at USD 4750, USD 5250, and USD 8750 respectively.
10. Is the market size provided in terms of value or volume?
The market size is provided in terms of value, measured in Million and volume, measured in Million.
11. Are there any specific market keywords associated with the report?
Yes, the market keyword associated with the report is "Rhamnolipids Market," which aids in identifying and referencing the specific market segment covered.
12. How do I determine which pricing option suits my needs best?
The pricing options vary based on user requirements and access needs. Individual users may opt for single-user licenses, while businesses requiring broader access may choose multi-user or enterprise licenses for cost-effective access to the report.
13. Are there any additional resources or data provided in the Rhamnolipids Market report?
While the report offers comprehensive insights, it's advisable to review the specific contents or supplementary materials provided to ascertain if additional resources or data are available.
14. How can I stay updated on further developments or reports in the Rhamnolipids Market?
To stay informed about further developments, trends, and reports in the Rhamnolipids Market, consider subscribing to industry newsletters, following relevant companies and organizations, or regularly checking reputable industry news sources and publications.
Methodology
Step 1 - Identification of Relevant Samples Size from Population Database


Step 2 - Approaches for Defining Global Market Size (Value, Volume* & Price*)

Note*: In applicable scenarios
Step 3 - Data Sources
Primary Research
- Web Analytics
- Survey Reports
- Research Institute
- Latest Research Reports
- Opinion Leaders
Secondary Research
- Annual Reports
- White Paper
- Latest Press Release
- Industry Association
- Paid Database
- Investor Presentations

Step 4 - Data Triangulation
Involves using different sources of information in order to increase the validity of a study
These sources are likely to be stakeholders in a program - participants, other researchers, program staff, other community members, and so on.
Then we put all data in single framework & apply various statistical tools to find out the dynamic on the market.
During the analysis stage, feedback from the stakeholder groups would be compared to determine areas of agreement as well as areas of divergence
