

Key Insights
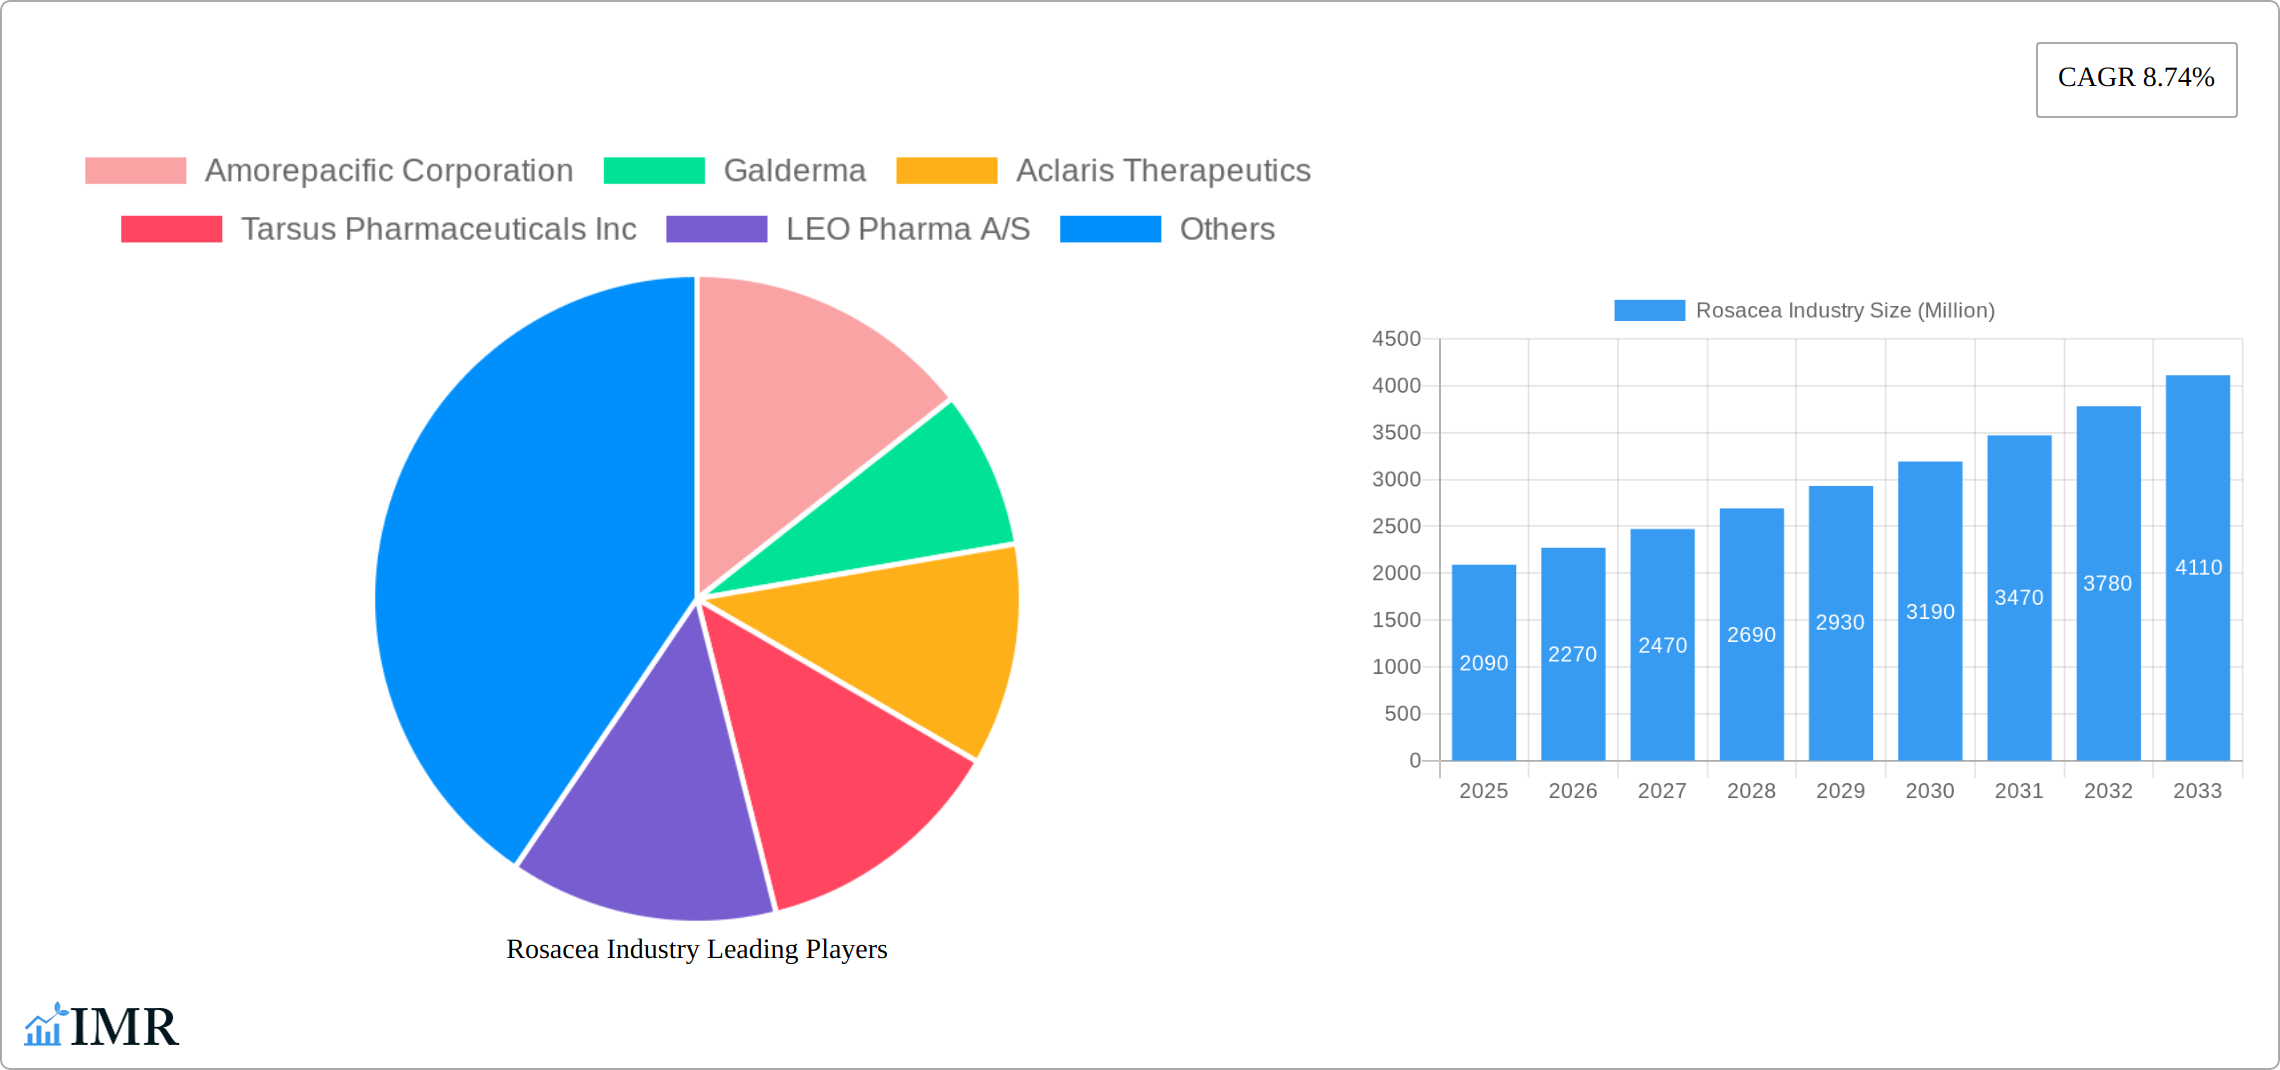
The rosacea market, valued at $2.09 billion in 2025, is projected to experience robust growth, exhibiting a compound annual growth rate (CAGR) of 8.74% from 2025 to 2033. This expansion is fueled by several key factors. Firstly, the rising prevalence of rosacea globally, particularly among individuals with fair skin and a family history of the condition, is driving demand for effective treatment options. Secondly, advancements in drug development, leading to the introduction of novel therapies targeting the underlying inflammatory mechanisms of rosacea, are significantly impacting market growth. The availability of more targeted treatments with improved efficacy and tolerability compared to older options contributes to increased patient adoption. Furthermore, heightened awareness among consumers regarding rosacea and its management, facilitated by increased online resources and dermatologist consultations, is leading to greater diagnosis rates and treatment initiation. The market's segmentation into drug classes (antibiotics, alpha agonists, retinoids, corticosteroids, immunosuppressants, and others) and modes of administration (topical and oral) reflects the varied treatment approaches and patient preferences. This diversification provides significant opportunities for pharmaceutical companies to cater to specific patient needs and preferences.
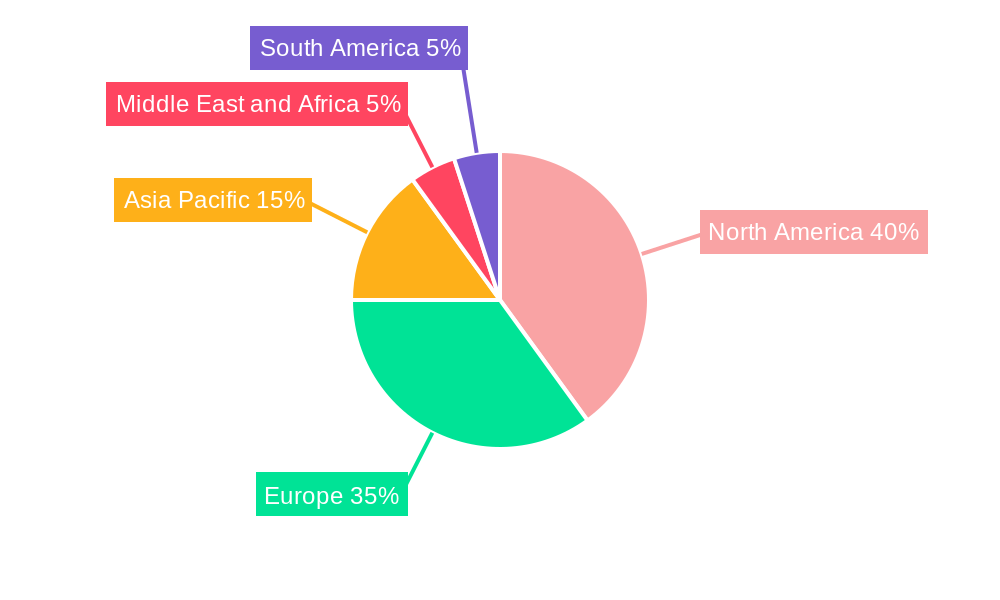
The competitive landscape is characterized by a mix of established pharmaceutical giants and emerging biotech companies, all vying for market share. Companies like Galderma, LEO Pharma, and Bausch Health Companies Inc. are leveraging their existing dermatology expertise and extensive distribution networks to maintain their leadership positions. Meanwhile, smaller, innovative companies are focusing on developing novel therapies to address unmet medical needs within the rosacea treatment landscape. Geographic variations in prevalence rates and healthcare infrastructure influence regional market growth. North America and Europe currently hold larger market shares due to higher awareness and greater access to advanced treatments, while the Asia-Pacific region is expected to experience significant growth in the coming years driven by increasing disposable incomes and rising healthcare spending. The market's future growth will be contingent upon the continued development of novel therapies, greater physician awareness, improved patient access to care, and sustained investment in research and development.
Rosacea Industry Market Report: 2019-2033
This comprehensive report provides an in-depth analysis of the Rosacea Industry, encompassing market dynamics, growth trends, competitive landscape, and future outlook. With a study period spanning 2019-2033, a base year of 2025, and a forecast period of 2025-2033, this report is an essential resource for industry professionals, investors, and researchers seeking to understand and capitalize on this growing market. The report analyzes the parent market of dermatological therapeutics and the child market of rosacea treatments, providing a granular view of segments by drug class and mode of administration. Market values are presented in millions of units.
Rosacea Industry Market Dynamics & Structure
The Rosacea Industry, a segment of the broader dermatological therapeutics market, exhibits a moderately concentrated structure with several key players vying for market share. Technological innovation, particularly in drug delivery systems and novel therapeutic agents, is a significant driver of growth. Stringent regulatory frameworks, such as those enforced by the FDA and EMA, shape product development and market entry. Competitive pressure stems from the availability of both prescription and over-the-counter (OTC) treatments, including alternative therapies. The end-user demographic primarily comprises adults, with a higher prevalence among women. Mergers and acquisitions (M&A) activity within the industry has been relatively moderate, with larger companies often acquiring smaller, innovative firms to bolster their product portfolios.
- Market Concentration: Moderately concentrated, with a top 5 players holding approximately xx% of the market share in 2024.
- Technological Innovation: Focus on improved drug delivery, targeted therapies, and combination treatments.
- Regulatory Landscape: Stringent approval processes influence timelines and market entry strategies.
- Competitive Substitutes: Presence of both prescription and OTC alternatives impacts market share.
- End-User Demographics: Primarily adults (age 30-60), with higher incidence in women.
- M&A Activity: Moderate level, driven by expansion into new therapeutic areas and technologies. xx M&A deals recorded between 2019-2024.
Rosacea Industry Growth Trends & Insights
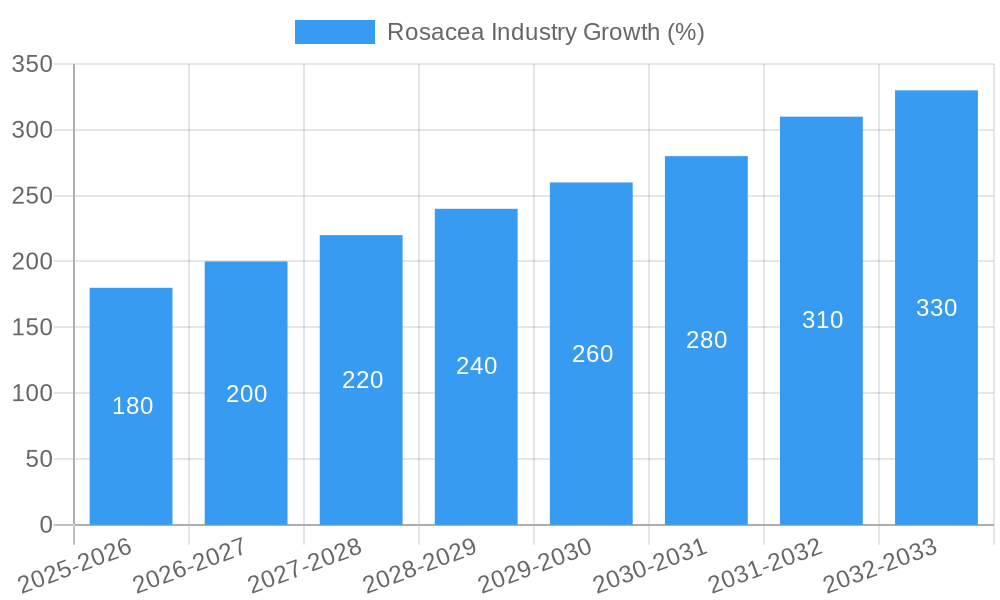
The Rosacea Industry has witnessed consistent growth over the historical period (2019-2024), driven by increasing prevalence of rosacea, rising healthcare expenditure, and growing awareness of treatment options. The market size is projected to expand significantly during the forecast period (2025-2033), with a compound annual growth rate (CAGR) of xx%. This growth is fueled by advancements in therapeutics, improved diagnostic tools, and enhanced patient access to treatment. Technological disruptions, such as the development of personalized medicine approaches and digital health solutions, are expected to further accelerate market expansion. Consumer behavior is shifting towards more convenient, effective, and cosmetically elegant treatment options, driving demand for innovative formulations and delivery systems.
Dominant Regions, Countries, or Segments in Rosacea Industry
North America currently holds the largest market share in the Rosacea Industry, driven by high prevalence rates, robust healthcare infrastructure, and increased awareness among consumers and healthcare providers. Within drug classes, Topical treatments dominate the market, holding approximately xx% of the share in 2024, followed by Oral medications. Antibiotics and Retinoids represent the most significant drug class segments. Europe is expected to show substantial growth due to increased healthcare spending and rising rosacea prevalence.
- Key Drivers: High prevalence rates, increasing healthcare spending, rising awareness, technological advancements.
- North America: Largest market share due to high prevalence and robust healthcare infrastructure.
- Europe: Significant growth potential due to rising prevalence and healthcare spending.
- Asia Pacific: Expanding market driven by increasing awareness and rising disposable incomes.
- Topical Administration: Largest segment by mode of administration.
- Antibiotics & Retinoids: Dominant drug classes due to established efficacy.
Rosacea Industry Product Landscape
The Rosacea Industry offers a diverse range of products, including topical creams, gels, lotions, and oral medications. Innovation focuses on enhancing efficacy, improving tolerability, and developing novel drug delivery systems to minimize side effects and improve patient compliance. Products are differentiated based on active ingredients, formulation characteristics, and targeted rosacea subtypes (e.g., erythematotelangiectatic, papulopustular). Unique selling propositions often center on improved efficacy, reduced side effects, and convenient application methods.
Key Drivers, Barriers & Challenges in Rosacea Industry
Key Drivers:
- Increasing prevalence of rosacea globally.
- Rising healthcare expenditure and insurance coverage for rosacea treatments.
- Growing awareness of rosacea and available treatment options.
- Technological advancements in drug development and delivery systems.
Challenges & Restraints:
- High cost of some treatments can limit access.
- Side effects associated with certain medications.
- Lack of awareness in some regions.
- Competition from generic and OTC products.
- Stringent regulatory requirements delaying product launches. Approvals can take xx months on average.
Emerging Opportunities in Rosacea Industry
- Development of personalized medicine approaches tailored to individual rosacea subtypes and patient characteristics.
- Expansion into untapped markets in developing countries with rising prevalence rates.
- Development of combination therapies targeting multiple rosacea symptoms.
- Increased focus on improving patient education and support.
- Exploration of new drug targets and mechanisms of action.
Growth Accelerators in the Rosacea Industry
Long-term growth will be propelled by continued technological advancements in drug development and delivery systems, as well as strategic partnerships between pharmaceutical companies and research institutions. Expansion into new markets, particularly in developing economies, will also be a significant driver of growth. The increasing integration of digital health technologies into rosacea management will further contribute to market expansion.
Key Players Shaping the Rosacea Industry Market
- Amorepacific Corporation
- Galderma
- Aclaris Therapeutics
- Tarsus Pharmaceuticals Inc
- LEO Pharma A/S
- Hovione FarmaCiencia SA
- Sol-Gel Technologies Ltd
- Journey Medical Corporation (Fortress Biotech Inc)
- Zydus Group
- Bausch Health Companies Inc
Notable Milestones in Rosacea Industry Sector
- June 2023: Sol-Gel Technologies, Ltd. and Searchlight Pharma Inc. signed an exclusive license agreement for TWYNEO and EPSOLAY for the Canadian market. EPSOLAY (benzoyl peroxide, 5% cream) treats inflammatory lesions of rosacea in adults. This significantly expands EPSOLAY's market reach.
- April 2023: Zydus Lifesciences received final approval from the U.S. FDA to manufacture and market Metronidazole Topical cream to treat rosacea in the U.S. market. This increases competition and provides patients with another treatment option.
In-Depth Rosacea Industry Market Outlook
The Rosacea Industry is poised for significant growth over the next decade, driven by a confluence of factors including increasing prevalence, technological innovation, and expanding market access. Strategic partnerships, focused R&D efforts, and the development of novel therapies will further enhance market potential. Companies strategically positioned to capitalize on these trends are well-placed to achieve substantial market share gains.
Rosacea Industry Segmentation
-
1. Drug Class
- 1.1. Antibiotics
- 1.2. Alpha Agonists
- 1.3. Retinoid
- 1.4. Corticosteroids
- 1.5. Immunosuppressants
- 1.6. Other Drug Classes
-
2. Mode of Administration
- 2.1. Topical
- 2.2. Oral
Rosacea Industry Segmentation By Geography
-
1. North America
- 1.1. United States
- 1.2. Canada
- 1.3. Mexico
-
2. Europe
- 2.1. Germany
- 2.2. United Kingdom
- 2.3. France
- 2.4. Italy
- 2.5. Spain
- 2.6. Rest of Europe
-
3. Asia Pacific
- 3.1. China
- 3.2. Japan
- 3.3. India
- 3.4. Australia
- 3.5. South Korea
- 3.6. Rest of Asia Pacific
-
4. Middle East and Africa
- 4.1. GCC
- 4.2. South Africa
- 4.3. Rest of Middle East and Africa
-
5. South America
- 5.1. Brazil
- 5.2. Argentina
- 5.3. Rest of South America
Rosacea Industry REPORT HIGHLIGHTS
| Aspects | Details |
|---|---|
| Study Period | 2019-2033 |
| Base Year | 2024 |
| Estimated Year | 2025 |
| Forecast Period | 2025-2033 |
| Historical Period | 2019-2024 |
| Growth Rate | CAGR of 8.74% from 2019-2033 |
| Segmentation |
|
Table of Contents
- 1. Introduction
- 1.1. Research Scope
- 1.2. Market Segmentation
- 1.3. Research Methodology
- 1.4. Definitions and Assumptions
- 2. Executive Summary
- 2.1. Introduction
- 3. Market Dynamics
- 3.1. Introduction
- 3.2. Market Drivers
- 3.2.1. Increasing Incidence and Prevalence of Rosacea; Increasing Inclination Toward Combination Products
- 3.3. Market Restrains
- 3.3.1. Increased Use of Generic Drugs
- 3.4. Market Trends
- 3.4.1. Antibiotics Segment is Expected to Have a Significant Market Share During the Forecast Period
- 4. Market Factor Analysis
- 4.1. Porters Five Forces
- 4.2. Supply/Value Chain
- 4.3. PESTEL analysis
- 4.4. Market Entropy
- 4.5. Patent/Trademark Analysis
- 5. Global Rosacea Industry Analysis, Insights and Forecast, 2019-2031
- 5.1. Market Analysis, Insights and Forecast - by Drug Class
- 5.1.1. Antibiotics
- 5.1.2. Alpha Agonists
- 5.1.3. Retinoid
- 5.1.4. Corticosteroids
- 5.1.5. Immunosuppressants
- 5.1.6. Other Drug Classes
- 5.2. Market Analysis, Insights and Forecast - by Mode of Administration
- 5.2.1. Topical
- 5.2.2. Oral
- 5.3. Market Analysis, Insights and Forecast - by Region
- 5.3.1. North America
- 5.3.2. Europe
- 5.3.3. Asia Pacific
- 5.3.4. Middle East and Africa
- 5.3.5. South America
- 5.1. Market Analysis, Insights and Forecast - by Drug Class
- 6. North America Rosacea Industry Analysis, Insights and Forecast, 2019-2031
- 6.1. Market Analysis, Insights and Forecast - by Drug Class
- 6.1.1. Antibiotics
- 6.1.2. Alpha Agonists
- 6.1.3. Retinoid
- 6.1.4. Corticosteroids
- 6.1.5. Immunosuppressants
- 6.1.6. Other Drug Classes
- 6.2. Market Analysis, Insights and Forecast - by Mode of Administration
- 6.2.1. Topical
- 6.2.2. Oral
- 6.1. Market Analysis, Insights and Forecast - by Drug Class
- 7. Europe Rosacea Industry Analysis, Insights and Forecast, 2019-2031
- 7.1. Market Analysis, Insights and Forecast - by Drug Class
- 7.1.1. Antibiotics
- 7.1.2. Alpha Agonists
- 7.1.3. Retinoid
- 7.1.4. Corticosteroids
- 7.1.5. Immunosuppressants
- 7.1.6. Other Drug Classes
- 7.2. Market Analysis, Insights and Forecast - by Mode of Administration
- 7.2.1. Topical
- 7.2.2. Oral
- 7.1. Market Analysis, Insights and Forecast - by Drug Class
- 8. Asia Pacific Rosacea Industry Analysis, Insights and Forecast, 2019-2031
- 8.1. Market Analysis, Insights and Forecast - by Drug Class
- 8.1.1. Antibiotics
- 8.1.2. Alpha Agonists
- 8.1.3. Retinoid
- 8.1.4. Corticosteroids
- 8.1.5. Immunosuppressants
- 8.1.6. Other Drug Classes
- 8.2. Market Analysis, Insights and Forecast - by Mode of Administration
- 8.2.1. Topical
- 8.2.2. Oral
- 8.1. Market Analysis, Insights and Forecast - by Drug Class
- 9. Middle East and Africa Rosacea Industry Analysis, Insights and Forecast, 2019-2031
- 9.1. Market Analysis, Insights and Forecast - by Drug Class
- 9.1.1. Antibiotics
- 9.1.2. Alpha Agonists
- 9.1.3. Retinoid
- 9.1.4. Corticosteroids
- 9.1.5. Immunosuppressants
- 9.1.6. Other Drug Classes
- 9.2. Market Analysis, Insights and Forecast - by Mode of Administration
- 9.2.1. Topical
- 9.2.2. Oral
- 9.1. Market Analysis, Insights and Forecast - by Drug Class
- 10. South America Rosacea Industry Analysis, Insights and Forecast, 2019-2031
- 10.1. Market Analysis, Insights and Forecast - by Drug Class
- 10.1.1. Antibiotics
- 10.1.2. Alpha Agonists
- 10.1.3. Retinoid
- 10.1.4. Corticosteroids
- 10.1.5. Immunosuppressants
- 10.1.6. Other Drug Classes
- 10.2. Market Analysis, Insights and Forecast - by Mode of Administration
- 10.2.1. Topical
- 10.2.2. Oral
- 10.1. Market Analysis, Insights and Forecast - by Drug Class
- 11. North America Rosacea Industry Analysis, Insights and Forecast, 2019-2031
- 11.1. Market Analysis, Insights and Forecast - By Country/Sub-region
- 11.1.1 United States
- 11.1.2 Canada
- 11.1.3 Mexico
- 12. Europe Rosacea Industry Analysis, Insights and Forecast, 2019-2031
- 12.1. Market Analysis, Insights and Forecast - By Country/Sub-region
- 12.1.1 Germany
- 12.1.2 United Kingdom
- 12.1.3 France
- 12.1.4 Italy
- 12.1.5 Spain
- 12.1.6 Rest of Europe
- 13. Asia Pacific Rosacea Industry Analysis, Insights and Forecast, 2019-2031
- 13.1. Market Analysis, Insights and Forecast - By Country/Sub-region
- 13.1.1 China
- 13.1.2 Japan
- 13.1.3 India
- 13.1.4 Australia
- 13.1.5 South Korea
- 13.1.6 Rest of Asia Pacific
- 14. Middle East and Africa Rosacea Industry Analysis, Insights and Forecast, 2019-2031
- 14.1. Market Analysis, Insights and Forecast - By Country/Sub-region
- 14.1.1 GCC
- 14.1.2 South Africa
- 14.1.3 Rest of Middle East and Africa
- 15. South America Rosacea Industry Analysis, Insights and Forecast, 2019-2031
- 15.1. Market Analysis, Insights and Forecast - By Country/Sub-region
- 15.1.1 Brazil
- 15.1.2 Argentina
- 15.1.3 Rest of South America
- 16. Competitive Analysis
- 16.1. Global Market Share Analysis 2024
- 16.2. Company Profiles
- 16.2.1 Amorepacific Corporation
- 16.2.1.1. Overview
- 16.2.1.2. Products
- 16.2.1.3. SWOT Analysis
- 16.2.1.4. Recent Developments
- 16.2.1.5. Financials (Based on Availability)
- 16.2.2 Galderma
- 16.2.2.1. Overview
- 16.2.2.2. Products
- 16.2.2.3. SWOT Analysis
- 16.2.2.4. Recent Developments
- 16.2.2.5. Financials (Based on Availability)
- 16.2.3 Aclaris Therapeutics
- 16.2.3.1. Overview
- 16.2.3.2. Products
- 16.2.3.3. SWOT Analysis
- 16.2.3.4. Recent Developments
- 16.2.3.5. Financials (Based on Availability)
- 16.2.4 Tarsus Pharmaceuticals Inc
- 16.2.4.1. Overview
- 16.2.4.2. Products
- 16.2.4.3. SWOT Analysis
- 16.2.4.4. Recent Developments
- 16.2.4.5. Financials (Based on Availability)
- 16.2.5 LEO Pharma A/S
- 16.2.5.1. Overview
- 16.2.5.2. Products
- 16.2.5.3. SWOT Analysis
- 16.2.5.4. Recent Developments
- 16.2.5.5. Financials (Based on Availability)
- 16.2.6 Hovione FarmaCiencia SA
- 16.2.6.1. Overview
- 16.2.6.2. Products
- 16.2.6.3. SWOT Analysis
- 16.2.6.4. Recent Developments
- 16.2.6.5. Financials (Based on Availability)
- 16.2.7 Sol-Gel Technologies Ltd *List Not Exhaustive
- 16.2.7.1. Overview
- 16.2.7.2. Products
- 16.2.7.3. SWOT Analysis
- 16.2.7.4. Recent Developments
- 16.2.7.5. Financials (Based on Availability)
- 16.2.8 Journey Medical Corporation (Fortress Biotech Inc )
- 16.2.8.1. Overview
- 16.2.8.2. Products
- 16.2.8.3. SWOT Analysis
- 16.2.8.4. Recent Developments
- 16.2.8.5. Financials (Based on Availability)
- 16.2.9 Zydus Group
- 16.2.9.1. Overview
- 16.2.9.2. Products
- 16.2.9.3. SWOT Analysis
- 16.2.9.4. Recent Developments
- 16.2.9.5. Financials (Based on Availability)
- 16.2.10 Bausch Health Companies Inc
- 16.2.10.1. Overview
- 16.2.10.2. Products
- 16.2.10.3. SWOT Analysis
- 16.2.10.4. Recent Developments
- 16.2.10.5. Financials (Based on Availability)
- 16.2.1 Amorepacific Corporation
List of Figures
- Figure 1: Global Rosacea Industry Revenue Breakdown (Million, %) by Region 2024 & 2032
- Figure 2: North America Rosacea Industry Revenue (Million), by Country 2024 & 2032
- Figure 3: North America Rosacea Industry Revenue Share (%), by Country 2024 & 2032
- Figure 4: Europe Rosacea Industry Revenue (Million), by Country 2024 & 2032
- Figure 5: Europe Rosacea Industry Revenue Share (%), by Country 2024 & 2032
- Figure 6: Asia Pacific Rosacea Industry Revenue (Million), by Country 2024 & 2032
- Figure 7: Asia Pacific Rosacea Industry Revenue Share (%), by Country 2024 & 2032
- Figure 8: Middle East and Africa Rosacea Industry Revenue (Million), by Country 2024 & 2032
- Figure 9: Middle East and Africa Rosacea Industry Revenue Share (%), by Country 2024 & 2032
- Figure 10: South America Rosacea Industry Revenue (Million), by Country 2024 & 2032
- Figure 11: South America Rosacea Industry Revenue Share (%), by Country 2024 & 2032
- Figure 12: North America Rosacea Industry Revenue (Million), by Drug Class 2024 & 2032
- Figure 13: North America Rosacea Industry Revenue Share (%), by Drug Class 2024 & 2032
- Figure 14: North America Rosacea Industry Revenue (Million), by Mode of Administration 2024 & 2032
- Figure 15: North America Rosacea Industry Revenue Share (%), by Mode of Administration 2024 & 2032
- Figure 16: North America Rosacea Industry Revenue (Million), by Country 2024 & 2032
- Figure 17: North America Rosacea Industry Revenue Share (%), by Country 2024 & 2032
- Figure 18: Europe Rosacea Industry Revenue (Million), by Drug Class 2024 & 2032
- Figure 19: Europe Rosacea Industry Revenue Share (%), by Drug Class 2024 & 2032
- Figure 20: Europe Rosacea Industry Revenue (Million), by Mode of Administration 2024 & 2032
- Figure 21: Europe Rosacea Industry Revenue Share (%), by Mode of Administration 2024 & 2032
- Figure 22: Europe Rosacea Industry Revenue (Million), by Country 2024 & 2032
- Figure 23: Europe Rosacea Industry Revenue Share (%), by Country 2024 & 2032
- Figure 24: Asia Pacific Rosacea Industry Revenue (Million), by Drug Class 2024 & 2032
- Figure 25: Asia Pacific Rosacea Industry Revenue Share (%), by Drug Class 2024 & 2032
- Figure 26: Asia Pacific Rosacea Industry Revenue (Million), by Mode of Administration 2024 & 2032
- Figure 27: Asia Pacific Rosacea Industry Revenue Share (%), by Mode of Administration 2024 & 2032
- Figure 28: Asia Pacific Rosacea Industry Revenue (Million), by Country 2024 & 2032
- Figure 29: Asia Pacific Rosacea Industry Revenue Share (%), by Country 2024 & 2032
- Figure 30: Middle East and Africa Rosacea Industry Revenue (Million), by Drug Class 2024 & 2032
- Figure 31: Middle East and Africa Rosacea Industry Revenue Share (%), by Drug Class 2024 & 2032
- Figure 32: Middle East and Africa Rosacea Industry Revenue (Million), by Mode of Administration 2024 & 2032
- Figure 33: Middle East and Africa Rosacea Industry Revenue Share (%), by Mode of Administration 2024 & 2032
- Figure 34: Middle East and Africa Rosacea Industry Revenue (Million), by Country 2024 & 2032
- Figure 35: Middle East and Africa Rosacea Industry Revenue Share (%), by Country 2024 & 2032
- Figure 36: South America Rosacea Industry Revenue (Million), by Drug Class 2024 & 2032
- Figure 37: South America Rosacea Industry Revenue Share (%), by Drug Class 2024 & 2032
- Figure 38: South America Rosacea Industry Revenue (Million), by Mode of Administration 2024 & 2032
- Figure 39: South America Rosacea Industry Revenue Share (%), by Mode of Administration 2024 & 2032
- Figure 40: South America Rosacea Industry Revenue (Million), by Country 2024 & 2032
- Figure 41: South America Rosacea Industry Revenue Share (%), by Country 2024 & 2032
List of Tables
- Table 1: Global Rosacea Industry Revenue Million Forecast, by Region 2019 & 2032
- Table 2: Global Rosacea Industry Revenue Million Forecast, by Drug Class 2019 & 2032
- Table 3: Global Rosacea Industry Revenue Million Forecast, by Mode of Administration 2019 & 2032
- Table 4: Global Rosacea Industry Revenue Million Forecast, by Region 2019 & 2032
- Table 5: Global Rosacea Industry Revenue Million Forecast, by Country 2019 & 2032
- Table 6: United States Rosacea Industry Revenue (Million) Forecast, by Application 2019 & 2032
- Table 7: Canada Rosacea Industry Revenue (Million) Forecast, by Application 2019 & 2032
- Table 8: Mexico Rosacea Industry Revenue (Million) Forecast, by Application 2019 & 2032
- Table 9: Global Rosacea Industry Revenue Million Forecast, by Country 2019 & 2032
- Table 10: Germany Rosacea Industry Revenue (Million) Forecast, by Application 2019 & 2032
- Table 11: United Kingdom Rosacea Industry Revenue (Million) Forecast, by Application 2019 & 2032
- Table 12: France Rosacea Industry Revenue (Million) Forecast, by Application 2019 & 2032
- Table 13: Italy Rosacea Industry Revenue (Million) Forecast, by Application 2019 & 2032
- Table 14: Spain Rosacea Industry Revenue (Million) Forecast, by Application 2019 & 2032
- Table 15: Rest of Europe Rosacea Industry Revenue (Million) Forecast, by Application 2019 & 2032
- Table 16: Global Rosacea Industry Revenue Million Forecast, by Country 2019 & 2032
- Table 17: China Rosacea Industry Revenue (Million) Forecast, by Application 2019 & 2032
- Table 18: Japan Rosacea Industry Revenue (Million) Forecast, by Application 2019 & 2032
- Table 19: India Rosacea Industry Revenue (Million) Forecast, by Application 2019 & 2032
- Table 20: Australia Rosacea Industry Revenue (Million) Forecast, by Application 2019 & 2032
- Table 21: South Korea Rosacea Industry Revenue (Million) Forecast, by Application 2019 & 2032
- Table 22: Rest of Asia Pacific Rosacea Industry Revenue (Million) Forecast, by Application 2019 & 2032
- Table 23: Global Rosacea Industry Revenue Million Forecast, by Country 2019 & 2032
- Table 24: GCC Rosacea Industry Revenue (Million) Forecast, by Application 2019 & 2032
- Table 25: South Africa Rosacea Industry Revenue (Million) Forecast, by Application 2019 & 2032
- Table 26: Rest of Middle East and Africa Rosacea Industry Revenue (Million) Forecast, by Application 2019 & 2032
- Table 27: Global Rosacea Industry Revenue Million Forecast, by Country 2019 & 2032
- Table 28: Brazil Rosacea Industry Revenue (Million) Forecast, by Application 2019 & 2032
- Table 29: Argentina Rosacea Industry Revenue (Million) Forecast, by Application 2019 & 2032
- Table 30: Rest of South America Rosacea Industry Revenue (Million) Forecast, by Application 2019 & 2032
- Table 31: Global Rosacea Industry Revenue Million Forecast, by Drug Class 2019 & 2032
- Table 32: Global Rosacea Industry Revenue Million Forecast, by Mode of Administration 2019 & 2032
- Table 33: Global Rosacea Industry Revenue Million Forecast, by Country 2019 & 2032
- Table 34: United States Rosacea Industry Revenue (Million) Forecast, by Application 2019 & 2032
- Table 35: Canada Rosacea Industry Revenue (Million) Forecast, by Application 2019 & 2032
- Table 36: Mexico Rosacea Industry Revenue (Million) Forecast, by Application 2019 & 2032
- Table 37: Global Rosacea Industry Revenue Million Forecast, by Drug Class 2019 & 2032
- Table 38: Global Rosacea Industry Revenue Million Forecast, by Mode of Administration 2019 & 2032
- Table 39: Global Rosacea Industry Revenue Million Forecast, by Country 2019 & 2032
- Table 40: Germany Rosacea Industry Revenue (Million) Forecast, by Application 2019 & 2032
- Table 41: United Kingdom Rosacea Industry Revenue (Million) Forecast, by Application 2019 & 2032
- Table 42: France Rosacea Industry Revenue (Million) Forecast, by Application 2019 & 2032
- Table 43: Italy Rosacea Industry Revenue (Million) Forecast, by Application 2019 & 2032
- Table 44: Spain Rosacea Industry Revenue (Million) Forecast, by Application 2019 & 2032
- Table 45: Rest of Europe Rosacea Industry Revenue (Million) Forecast, by Application 2019 & 2032
- Table 46: Global Rosacea Industry Revenue Million Forecast, by Drug Class 2019 & 2032
- Table 47: Global Rosacea Industry Revenue Million Forecast, by Mode of Administration 2019 & 2032
- Table 48: Global Rosacea Industry Revenue Million Forecast, by Country 2019 & 2032
- Table 49: China Rosacea Industry Revenue (Million) Forecast, by Application 2019 & 2032
- Table 50: Japan Rosacea Industry Revenue (Million) Forecast, by Application 2019 & 2032
- Table 51: India Rosacea Industry Revenue (Million) Forecast, by Application 2019 & 2032
- Table 52: Australia Rosacea Industry Revenue (Million) Forecast, by Application 2019 & 2032
- Table 53: South Korea Rosacea Industry Revenue (Million) Forecast, by Application 2019 & 2032
- Table 54: Rest of Asia Pacific Rosacea Industry Revenue (Million) Forecast, by Application 2019 & 2032
- Table 55: Global Rosacea Industry Revenue Million Forecast, by Drug Class 2019 & 2032
- Table 56: Global Rosacea Industry Revenue Million Forecast, by Mode of Administration 2019 & 2032
- Table 57: Global Rosacea Industry Revenue Million Forecast, by Country 2019 & 2032
- Table 58: GCC Rosacea Industry Revenue (Million) Forecast, by Application 2019 & 2032
- Table 59: South Africa Rosacea Industry Revenue (Million) Forecast, by Application 2019 & 2032
- Table 60: Rest of Middle East and Africa Rosacea Industry Revenue (Million) Forecast, by Application 2019 & 2032
- Table 61: Global Rosacea Industry Revenue Million Forecast, by Drug Class 2019 & 2032
- Table 62: Global Rosacea Industry Revenue Million Forecast, by Mode of Administration 2019 & 2032
- Table 63: Global Rosacea Industry Revenue Million Forecast, by Country 2019 & 2032
- Table 64: Brazil Rosacea Industry Revenue (Million) Forecast, by Application 2019 & 2032
- Table 65: Argentina Rosacea Industry Revenue (Million) Forecast, by Application 2019 & 2032
- Table 66: Rest of South America Rosacea Industry Revenue (Million) Forecast, by Application 2019 & 2032
Frequently Asked Questions
1. What is the projected Compound Annual Growth Rate (CAGR) of the Rosacea Industry?
The projected CAGR is approximately 8.74%.
2. Which companies are prominent players in the Rosacea Industry?
Key companies in the market include Amorepacific Corporation, Galderma, Aclaris Therapeutics, Tarsus Pharmaceuticals Inc, LEO Pharma A/S, Hovione FarmaCiencia SA, Sol-Gel Technologies Ltd *List Not Exhaustive, Journey Medical Corporation (Fortress Biotech Inc ), Zydus Group, Bausch Health Companies Inc.
3. What are the main segments of the Rosacea Industry?
The market segments include Drug Class, Mode of Administration.
4. Can you provide details about the market size?
The market size is estimated to be USD 2.09 Million as of 2022.
5. What are some drivers contributing to market growth?
Increasing Incidence and Prevalence of Rosacea; Increasing Inclination Toward Combination Products.
6. What are the notable trends driving market growth?
Antibiotics Segment is Expected to Have a Significant Market Share During the Forecast Period.
7. Are there any restraints impacting market growth?
Increased Use of Generic Drugs.
8. Can you provide examples of recent developments in the market?
June 2023: Sol-Gel Technologies, Ltd. and Searchlight Pharma Inc. signed an exclusive license agreement for TWYNEO and EPSOLAY for the Canadian market. EPSOLAY (benzoyl peroxide, 5% cream) treats inflammatory lesions of rosacea in adults.
9. What pricing options are available for accessing the report?
Pricing options include single-user, multi-user, and enterprise licenses priced at USD 4750, USD 5250, and USD 8750 respectively.
10. Is the market size provided in terms of value or volume?
The market size is provided in terms of value, measured in Million.
11. Are there any specific market keywords associated with the report?
Yes, the market keyword associated with the report is "Rosacea Industry," which aids in identifying and referencing the specific market segment covered.
12. How do I determine which pricing option suits my needs best?
The pricing options vary based on user requirements and access needs. Individual users may opt for single-user licenses, while businesses requiring broader access may choose multi-user or enterprise licenses for cost-effective access to the report.
13. Are there any additional resources or data provided in the Rosacea Industry report?
While the report offers comprehensive insights, it's advisable to review the specific contents or supplementary materials provided to ascertain if additional resources or data are available.
14. How can I stay updated on further developments or reports in the Rosacea Industry?
To stay informed about further developments, trends, and reports in the Rosacea Industry, consider subscribing to industry newsletters, following relevant companies and organizations, or regularly checking reputable industry news sources and publications.
Methodology
Step 1 - Identification of Relevant Samples Size from Population Database


Step 2 - Approaches for Defining Global Market Size (Value, Volume* & Price*)

Note*: In applicable scenarios
Step 3 - Data Sources
Primary Research
- Web Analytics
- Survey Reports
- Research Institute
- Latest Research Reports
- Opinion Leaders
Secondary Research
- Annual Reports
- White Paper
- Latest Press Release
- Industry Association
- Paid Database
- Investor Presentations

Step 4 - Data Triangulation
Involves using different sources of information in order to increase the validity of a study
These sources are likely to be stakeholders in a program - participants, other researchers, program staff, other community members, and so on.
Then we put all data in single framework & apply various statistical tools to find out the dynamic on the market.
During the analysis stage, feedback from the stakeholder groups would be compared to determine areas of agreement as well as areas of divergence
