

Key Insights
The ready-to-drink (RTD) protein market is experiencing robust growth, projected to reach $1.68 billion in 2025 and maintain a Compound Annual Growth Rate (CAGR) of 7.72% from 2025 to 2033. This expansion is fueled by several key drivers. The increasing health consciousness among consumers, coupled with the convenience of RTD protein products, is a major catalyst. Busy lifestyles and the demand for quick and easy ways to supplement protein intake are also significantly contributing to market growth. Furthermore, the diversification of product offerings, including flavors, formulations (e.g., plant-based, dairy-based), and functional benefits (e.g., added vitamins, minerals), cater to a wider consumer base and fuel market expansion. Innovation in packaging and distribution channels, such as online platforms and strategic partnerships with retailers, enhances accessibility and convenience. While pricing and potential health concerns related to excessive protein intake could pose some restraints, the overall market outlook remains positive.
The competitive landscape is characterized by a mix of established players like Kellogg Company, PepsiCo Inc., and Glanbia PLC, alongside emerging brands such as Koia and Pure Protein. These companies are actively engaged in strategies such as product innovation, brand building, and strategic acquisitions to maintain their market positions and capitalize on the growing market demand. Regional variations in market penetration exist, with North America and Europe likely holding substantial shares, though specific regional data needs further investigation. The forecast period (2025-2033) promises continued expansion driven by ongoing health and wellness trends and the evolving preferences of health-conscious consumers. The market is expected to benefit from the increasing integration of protein into everyday diets, demonstrating significant potential for further growth and market penetration.

Ready-to-Drink (RTD) Protein Industry Market Report: 2019-2033
This comprehensive report provides a detailed analysis of the Ready-to-Drink (RTD) Protein industry, encompassing market dynamics, growth trends, regional performance, competitive landscape, and future outlook. The study covers the period from 2019 to 2033, with 2025 serving as the base year and the forecast period extending from 2025 to 2033. The report leverages extensive data and expert insights to offer valuable strategic guidance for industry stakeholders. The parent market is the broader beverage industry, while the child market focuses specifically on the protein-enhanced ready-to-drink segment. Market values are presented in million units.
RTD Protein Industry Market Dynamics & Structure
This section analyzes the RTD protein market's structure, focusing on market concentration, technological innovation, regulatory environments, competitive substitutes, end-user demographics, and merger & acquisition (M&A) activity. The market is characterized by a moderate level of concentration, with key players holding significant market share, but also experiencing increased competition from smaller, niche players. Technological innovation is a key driver, with advancements in protein extraction, formulation, and packaging impacting product quality and shelf life. Regulatory frameworks vary across regions, influencing product labeling and ingredient approvals. Competitive substitutes include traditional protein sources (e.g., protein powder) and other functional beverages. End-user demographics are largely health-conscious consumers, including athletes, fitness enthusiasts, and individuals seeking convenient protein sources. M&A activity has been moderate, primarily focused on expansion and diversification within the industry.
- Market Concentration: Moderately concentrated; top 5 players hold approximately xx% of market share in 2024.
- Technological Innovation: Focus on improved taste, extended shelf life, and sustainable packaging.
- Regulatory Framework: Varies by region, impacting ingredient approvals and labeling requirements.
- Competitive Substitutes: Protein powders, traditional dairy products, other functional beverages.
- End-User Demographics: Health-conscious consumers, athletes, and busy professionals.
- M&A Activity: Moderate activity, with xx deals recorded between 2019 and 2024.
RTD Protein Industry Growth Trends & Insights
The RTD protein market has experienced significant growth during the historical period (2019-2024), driven by increasing consumer demand for convenient and healthy protein sources. The market is projected to maintain a strong growth trajectory during the forecast period (2025-2033), with a Compound Annual Growth Rate (CAGR) of xx%. This growth is fueled by several factors, including rising health consciousness, increasing disposable incomes, and the expansion of distribution channels. Technological innovations, such as the development of novel protein sources and improved formulations, further contribute to market expansion. Consumer behavior shifts towards healthier lifestyles and increased awareness of the benefits of protein intake support this trend. Market penetration remains relatively high in developed countries, while significant growth potential exists in emerging markets.

Dominant Regions, Countries, or Segments in RTD Protein Industry
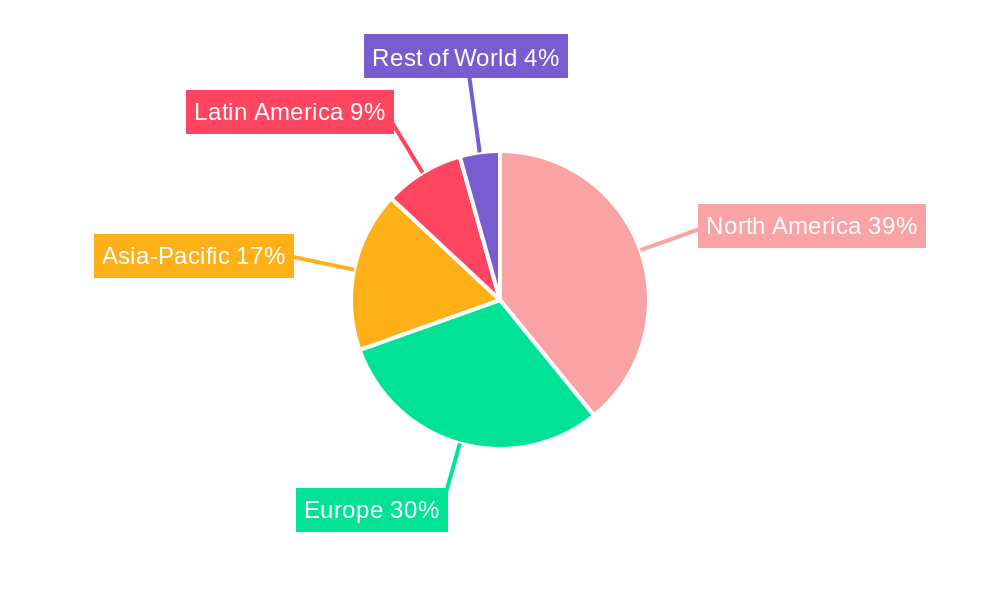
North America currently dominates the RTD protein market, driven by high consumer awareness of health and wellness, coupled with established distribution networks and strong product innovation. Europe follows as a significant market, while Asia-Pacific is experiencing rapid growth due to rising disposable incomes and increasing health consciousness. Within segments, dairy-based RTD protein dominates, though plant-based alternatives are gaining traction.
- Key Drivers in North America: High health consciousness, robust distribution networks, strong product innovation.
- Key Drivers in Europe: Growing demand for convenient protein sources, increasing health awareness among consumers.
- Key Drivers in Asia-Pacific: Rising disposable incomes, expanding middle class, increasing health consciousness.
- Dominant Segment: Dairy-based RTD protein; Plant-based is a rapidly growing segment.
RTD Protein Industry Product Landscape
The RTD protein product landscape is diverse, encompassing various formulations, flavors, and functionalities. Innovations focus on improving taste and texture, enhancing shelf life, and incorporating additional functional ingredients such as vitamins, minerals, and probiotics. Key performance metrics include protein content, amino acid profile, and overall nutritional value. Unique selling propositions often center around convenience, taste, and specific health benefits. Technological advancements are focused on utilizing sustainable ingredients and reducing environmental impact.
Key Drivers, Barriers & Challenges in RTD Protein Industry
Key Drivers:
- Growing health consciousness and demand for convenient protein sources.
- Rising disposable incomes in developing economies.
- Expansion of e-commerce and online retail channels.
- Technological advancements improving product taste, texture, and shelf life.
Challenges & Restraints:
- Price sensitivity among consumers, especially in price-sensitive markets.
- Stringent regulatory requirements regarding labeling and ingredient approvals.
- Intense competition among established and emerging players.
- Supply chain disruptions and fluctuations in raw material prices. These factors have impacted the market by xx% in 2024.
Emerging Opportunities in RTD Protein Industry
- Expansion into untapped markets, particularly in developing economies.
- Development of novel protein sources, such as insect protein or single-cell protein.
- Growing interest in personalized nutrition and customized protein formulations.
- Increased demand for functional protein drinks catering to specific health needs.
Growth Accelerators in the RTD Protein Industry
Technological breakthroughs in protein extraction, formulation, and packaging, strategic partnerships and collaborations between established players and emerging companies and expansion into new geographical markets will drive future growth in the RTD protein industry. These factors will lead to wider accessibility and affordability, further propelling market expansion.
Key Players Shaping the RTD Protein Industry Market
- Kellogg Company
- Glanbia PLC
- PepsiCo Inc
- Halen Brands
- Post Holdings Inc
- Koia
- Abbott Nutrition
- Labrada Nutrition
- The Coca Cola Company
- Pure Protein
Notable Milestones in RTD Protein Industry Sector
- May 2021: PepsiCo's Naked brand launched Indulgent Protein smoothies.
- February 2021: Koia achieved national distribution in 7-Eleven stores.
- February 2022: Optimum Nutrition launched a new RTD protein supplement in the UK.
- March 2022: QNT SA partnered with Qimia Makmal Arad Company for distribution in Iran.
In-Depth RTD Protein Industry Market Outlook
The future of the RTD protein market is bright, driven by sustained growth in health consciousness and the continuous innovation of convenient and appealing protein products. Strategic partnerships, targeted marketing campaigns, and expansion into new geographic regions will be crucial to capturing future market opportunities. The market is poised for significant expansion, presenting attractive opportunities for both established and emerging players.
RTD Protein Industry Segmentation
-
1. Source
- 1.1. Whey
- 1.2. Casein
- 1.3. Soy
- 1.4. Other Sources
-
2. Type of Packaging
- 2.1. Bottles
- 2.2. Cans
- 2.3. Others
-
3. Distribution Channel
- 3.1. Supermarkets/Hypermarkets
- 3.2. Pharmacies/Drugstores
- 3.3. Specialist Retailers
- 3.4. Online Retail
- 3.5. Other Channels
RTD Protein Industry Segmentation By Geography
-
1. North America
- 1.1. United States
- 1.2. Canada
- 1.3. Mexico
- 1.4. Rest of North America
-
2. Europe
- 2.1. Germany
- 2.2. United Kingdom
- 2.3. France
- 2.4. Spain
- 2.5. Italy
- 2.6. Russia
- 2.7. Rest of Europe
-
3. Asia Pacific
- 3.1. China
- 3.2. Japan
- 3.3. India
- 3.4. Australia
- 3.5. Rest of Asia Pacific
-
4. South America
- 4.1. Brazil
- 4.2. Argentina
- 4.3. Rest of South America
-
5. Middle East and Africa
- 5.1. South Africa
- 5.2. United Arab Emirates
- 5.3. Rest of Middle East and Africa
RTD Protein Industry REPORT HIGHLIGHTS
| Aspects | Details |
|---|---|
| Study Period | 2019-2033 |
| Base Year | 2024 |
| Estimated Year | 2025 |
| Forecast Period | 2025-2033 |
| Historical Period | 2019-2024 |
| Growth Rate | CAGR of 7.72% from 2019-2033 |
| Segmentation |
|
Table of Contents
- 1. Introduction
- 1.1. Research Scope
- 1.2. Market Segmentation
- 1.3. Research Methodology
- 1.4. Definitions and Assumptions
- 2. Executive Summary
- 2.1. Introduction
- 3. Market Dynamics
- 3.1. Introduction
- 3.2. Market Drivers
- 3.3. Market Restrains
- 3.4. Market Trends
- 3.4.1. Strong Demand from Health Conscious Consumers
- 4. Market Factor Analysis
- 4.1. Porters Five Forces
- 4.2. Supply/Value Chain
- 4.3. PESTEL analysis
- 4.4. Market Entropy
- 4.5. Patent/Trademark Analysis
- 5. Global RTD Protein Industry Analysis, Insights and Forecast, 2019-2031
- 5.1. Market Analysis, Insights and Forecast - by Source
- 5.1.1. Whey
- 5.1.2. Casein
- 5.1.3. Soy
- 5.1.4. Other Sources
- 5.2. Market Analysis, Insights and Forecast - by Type of Packaging
- 5.2.1. Bottles
- 5.2.2. Cans
- 5.2.3. Others
- 5.3. Market Analysis, Insights and Forecast - by Distribution Channel
- 5.3.1. Supermarkets/Hypermarkets
- 5.3.2. Pharmacies/Drugstores
- 5.3.3. Specialist Retailers
- 5.3.4. Online Retail
- 5.3.5. Other Channels
- 5.4. Market Analysis, Insights and Forecast - by Region
- 5.4.1. North America
- 5.4.2. Europe
- 5.4.3. Asia Pacific
- 5.4.4. South America
- 5.4.5. Middle East and Africa
- 5.1. Market Analysis, Insights and Forecast - by Source
- 6. North America RTD Protein Industry Analysis, Insights and Forecast, 2019-2031
- 6.1. Market Analysis, Insights and Forecast - by Source
- 6.1.1. Whey
- 6.1.2. Casein
- 6.1.3. Soy
- 6.1.4. Other Sources
- 6.2. Market Analysis, Insights and Forecast - by Type of Packaging
- 6.2.1. Bottles
- 6.2.2. Cans
- 6.2.3. Others
- 6.3. Market Analysis, Insights and Forecast - by Distribution Channel
- 6.3.1. Supermarkets/Hypermarkets
- 6.3.2. Pharmacies/Drugstores
- 6.3.3. Specialist Retailers
- 6.3.4. Online Retail
- 6.3.5. Other Channels
- 6.1. Market Analysis, Insights and Forecast - by Source
- 7. Europe RTD Protein Industry Analysis, Insights and Forecast, 2019-2031
- 7.1. Market Analysis, Insights and Forecast - by Source
- 7.1.1. Whey
- 7.1.2. Casein
- 7.1.3. Soy
- 7.1.4. Other Sources
- 7.2. Market Analysis, Insights and Forecast - by Type of Packaging
- 7.2.1. Bottles
- 7.2.2. Cans
- 7.2.3. Others
- 7.3. Market Analysis, Insights and Forecast - by Distribution Channel
- 7.3.1. Supermarkets/Hypermarkets
- 7.3.2. Pharmacies/Drugstores
- 7.3.3. Specialist Retailers
- 7.3.4. Online Retail
- 7.3.5. Other Channels
- 7.1. Market Analysis, Insights and Forecast - by Source
- 8. Asia Pacific RTD Protein Industry Analysis, Insights and Forecast, 2019-2031
- 8.1. Market Analysis, Insights and Forecast - by Source
- 8.1.1. Whey
- 8.1.2. Casein
- 8.1.3. Soy
- 8.1.4. Other Sources
- 8.2. Market Analysis, Insights and Forecast - by Type of Packaging
- 8.2.1. Bottles
- 8.2.2. Cans
- 8.2.3. Others
- 8.3. Market Analysis, Insights and Forecast - by Distribution Channel
- 8.3.1. Supermarkets/Hypermarkets
- 8.3.2. Pharmacies/Drugstores
- 8.3.3. Specialist Retailers
- 8.3.4. Online Retail
- 8.3.5. Other Channels
- 8.1. Market Analysis, Insights and Forecast - by Source
- 9. South America RTD Protein Industry Analysis, Insights and Forecast, 2019-2031
- 9.1. Market Analysis, Insights and Forecast - by Source
- 9.1.1. Whey
- 9.1.2. Casein
- 9.1.3. Soy
- 9.1.4. Other Sources
- 9.2. Market Analysis, Insights and Forecast - by Type of Packaging
- 9.2.1. Bottles
- 9.2.2. Cans
- 9.2.3. Others
- 9.3. Market Analysis, Insights and Forecast - by Distribution Channel
- 9.3.1. Supermarkets/Hypermarkets
- 9.3.2. Pharmacies/Drugstores
- 9.3.3. Specialist Retailers
- 9.3.4. Online Retail
- 9.3.5. Other Channels
- 9.1. Market Analysis, Insights and Forecast - by Source
- 10. Middle East and Africa RTD Protein Industry Analysis, Insights and Forecast, 2019-2031
- 10.1. Market Analysis, Insights and Forecast - by Source
- 10.1.1. Whey
- 10.1.2. Casein
- 10.1.3. Soy
- 10.1.4. Other Sources
- 10.2. Market Analysis, Insights and Forecast - by Type of Packaging
- 10.2.1. Bottles
- 10.2.2. Cans
- 10.2.3. Others
- 10.3. Market Analysis, Insights and Forecast - by Distribution Channel
- 10.3.1. Supermarkets/Hypermarkets
- 10.3.2. Pharmacies/Drugstores
- 10.3.3. Specialist Retailers
- 10.3.4. Online Retail
- 10.3.5. Other Channels
- 10.1. Market Analysis, Insights and Forecast - by Source
- 11. Competitive Analysis
- 11.1. Global Market Share Analysis 2024
- 11.2. Company Profiles
- 11.2.1 Kellogg Company
- 11.2.1.1. Overview
- 11.2.1.2. Products
- 11.2.1.3. SWOT Analysis
- 11.2.1.4. Recent Developments
- 11.2.1.5. Financials (Based on Availability)
- 11.2.2 Glanbia PLC
- 11.2.2.1. Overview
- 11.2.2.2. Products
- 11.2.2.3. SWOT Analysis
- 11.2.2.4. Recent Developments
- 11.2.2.5. Financials (Based on Availability)
- 11.2.3 PepsiCo Inc
- 11.2.3.1. Overview
- 11.2.3.2. Products
- 11.2.3.3. SWOT Analysis
- 11.2.3.4. Recent Developments
- 11.2.3.5. Financials (Based on Availability)
- 11.2.4 Halen Brands
- 11.2.4.1. Overview
- 11.2.4.2. Products
- 11.2.4.3. SWOT Analysis
- 11.2.4.4. Recent Developments
- 11.2.4.5. Financials (Based on Availability)
- 11.2.5 Post Holdings Inc
- 11.2.5.1. Overview
- 11.2.5.2. Products
- 11.2.5.3. SWOT Analysis
- 11.2.5.4. Recent Developments
- 11.2.5.5. Financials (Based on Availability)
- 11.2.6 Koia
- 11.2.6.1. Overview
- 11.2.6.2. Products
- 11.2.6.3. SWOT Analysis
- 11.2.6.4. Recent Developments
- 11.2.6.5. Financials (Based on Availability)
- 11.2.7 Abbott Nutrition
- 11.2.7.1. Overview
- 11.2.7.2. Products
- 11.2.7.3. SWOT Analysis
- 11.2.7.4. Recent Developments
- 11.2.7.5. Financials (Based on Availability)
- 11.2.8 Labrada Nutrition
- 11.2.8.1. Overview
- 11.2.8.2. Products
- 11.2.8.3. SWOT Analysis
- 11.2.8.4. Recent Developments
- 11.2.8.5. Financials (Based on Availability)
- 11.2.9 The Coca Cola Company
- 11.2.9.1. Overview
- 11.2.9.2. Products
- 11.2.9.3. SWOT Analysis
- 11.2.9.4. Recent Developments
- 11.2.9.5. Financials (Based on Availability)
- 11.2.10 Pure Protein*List Not Exhaustive
- 11.2.10.1. Overview
- 11.2.10.2. Products
- 11.2.10.3. SWOT Analysis
- 11.2.10.4. Recent Developments
- 11.2.10.5. Financials (Based on Availability)
- 11.2.1 Kellogg Company
List of Figures
- Figure 1: Global RTD Protein Industry Revenue Breakdown (Million, %) by Region 2024 & 2032
- Figure 2: Global RTD Protein Industry Volume Breakdown (Billion, %) by Region 2024 & 2032
- Figure 3: North America RTD Protein Industry Revenue (Million), by Source 2024 & 2032
- Figure 4: North America RTD Protein Industry Volume (Billion), by Source 2024 & 2032
- Figure 5: North America RTD Protein Industry Revenue Share (%), by Source 2024 & 2032
- Figure 6: North America RTD Protein Industry Volume Share (%), by Source 2024 & 2032
- Figure 7: North America RTD Protein Industry Revenue (Million), by Type of Packaging 2024 & 2032
- Figure 8: North America RTD Protein Industry Volume (Billion), by Type of Packaging 2024 & 2032
- Figure 9: North America RTD Protein Industry Revenue Share (%), by Type of Packaging 2024 & 2032
- Figure 10: North America RTD Protein Industry Volume Share (%), by Type of Packaging 2024 & 2032
- Figure 11: North America RTD Protein Industry Revenue (Million), by Distribution Channel 2024 & 2032
- Figure 12: North America RTD Protein Industry Volume (Billion), by Distribution Channel 2024 & 2032
- Figure 13: North America RTD Protein Industry Revenue Share (%), by Distribution Channel 2024 & 2032
- Figure 14: North America RTD Protein Industry Volume Share (%), by Distribution Channel 2024 & 2032
- Figure 15: North America RTD Protein Industry Revenue (Million), by Country 2024 & 2032
- Figure 16: North America RTD Protein Industry Volume (Billion), by Country 2024 & 2032
- Figure 17: North America RTD Protein Industry Revenue Share (%), by Country 2024 & 2032
- Figure 18: North America RTD Protein Industry Volume Share (%), by Country 2024 & 2032
- Figure 19: Europe RTD Protein Industry Revenue (Million), by Source 2024 & 2032
- Figure 20: Europe RTD Protein Industry Volume (Billion), by Source 2024 & 2032
- Figure 21: Europe RTD Protein Industry Revenue Share (%), by Source 2024 & 2032
- Figure 22: Europe RTD Protein Industry Volume Share (%), by Source 2024 & 2032
- Figure 23: Europe RTD Protein Industry Revenue (Million), by Type of Packaging 2024 & 2032
- Figure 24: Europe RTD Protein Industry Volume (Billion), by Type of Packaging 2024 & 2032
- Figure 25: Europe RTD Protein Industry Revenue Share (%), by Type of Packaging 2024 & 2032
- Figure 26: Europe RTD Protein Industry Volume Share (%), by Type of Packaging 2024 & 2032
- Figure 27: Europe RTD Protein Industry Revenue (Million), by Distribution Channel 2024 & 2032
- Figure 28: Europe RTD Protein Industry Volume (Billion), by Distribution Channel 2024 & 2032
- Figure 29: Europe RTD Protein Industry Revenue Share (%), by Distribution Channel 2024 & 2032
- Figure 30: Europe RTD Protein Industry Volume Share (%), by Distribution Channel 2024 & 2032
- Figure 31: Europe RTD Protein Industry Revenue (Million), by Country 2024 & 2032
- Figure 32: Europe RTD Protein Industry Volume (Billion), by Country 2024 & 2032
- Figure 33: Europe RTD Protein Industry Revenue Share (%), by Country 2024 & 2032
- Figure 34: Europe RTD Protein Industry Volume Share (%), by Country 2024 & 2032
- Figure 35: Asia Pacific RTD Protein Industry Revenue (Million), by Source 2024 & 2032
- Figure 36: Asia Pacific RTD Protein Industry Volume (Billion), by Source 2024 & 2032
- Figure 37: Asia Pacific RTD Protein Industry Revenue Share (%), by Source 2024 & 2032
- Figure 38: Asia Pacific RTD Protein Industry Volume Share (%), by Source 2024 & 2032
- Figure 39: Asia Pacific RTD Protein Industry Revenue (Million), by Type of Packaging 2024 & 2032
- Figure 40: Asia Pacific RTD Protein Industry Volume (Billion), by Type of Packaging 2024 & 2032
- Figure 41: Asia Pacific RTD Protein Industry Revenue Share (%), by Type of Packaging 2024 & 2032
- Figure 42: Asia Pacific RTD Protein Industry Volume Share (%), by Type of Packaging 2024 & 2032
- Figure 43: Asia Pacific RTD Protein Industry Revenue (Million), by Distribution Channel 2024 & 2032
- Figure 44: Asia Pacific RTD Protein Industry Volume (Billion), by Distribution Channel 2024 & 2032
- Figure 45: Asia Pacific RTD Protein Industry Revenue Share (%), by Distribution Channel 2024 & 2032
- Figure 46: Asia Pacific RTD Protein Industry Volume Share (%), by Distribution Channel 2024 & 2032
- Figure 47: Asia Pacific RTD Protein Industry Revenue (Million), by Country 2024 & 2032
- Figure 48: Asia Pacific RTD Protein Industry Volume (Billion), by Country 2024 & 2032
- Figure 49: Asia Pacific RTD Protein Industry Revenue Share (%), by Country 2024 & 2032
- Figure 50: Asia Pacific RTD Protein Industry Volume Share (%), by Country 2024 & 2032
- Figure 51: South America RTD Protein Industry Revenue (Million), by Source 2024 & 2032
- Figure 52: South America RTD Protein Industry Volume (Billion), by Source 2024 & 2032
- Figure 53: South America RTD Protein Industry Revenue Share (%), by Source 2024 & 2032
- Figure 54: South America RTD Protein Industry Volume Share (%), by Source 2024 & 2032
- Figure 55: South America RTD Protein Industry Revenue (Million), by Type of Packaging 2024 & 2032
- Figure 56: South America RTD Protein Industry Volume (Billion), by Type of Packaging 2024 & 2032
- Figure 57: South America RTD Protein Industry Revenue Share (%), by Type of Packaging 2024 & 2032
- Figure 58: South America RTD Protein Industry Volume Share (%), by Type of Packaging 2024 & 2032
- Figure 59: South America RTD Protein Industry Revenue (Million), by Distribution Channel 2024 & 2032
- Figure 60: South America RTD Protein Industry Volume (Billion), by Distribution Channel 2024 & 2032
- Figure 61: South America RTD Protein Industry Revenue Share (%), by Distribution Channel 2024 & 2032
- Figure 62: South America RTD Protein Industry Volume Share (%), by Distribution Channel 2024 & 2032
- Figure 63: South America RTD Protein Industry Revenue (Million), by Country 2024 & 2032
- Figure 64: South America RTD Protein Industry Volume (Billion), by Country 2024 & 2032
- Figure 65: South America RTD Protein Industry Revenue Share (%), by Country 2024 & 2032
- Figure 66: South America RTD Protein Industry Volume Share (%), by Country 2024 & 2032
- Figure 67: Middle East and Africa RTD Protein Industry Revenue (Million), by Source 2024 & 2032
- Figure 68: Middle East and Africa RTD Protein Industry Volume (Billion), by Source 2024 & 2032
- Figure 69: Middle East and Africa RTD Protein Industry Revenue Share (%), by Source 2024 & 2032
- Figure 70: Middle East and Africa RTD Protein Industry Volume Share (%), by Source 2024 & 2032
- Figure 71: Middle East and Africa RTD Protein Industry Revenue (Million), by Type of Packaging 2024 & 2032
- Figure 72: Middle East and Africa RTD Protein Industry Volume (Billion), by Type of Packaging 2024 & 2032
- Figure 73: Middle East and Africa RTD Protein Industry Revenue Share (%), by Type of Packaging 2024 & 2032
- Figure 74: Middle East and Africa RTD Protein Industry Volume Share (%), by Type of Packaging 2024 & 2032
- Figure 75: Middle East and Africa RTD Protein Industry Revenue (Million), by Distribution Channel 2024 & 2032
- Figure 76: Middle East and Africa RTD Protein Industry Volume (Billion), by Distribution Channel 2024 & 2032
- Figure 77: Middle East and Africa RTD Protein Industry Revenue Share (%), by Distribution Channel 2024 & 2032
- Figure 78: Middle East and Africa RTD Protein Industry Volume Share (%), by Distribution Channel 2024 & 2032
- Figure 79: Middle East and Africa RTD Protein Industry Revenue (Million), by Country 2024 & 2032
- Figure 80: Middle East and Africa RTD Protein Industry Volume (Billion), by Country 2024 & 2032
- Figure 81: Middle East and Africa RTD Protein Industry Revenue Share (%), by Country 2024 & 2032
- Figure 82: Middle East and Africa RTD Protein Industry Volume Share (%), by Country 2024 & 2032
List of Tables
- Table 1: Global RTD Protein Industry Revenue Million Forecast, by Region 2019 & 2032
- Table 2: Global RTD Protein Industry Volume Billion Forecast, by Region 2019 & 2032
- Table 3: Global RTD Protein Industry Revenue Million Forecast, by Source 2019 & 2032
- Table 4: Global RTD Protein Industry Volume Billion Forecast, by Source 2019 & 2032
- Table 5: Global RTD Protein Industry Revenue Million Forecast, by Type of Packaging 2019 & 2032
- Table 6: Global RTD Protein Industry Volume Billion Forecast, by Type of Packaging 2019 & 2032
- Table 7: Global RTD Protein Industry Revenue Million Forecast, by Distribution Channel 2019 & 2032
- Table 8: Global RTD Protein Industry Volume Billion Forecast, by Distribution Channel 2019 & 2032
- Table 9: Global RTD Protein Industry Revenue Million Forecast, by Region 2019 & 2032
- Table 10: Global RTD Protein Industry Volume Billion Forecast, by Region 2019 & 2032
- Table 11: Global RTD Protein Industry Revenue Million Forecast, by Source 2019 & 2032
- Table 12: Global RTD Protein Industry Volume Billion Forecast, by Source 2019 & 2032
- Table 13: Global RTD Protein Industry Revenue Million Forecast, by Type of Packaging 2019 & 2032
- Table 14: Global RTD Protein Industry Volume Billion Forecast, by Type of Packaging 2019 & 2032
- Table 15: Global RTD Protein Industry Revenue Million Forecast, by Distribution Channel 2019 & 2032
- Table 16: Global RTD Protein Industry Volume Billion Forecast, by Distribution Channel 2019 & 2032
- Table 17: Global RTD Protein Industry Revenue Million Forecast, by Country 2019 & 2032
- Table 18: Global RTD Protein Industry Volume Billion Forecast, by Country 2019 & 2032
- Table 19: United States RTD Protein Industry Revenue (Million) Forecast, by Application 2019 & 2032
- Table 20: United States RTD Protein Industry Volume (Billion) Forecast, by Application 2019 & 2032
- Table 21: Canada RTD Protein Industry Revenue (Million) Forecast, by Application 2019 & 2032
- Table 22: Canada RTD Protein Industry Volume (Billion) Forecast, by Application 2019 & 2032
- Table 23: Mexico RTD Protein Industry Revenue (Million) Forecast, by Application 2019 & 2032
- Table 24: Mexico RTD Protein Industry Volume (Billion) Forecast, by Application 2019 & 2032
- Table 25: Rest of North America RTD Protein Industry Revenue (Million) Forecast, by Application 2019 & 2032
- Table 26: Rest of North America RTD Protein Industry Volume (Billion) Forecast, by Application 2019 & 2032
- Table 27: Global RTD Protein Industry Revenue Million Forecast, by Source 2019 & 2032
- Table 28: Global RTD Protein Industry Volume Billion Forecast, by Source 2019 & 2032
- Table 29: Global RTD Protein Industry Revenue Million Forecast, by Type of Packaging 2019 & 2032
- Table 30: Global RTD Protein Industry Volume Billion Forecast, by Type of Packaging 2019 & 2032
- Table 31: Global RTD Protein Industry Revenue Million Forecast, by Distribution Channel 2019 & 2032
- Table 32: Global RTD Protein Industry Volume Billion Forecast, by Distribution Channel 2019 & 2032
- Table 33: Global RTD Protein Industry Revenue Million Forecast, by Country 2019 & 2032
- Table 34: Global RTD Protein Industry Volume Billion Forecast, by Country 2019 & 2032
- Table 35: Germany RTD Protein Industry Revenue (Million) Forecast, by Application 2019 & 2032
- Table 36: Germany RTD Protein Industry Volume (Billion) Forecast, by Application 2019 & 2032
- Table 37: United Kingdom RTD Protein Industry Revenue (Million) Forecast, by Application 2019 & 2032
- Table 38: United Kingdom RTD Protein Industry Volume (Billion) Forecast, by Application 2019 & 2032
- Table 39: France RTD Protein Industry Revenue (Million) Forecast, by Application 2019 & 2032
- Table 40: France RTD Protein Industry Volume (Billion) Forecast, by Application 2019 & 2032
- Table 41: Spain RTD Protein Industry Revenue (Million) Forecast, by Application 2019 & 2032
- Table 42: Spain RTD Protein Industry Volume (Billion) Forecast, by Application 2019 & 2032
- Table 43: Italy RTD Protein Industry Revenue (Million) Forecast, by Application 2019 & 2032
- Table 44: Italy RTD Protein Industry Volume (Billion) Forecast, by Application 2019 & 2032
- Table 45: Russia RTD Protein Industry Revenue (Million) Forecast, by Application 2019 & 2032
- Table 46: Russia RTD Protein Industry Volume (Billion) Forecast, by Application 2019 & 2032
- Table 47: Rest of Europe RTD Protein Industry Revenue (Million) Forecast, by Application 2019 & 2032
- Table 48: Rest of Europe RTD Protein Industry Volume (Billion) Forecast, by Application 2019 & 2032
- Table 49: Global RTD Protein Industry Revenue Million Forecast, by Source 2019 & 2032
- Table 50: Global RTD Protein Industry Volume Billion Forecast, by Source 2019 & 2032
- Table 51: Global RTD Protein Industry Revenue Million Forecast, by Type of Packaging 2019 & 2032
- Table 52: Global RTD Protein Industry Volume Billion Forecast, by Type of Packaging 2019 & 2032
- Table 53: Global RTD Protein Industry Revenue Million Forecast, by Distribution Channel 2019 & 2032
- Table 54: Global RTD Protein Industry Volume Billion Forecast, by Distribution Channel 2019 & 2032
- Table 55: Global RTD Protein Industry Revenue Million Forecast, by Country 2019 & 2032
- Table 56: Global RTD Protein Industry Volume Billion Forecast, by Country 2019 & 2032
- Table 57: China RTD Protein Industry Revenue (Million) Forecast, by Application 2019 & 2032
- Table 58: China RTD Protein Industry Volume (Billion) Forecast, by Application 2019 & 2032
- Table 59: Japan RTD Protein Industry Revenue (Million) Forecast, by Application 2019 & 2032
- Table 60: Japan RTD Protein Industry Volume (Billion) Forecast, by Application 2019 & 2032
- Table 61: India RTD Protein Industry Revenue (Million) Forecast, by Application 2019 & 2032
- Table 62: India RTD Protein Industry Volume (Billion) Forecast, by Application 2019 & 2032
- Table 63: Australia RTD Protein Industry Revenue (Million) Forecast, by Application 2019 & 2032
- Table 64: Australia RTD Protein Industry Volume (Billion) Forecast, by Application 2019 & 2032
- Table 65: Rest of Asia Pacific RTD Protein Industry Revenue (Million) Forecast, by Application 2019 & 2032
- Table 66: Rest of Asia Pacific RTD Protein Industry Volume (Billion) Forecast, by Application 2019 & 2032
- Table 67: Global RTD Protein Industry Revenue Million Forecast, by Source 2019 & 2032
- Table 68: Global RTD Protein Industry Volume Billion Forecast, by Source 2019 & 2032
- Table 69: Global RTD Protein Industry Revenue Million Forecast, by Type of Packaging 2019 & 2032
- Table 70: Global RTD Protein Industry Volume Billion Forecast, by Type of Packaging 2019 & 2032
- Table 71: Global RTD Protein Industry Revenue Million Forecast, by Distribution Channel 2019 & 2032
- Table 72: Global RTD Protein Industry Volume Billion Forecast, by Distribution Channel 2019 & 2032
- Table 73: Global RTD Protein Industry Revenue Million Forecast, by Country 2019 & 2032
- Table 74: Global RTD Protein Industry Volume Billion Forecast, by Country 2019 & 2032
- Table 75: Brazil RTD Protein Industry Revenue (Million) Forecast, by Application 2019 & 2032
- Table 76: Brazil RTD Protein Industry Volume (Billion) Forecast, by Application 2019 & 2032
- Table 77: Argentina RTD Protein Industry Revenue (Million) Forecast, by Application 2019 & 2032
- Table 78: Argentina RTD Protein Industry Volume (Billion) Forecast, by Application 2019 & 2032
- Table 79: Rest of South America RTD Protein Industry Revenue (Million) Forecast, by Application 2019 & 2032
- Table 80: Rest of South America RTD Protein Industry Volume (Billion) Forecast, by Application 2019 & 2032
- Table 81: Global RTD Protein Industry Revenue Million Forecast, by Source 2019 & 2032
- Table 82: Global RTD Protein Industry Volume Billion Forecast, by Source 2019 & 2032
- Table 83: Global RTD Protein Industry Revenue Million Forecast, by Type of Packaging 2019 & 2032
- Table 84: Global RTD Protein Industry Volume Billion Forecast, by Type of Packaging 2019 & 2032
- Table 85: Global RTD Protein Industry Revenue Million Forecast, by Distribution Channel 2019 & 2032
- Table 86: Global RTD Protein Industry Volume Billion Forecast, by Distribution Channel 2019 & 2032
- Table 87: Global RTD Protein Industry Revenue Million Forecast, by Country 2019 & 2032
- Table 88: Global RTD Protein Industry Volume Billion Forecast, by Country 2019 & 2032
- Table 89: South Africa RTD Protein Industry Revenue (Million) Forecast, by Application 2019 & 2032
- Table 90: South Africa RTD Protein Industry Volume (Billion) Forecast, by Application 2019 & 2032
- Table 91: United Arab Emirates RTD Protein Industry Revenue (Million) Forecast, by Application 2019 & 2032
- Table 92: United Arab Emirates RTD Protein Industry Volume (Billion) Forecast, by Application 2019 & 2032
- Table 93: Rest of Middle East and Africa RTD Protein Industry Revenue (Million) Forecast, by Application 2019 & 2032
- Table 94: Rest of Middle East and Africa RTD Protein Industry Volume (Billion) Forecast, by Application 2019 & 2032
Frequently Asked Questions
1. What is the projected Compound Annual Growth Rate (CAGR) of the RTD Protein Industry?
The projected CAGR is approximately 7.72%.
2. Which companies are prominent players in the RTD Protein Industry?
Key companies in the market include Kellogg Company, Glanbia PLC, PepsiCo Inc, Halen Brands, Post Holdings Inc, Koia, Abbott Nutrition, Labrada Nutrition, The Coca Cola Company, Pure Protein*List Not Exhaustive.
3. What are the main segments of the RTD Protein Industry?
The market segments include Source, Type of Packaging, Distribution Channel.
4. Can you provide details about the market size?
The market size is estimated to be USD 1.68 Million as of 2022.
5. What are some drivers contributing to market growth?
N/A
6. What are the notable trends driving market growth?
Strong Demand from Health Conscious Consumers.
7. Are there any restraints impacting market growth?
N/A
8. Can you provide examples of recent developments in the market?
March 2022: QNT SA and Qimia Makmal Arad Company entered a partnership. Qimia is authorized in Iran to distribute QNT's functional foods, supplements, and sports nutrition products.
9. What pricing options are available for accessing the report?
Pricing options include single-user, multi-user, and enterprise licenses priced at USD 4750, USD 5250, and USD 8750 respectively.
10. Is the market size provided in terms of value or volume?
The market size is provided in terms of value, measured in Million and volume, measured in Billion.
11. Are there any specific market keywords associated with the report?
Yes, the market keyword associated with the report is "RTD Protein Industry," which aids in identifying and referencing the specific market segment covered.
12. How do I determine which pricing option suits my needs best?
The pricing options vary based on user requirements and access needs. Individual users may opt for single-user licenses, while businesses requiring broader access may choose multi-user or enterprise licenses for cost-effective access to the report.
13. Are there any additional resources or data provided in the RTD Protein Industry report?
While the report offers comprehensive insights, it's advisable to review the specific contents or supplementary materials provided to ascertain if additional resources or data are available.
14. How can I stay updated on further developments or reports in the RTD Protein Industry?
To stay informed about further developments, trends, and reports in the RTD Protein Industry, consider subscribing to industry newsletters, following relevant companies and organizations, or regularly checking reputable industry news sources and publications.
Methodology
Step 1 - Identification of Relevant Samples Size from Population Database


Step 2 - Approaches for Defining Global Market Size (Value, Volume* & Price*)

Note*: In applicable scenarios
Step 3 - Data Sources
Primary Research
- Web Analytics
- Survey Reports
- Research Institute
- Latest Research Reports
- Opinion Leaders
Secondary Research
- Annual Reports
- White Paper
- Latest Press Release
- Industry Association
- Paid Database
- Investor Presentations

Step 4 - Data Triangulation
Involves using different sources of information in order to increase the validity of a study
These sources are likely to be stakeholders in a program - participants, other researchers, program staff, other community members, and so on.
Then we put all data in single framework & apply various statistical tools to find out the dynamic on the market.
During the analysis stage, feedback from the stakeholder groups would be compared to determine areas of agreement as well as areas of divergence
