

Key Insights
The global xanthan gum market, valued at $754.80 million in 2025, is projected to experience robust growth, driven by its versatile applications across diverse industries. A compound annual growth rate (CAGR) of 5.71% from 2025 to 2033 indicates a significant expansion, reaching an estimated market size exceeding $1.2 billion by 2033. This growth is fueled by increasing demand from the food and beverage sector, particularly as a stabilizer and thickener in processed foods, and the expanding pharmaceutical industry, utilizing xanthan gum's properties as a binding agent and stabilizer in drug formulations. The personal care and cosmetics sector also contributes significantly, leveraging its thickening and emulsifying capabilities in lotions, creams, and shampoos. While the oil refinery industry represents a smaller segment, its contribution is steady due to xanthan gum's use in drilling fluids. Market expansion is further supported by ongoing research into novel applications and the development of sustainable and cost-effective production methods. Competition among key players such as Mitsubishi Corporation, Solvay S.A., and Cargill Incorporated is driving innovation and the development of specialized xanthan gum variants to cater to specific industry needs. Geographic expansion, particularly in rapidly developing economies in Asia-Pacific, is expected to contribute significantly to overall market growth.
Despite the promising growth outlook, several factors could potentially restrain market expansion. Fluctuations in raw material prices, primarily carbohydrates used in xanthan gum production, can impact profitability and pricing. Moreover, increasing awareness of alternative thickening and stabilizing agents may present a competitive challenge. However, the versatility and proven effectiveness of xanthan gum, coupled with ongoing research and development efforts, are likely to mitigate these challenges and ensure sustained market growth in the coming years. The liquid form of xanthan gum currently holds a larger market share compared to the dry form due to its ease of handling and immediate solubility in various applications, but dry form is gaining popularity due to its longer shelf life and ease of transportation.
Xanthan Gum Market: A Comprehensive Report (2019-2033)
This in-depth report provides a comprehensive analysis of the global xanthan gum market, encompassing market dynamics, growth trends, regional dominance, product landscape, key players, and future outlook. The study period covers 2019-2033, with 2025 as the base year and a forecast period of 2025-2033. The report offers valuable insights for industry professionals, investors, and businesses seeking to navigate this dynamic market. The report covers both parent markets (e.g., food stabilizers, thickening agents) and child markets (e.g., specific food and beverage applications, pharmaceutical formulations). Market values are presented in Million units.

Xanthan Gum Market Dynamics & Structure
The xanthan gum market is characterized by moderate concentration, with key players like Mitsubishi Corporation, Solvay S.A., Cargill Incorporated, and Ingredion Incorporated holding significant market share. Technological innovation, particularly in sustainable production methods and novel applications, is a key driver. Stringent regulatory frameworks concerning food safety and ingredient labeling influence market dynamics. Competitive substitutes, such as guar gum and locust bean gum, exert pressure, while the increasing demand from food and beverage, pharmaceuticals, and personal care industries fuels market growth. Mergers and acquisitions (M&A) activity in the sector is moderate, with a recorded xx M&A deals in the past five years (2019-2024), resulting in a xx% market share shift among top players.
- Market Concentration: Moderately concentrated, with top 5 players holding xx% market share.
- Technological Innovation: Focus on sustainable production and novel applications.
- Regulatory Landscape: Stringent regulations impacting food safety and labeling.
- Competitive Substitutes: Guar gum, locust bean gum exerting competitive pressure.
- End-User Demographics: Growing demand from diverse industries (food, pharma, personal care).
- M&A Activity: Moderate activity, with xx deals recorded (2019-2024), leading to a xx% market share shift.
Xanthan Gum Market Growth Trends & Insights
The global xanthan gum market exhibited a CAGR of xx% during the historical period (2019-2024), reaching a market size of xx Million units in 2024. Driven by rising consumer demand for processed foods, pharmaceuticals, and personal care products, the market is projected to continue its growth trajectory, reaching xx Million units by 2033, with a projected CAGR of xx% during the forecast period (2025-2033). Technological advancements in production efficiency and the expansion of applications in emerging markets contribute significantly to market growth. Consumer preference shifts towards healthier and more convenient food products also fuel the market's expansion. Market penetration in developing economies is anticipated to increase substantially during the forecast period.

Dominant Regions, Countries, or Segments in Xanthan Gum Market
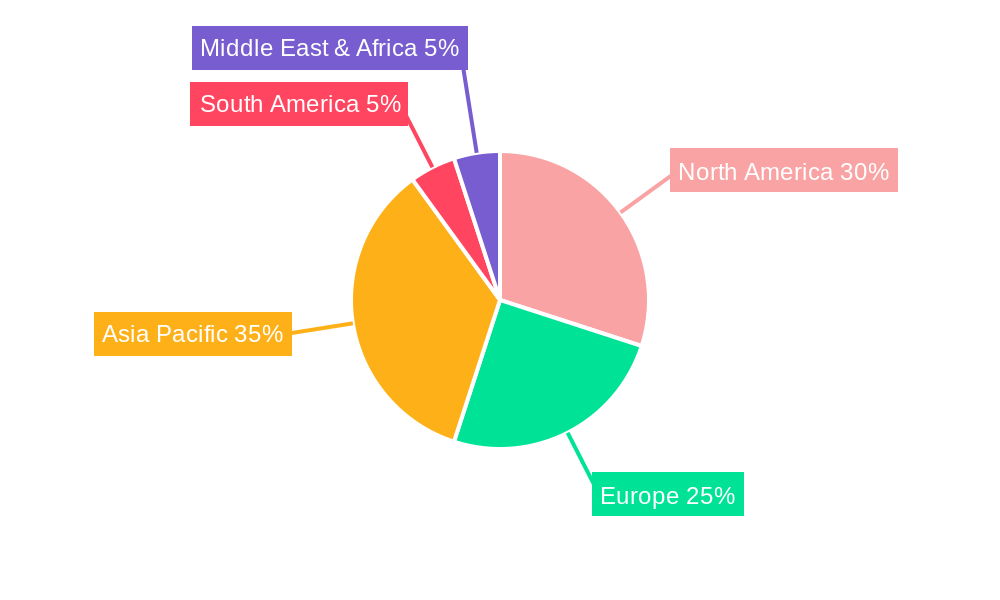
North America currently dominates the xanthan gum market, holding a market share of approximately xx%, followed by Europe (xx%) and Asia-Pacific (xx%). Within the application segments, the Food and Beverages sector holds the largest market share (xx%), driven by the rising demand for processed foods, especially in developing countries. The dry form segment holds a larger market share (xx%) than the liquid segment (xx%) due to its ease of handling and storage.
- Key Drivers for North America: Strong demand from food & beverage industry, robust R&D activities.
- Key Drivers for Europe: Stringent food safety regulations promoting xanthan gum adoption.
- Key Drivers for Asia-Pacific: Rapidly growing food processing industry and increasing disposable incomes.
- Key Drivers for Food and Beverages segment: Increasing processed food consumption.
- Key Drivers for Dry Form: Ease of handling, storage, and transportation.
Xanthan Gum Market Product Landscape
The xanthan gum market offers both liquid and dry forms, catering to diverse applications. Recent innovations focus on enhancing its functionalities (e.g., improved viscosity, stability, and solubility) to meet specific industry demands. Technological advancements focus on improving the sustainability of production processes and reducing environmental impact. Unique selling propositions for xanthan gum include its exceptional thickening, stabilizing, and emulsifying properties.
Key Drivers, Barriers & Challenges in Xanthan Gum Market
Key Drivers:
- Growing demand for processed foods and functional ingredients
- Rising consumer demand for healthier, convenient products
- Increasing applications in pharmaceuticals and personal care
- Technological advancements in production efficiency
Key Challenges:
- Fluctuations in raw material prices
- Competition from substitute products
- Stringent regulatory compliance requirements
- Supply chain disruptions resulting in xx% price increase during peak demand (estimated).
Emerging Opportunities in Xanthan Gum Market
- Untapped markets in developing economies (e.g., Africa, South America)
- Expanding applications in novel food products (e.g., plant-based meats, dairy alternatives)
- Growing demand for sustainable and eco-friendly xanthan gum production methods
- Increased use in specialized applications like oil drilling and bioremediation
Growth Accelerators in the Xanthan Gum Market Industry
Technological breakthroughs in fermentation processes are reducing production costs and improving xanthan gum quality. Strategic partnerships between manufacturers and downstream users are driving innovation and expanding market penetration. Aggressive market expansion strategies focusing on emerging markets are further accelerating market growth.
Key Players Shaping the Xanthan Gum Market Market
- Mitsubishi Corporation
- Solvay S.A.
- Cargill Incorporated
- The Archer-Daniels-Midland Company
- JM Huber Corporation
- Foodchem International Corporation
- Ingredion Incorporated
- International Flavours and Fragrances Inc
- Deosen Biochemical Ltd
- C E Roeper GmbH
Notable Milestones in Xanthan Gum Market Sector
- November 2023: Mitsubishi Corporation Life Sciences Limited expands food ingredient production capacity by 1,000 metric tons annually.
- October 2022: Cargill launches its first digital business studio in Asia, focusing on food and agriculture innovation.
- July 2022: CP Kelco expands bio-gum production capacity, including xanthan gum, in the US and China.
In-Depth Xanthan Gum Market Market Outlook
The xanthan gum market is poised for continued robust growth, driven by technological advancements, strategic partnerships, and expansion into new applications and markets. The market's future potential is significant, especially in emerging economies and niche applications. Strategic investments in sustainable production methods and innovative product development will be key to maximizing long-term growth and capturing market share.
Xanthan Gum Market Segmentation
-
1. Form
- 1.1. Liquid
- 1.2. Dry
-
2. Application
-
2.1. Food and Beverages
- 2.1.1. Bakery Products
- 2.1.2. Confectionery
- 2.1.3. Meat Products
- 2.1.4. Frozen Food
- 2.1.5. Dairy Products
- 2.1.6. Others
- 2.2. Pharmaceuticals
- 2.3. Personal care and Cosmetics
- 2.4. Oil Refinery
- 2.5. Other Applications
-
2.1. Food and Beverages
Xanthan Gum Market Segmentation By Geography
-
1. North America
- 1.1. United States
- 1.2. Canada
- 1.3. Mexico
- 1.4. Rest of North America
-
2. Europe
- 2.1. Spain
- 2.2. United Kingdom
- 2.3. Germany
- 2.4. France
- 2.5. Italy
- 2.6. Russia
- 2.7. Rest of Europe
-
3. Asia Pacific
- 3.1. China
- 3.2. Japan
- 3.3. India
- 3.4. Australia
- 3.5. Rest of Asia Pacific
-
4. South America
- 4.1. Brazil
- 4.2. Argentina
- 4.3. Rest of South America
- 5. Middle East
-
6. South Africa
- 6.1. United Arab Emrates
- 6.2. Rest of Middle East and Africa
Xanthan Gum Market REPORT HIGHLIGHTS
| Aspects | Details |
|---|---|
| Study Period | 2019-2033 |
| Base Year | 2024 |
| Estimated Year | 2025 |
| Forecast Period | 2025-2033 |
| Historical Period | 2019-2024 |
| Growth Rate | CAGR of 5.71% from 2019-2033 |
| Segmentation |
|
Table of Contents
- 1. Introduction
- 1.1. Research Scope
- 1.2. Market Segmentation
- 1.3. Research Methodology
- 1.4. Definitions and Assumptions
- 2. Executive Summary
- 2.1. Introduction
- 3. Market Dynamics
- 3.1. Introduction
- 3.2. Market Drivers
- 3.2.1. Wide Applications and Functionality; Demand For Gluten-Free Products
- 3.3. Market Restrains
- 3.3.1. Easy Availability of Economically Feasible Alternatives
- 3.4. Market Trends
- 3.4.1. Food and Beverage Industry is the Biggest Consumer of Xanthan Gum
- 4. Market Factor Analysis
- 4.1. Porters Five Forces
- 4.2. Supply/Value Chain
- 4.3. PESTEL analysis
- 4.4. Market Entropy
- 4.5. Patent/Trademark Analysis
- 5. Global Xanthan Gum Market Analysis, Insights and Forecast, 2019-2031
- 5.1. Market Analysis, Insights and Forecast - by Form
- 5.1.1. Liquid
- 5.1.2. Dry
- 5.2. Market Analysis, Insights and Forecast - by Application
- 5.2.1. Food and Beverages
- 5.2.1.1. Bakery Products
- 5.2.1.2. Confectionery
- 5.2.1.3. Meat Products
- 5.2.1.4. Frozen Food
- 5.2.1.5. Dairy Products
- 5.2.1.6. Others
- 5.2.2. Pharmaceuticals
- 5.2.3. Personal care and Cosmetics
- 5.2.4. Oil Refinery
- 5.2.5. Other Applications
- 5.2.1. Food and Beverages
- 5.3. Market Analysis, Insights and Forecast - by Region
- 5.3.1. North America
- 5.3.2. Europe
- 5.3.3. Asia Pacific
- 5.3.4. South America
- 5.3.5. Middle East
- 5.3.6. South Africa
- 5.1. Market Analysis, Insights and Forecast - by Form
- 6. North America Xanthan Gum Market Analysis, Insights and Forecast, 2019-2031
- 6.1. Market Analysis, Insights and Forecast - by Form
- 6.1.1. Liquid
- 6.1.2. Dry
- 6.2. Market Analysis, Insights and Forecast - by Application
- 6.2.1. Food and Beverages
- 6.2.1.1. Bakery Products
- 6.2.1.2. Confectionery
- 6.2.1.3. Meat Products
- 6.2.1.4. Frozen Food
- 6.2.1.5. Dairy Products
- 6.2.1.6. Others
- 6.2.2. Pharmaceuticals
- 6.2.3. Personal care and Cosmetics
- 6.2.4. Oil Refinery
- 6.2.5. Other Applications
- 6.2.1. Food and Beverages
- 6.1. Market Analysis, Insights and Forecast - by Form
- 7. Europe Xanthan Gum Market Analysis, Insights and Forecast, 2019-2031
- 7.1. Market Analysis, Insights and Forecast - by Form
- 7.1.1. Liquid
- 7.1.2. Dry
- 7.2. Market Analysis, Insights and Forecast - by Application
- 7.2.1. Food and Beverages
- 7.2.1.1. Bakery Products
- 7.2.1.2. Confectionery
- 7.2.1.3. Meat Products
- 7.2.1.4. Frozen Food
- 7.2.1.5. Dairy Products
- 7.2.1.6. Others
- 7.2.2. Pharmaceuticals
- 7.2.3. Personal care and Cosmetics
- 7.2.4. Oil Refinery
- 7.2.5. Other Applications
- 7.2.1. Food and Beverages
- 7.1. Market Analysis, Insights and Forecast - by Form
- 8. Asia Pacific Xanthan Gum Market Analysis, Insights and Forecast, 2019-2031
- 8.1. Market Analysis, Insights and Forecast - by Form
- 8.1.1. Liquid
- 8.1.2. Dry
- 8.2. Market Analysis, Insights and Forecast - by Application
- 8.2.1. Food and Beverages
- 8.2.1.1. Bakery Products
- 8.2.1.2. Confectionery
- 8.2.1.3. Meat Products
- 8.2.1.4. Frozen Food
- 8.2.1.5. Dairy Products
- 8.2.1.6. Others
- 8.2.2. Pharmaceuticals
- 8.2.3. Personal care and Cosmetics
- 8.2.4. Oil Refinery
- 8.2.5. Other Applications
- 8.2.1. Food and Beverages
- 8.1. Market Analysis, Insights and Forecast - by Form
- 9. South America Xanthan Gum Market Analysis, Insights and Forecast, 2019-2031
- 9.1. Market Analysis, Insights and Forecast - by Form
- 9.1.1. Liquid
- 9.1.2. Dry
- 9.2. Market Analysis, Insights and Forecast - by Application
- 9.2.1. Food and Beverages
- 9.2.1.1. Bakery Products
- 9.2.1.2. Confectionery
- 9.2.1.3. Meat Products
- 9.2.1.4. Frozen Food
- 9.2.1.5. Dairy Products
- 9.2.1.6. Others
- 9.2.2. Pharmaceuticals
- 9.2.3. Personal care and Cosmetics
- 9.2.4. Oil Refinery
- 9.2.5. Other Applications
- 9.2.1. Food and Beverages
- 9.1. Market Analysis, Insights and Forecast - by Form
- 10. Middle East Xanthan Gum Market Analysis, Insights and Forecast, 2019-2031
- 10.1. Market Analysis, Insights and Forecast - by Form
- 10.1.1. Liquid
- 10.1.2. Dry
- 10.2. Market Analysis, Insights and Forecast - by Application
- 10.2.1. Food and Beverages
- 10.2.1.1. Bakery Products
- 10.2.1.2. Confectionery
- 10.2.1.3. Meat Products
- 10.2.1.4. Frozen Food
- 10.2.1.5. Dairy Products
- 10.2.1.6. Others
- 10.2.2. Pharmaceuticals
- 10.2.3. Personal care and Cosmetics
- 10.2.4. Oil Refinery
- 10.2.5. Other Applications
- 10.2.1. Food and Beverages
- 10.1. Market Analysis, Insights and Forecast - by Form
- 11. South Africa Xanthan Gum Market Analysis, Insights and Forecast, 2019-2031
- 11.1. Market Analysis, Insights and Forecast - by Form
- 11.1.1. Liquid
- 11.1.2. Dry
- 11.2. Market Analysis, Insights and Forecast - by Application
- 11.2.1. Food and Beverages
- 11.2.1.1. Bakery Products
- 11.2.1.2. Confectionery
- 11.2.1.3. Meat Products
- 11.2.1.4. Frozen Food
- 11.2.1.5. Dairy Products
- 11.2.1.6. Others
- 11.2.2. Pharmaceuticals
- 11.2.3. Personal care and Cosmetics
- 11.2.4. Oil Refinery
- 11.2.5. Other Applications
- 11.2.1. Food and Beverages
- 11.1. Market Analysis, Insights and Forecast - by Form
- 12. North America Xanthan Gum Market Analysis, Insights and Forecast, 2019-2031
- 12.1. Market Analysis, Insights and Forecast - By Country/Sub-region
- 12.1.1 United States
- 12.1.2 Canada
- 12.1.3 Mexico
- 12.1.4 Rest of North America
- 13. Europe Xanthan Gum Market Analysis, Insights and Forecast, 2019-2031
- 13.1. Market Analysis, Insights and Forecast - By Country/Sub-region
- 13.1.1 Spain
- 13.1.2 United Kingdom
- 13.1.3 Germany
- 13.1.4 France
- 13.1.5 Italy
- 13.1.6 Russia
- 13.1.7 Rest of Europe
- 14. Asia Pacific Xanthan Gum Market Analysis, Insights and Forecast, 2019-2031
- 14.1. Market Analysis, Insights and Forecast - By Country/Sub-region
- 14.1.1 China
- 14.1.2 Japan
- 14.1.3 India
- 14.1.4 Australia
- 14.1.5 Rest of Asia Pacific
- 15. South America Xanthan Gum Market Analysis, Insights and Forecast, 2019-2031
- 15.1. Market Analysis, Insights and Forecast - By Country/Sub-region
- 15.1.1 Brazil
- 15.1.2 Argentina
- 15.1.3 Rest of South America
- 16. South Africa Xanthan Gum Market Analysis, Insights and Forecast, 2019-2031
- 16.1. Market Analysis, Insights and Forecast - By Country/Sub-region
- 16.1.1 United Arab Emrates
- 16.1.2 Rest of Middle East and Africa
- 17. Competitive Analysis
- 17.1. Global Market Share Analysis 2024
- 17.2. Company Profiles
- 17.2.1 Mitsubishi Corporation
- 17.2.1.1. Overview
- 17.2.1.2. Products
- 17.2.1.3. SWOT Analysis
- 17.2.1.4. Recent Developments
- 17.2.1.5. Financials (Based on Availability)
- 17.2.2 Solvay S A
- 17.2.2.1. Overview
- 17.2.2.2. Products
- 17.2.2.3. SWOT Analysis
- 17.2.2.4. Recent Developments
- 17.2.2.5. Financials (Based on Availability)
- 17.2.3 Cargill Incorporated
- 17.2.3.1. Overview
- 17.2.3.2. Products
- 17.2.3.3. SWOT Analysis
- 17.2.3.4. Recent Developments
- 17.2.3.5. Financials (Based on Availability)
- 17.2.4 The Archer-Daniels-Midland Company
- 17.2.4.1. Overview
- 17.2.4.2. Products
- 17.2.4.3. SWOT Analysis
- 17.2.4.4. Recent Developments
- 17.2.4.5. Financials (Based on Availability)
- 17.2.5 JM Huber Corporation
- 17.2.5.1. Overview
- 17.2.5.2. Products
- 17.2.5.3. SWOT Analysis
- 17.2.5.4. Recent Developments
- 17.2.5.5. Financials (Based on Availability)
- 17.2.6 Foodchem International Corporation
- 17.2.6.1. Overview
- 17.2.6.2. Products
- 17.2.6.3. SWOT Analysis
- 17.2.6.4. Recent Developments
- 17.2.6.5. Financials (Based on Availability)
- 17.2.7 Ingredion Incorporated
- 17.2.7.1. Overview
- 17.2.7.2. Products
- 17.2.7.3. SWOT Analysis
- 17.2.7.4. Recent Developments
- 17.2.7.5. Financials (Based on Availability)
- 17.2.8 International Flavours and Fragrances Inc
- 17.2.8.1. Overview
- 17.2.8.2. Products
- 17.2.8.3. SWOT Analysis
- 17.2.8.4. Recent Developments
- 17.2.8.5. Financials (Based on Availability)
- 17.2.9 Deosen Biochemical Ltd
- 17.2.9.1. Overview
- 17.2.9.2. Products
- 17.2.9.3. SWOT Analysis
- 17.2.9.4. Recent Developments
- 17.2.9.5. Financials (Based on Availability)
- 17.2.10 C E Roeper GmbH
- 17.2.10.1. Overview
- 17.2.10.2. Products
- 17.2.10.3. SWOT Analysis
- 17.2.10.4. Recent Developments
- 17.2.10.5. Financials (Based on Availability)
- 17.2.1 Mitsubishi Corporation
List of Figures
- Figure 1: Global Xanthan Gum Market Revenue Breakdown (Million, %) by Region 2024 & 2032
- Figure 2: North America Xanthan Gum Market Revenue (Million), by Country 2024 & 2032
- Figure 3: North America Xanthan Gum Market Revenue Share (%), by Country 2024 & 2032
- Figure 4: Europe Xanthan Gum Market Revenue (Million), by Country 2024 & 2032
- Figure 5: Europe Xanthan Gum Market Revenue Share (%), by Country 2024 & 2032
- Figure 6: Asia Pacific Xanthan Gum Market Revenue (Million), by Country 2024 & 2032
- Figure 7: Asia Pacific Xanthan Gum Market Revenue Share (%), by Country 2024 & 2032
- Figure 8: South America Xanthan Gum Market Revenue (Million), by Country 2024 & 2032
- Figure 9: South America Xanthan Gum Market Revenue Share (%), by Country 2024 & 2032
- Figure 10: South Africa Xanthan Gum Market Revenue (Million), by Country 2024 & 2032
- Figure 11: South Africa Xanthan Gum Market Revenue Share (%), by Country 2024 & 2032
- Figure 12: North America Xanthan Gum Market Revenue (Million), by Form 2024 & 2032
- Figure 13: North America Xanthan Gum Market Revenue Share (%), by Form 2024 & 2032
- Figure 14: North America Xanthan Gum Market Revenue (Million), by Application 2024 & 2032
- Figure 15: North America Xanthan Gum Market Revenue Share (%), by Application 2024 & 2032
- Figure 16: North America Xanthan Gum Market Revenue (Million), by Country 2024 & 2032
- Figure 17: North America Xanthan Gum Market Revenue Share (%), by Country 2024 & 2032
- Figure 18: Europe Xanthan Gum Market Revenue (Million), by Form 2024 & 2032
- Figure 19: Europe Xanthan Gum Market Revenue Share (%), by Form 2024 & 2032
- Figure 20: Europe Xanthan Gum Market Revenue (Million), by Application 2024 & 2032
- Figure 21: Europe Xanthan Gum Market Revenue Share (%), by Application 2024 & 2032
- Figure 22: Europe Xanthan Gum Market Revenue (Million), by Country 2024 & 2032
- Figure 23: Europe Xanthan Gum Market Revenue Share (%), by Country 2024 & 2032
- Figure 24: Asia Pacific Xanthan Gum Market Revenue (Million), by Form 2024 & 2032
- Figure 25: Asia Pacific Xanthan Gum Market Revenue Share (%), by Form 2024 & 2032
- Figure 26: Asia Pacific Xanthan Gum Market Revenue (Million), by Application 2024 & 2032
- Figure 27: Asia Pacific Xanthan Gum Market Revenue Share (%), by Application 2024 & 2032
- Figure 28: Asia Pacific Xanthan Gum Market Revenue (Million), by Country 2024 & 2032
- Figure 29: Asia Pacific Xanthan Gum Market Revenue Share (%), by Country 2024 & 2032
- Figure 30: South America Xanthan Gum Market Revenue (Million), by Form 2024 & 2032
- Figure 31: South America Xanthan Gum Market Revenue Share (%), by Form 2024 & 2032
- Figure 32: South America Xanthan Gum Market Revenue (Million), by Application 2024 & 2032
- Figure 33: South America Xanthan Gum Market Revenue Share (%), by Application 2024 & 2032
- Figure 34: South America Xanthan Gum Market Revenue (Million), by Country 2024 & 2032
- Figure 35: South America Xanthan Gum Market Revenue Share (%), by Country 2024 & 2032
- Figure 36: Middle East Xanthan Gum Market Revenue (Million), by Form 2024 & 2032
- Figure 37: Middle East Xanthan Gum Market Revenue Share (%), by Form 2024 & 2032
- Figure 38: Middle East Xanthan Gum Market Revenue (Million), by Application 2024 & 2032
- Figure 39: Middle East Xanthan Gum Market Revenue Share (%), by Application 2024 & 2032
- Figure 40: Middle East Xanthan Gum Market Revenue (Million), by Country 2024 & 2032
- Figure 41: Middle East Xanthan Gum Market Revenue Share (%), by Country 2024 & 2032
- Figure 42: South Africa Xanthan Gum Market Revenue (Million), by Form 2024 & 2032
- Figure 43: South Africa Xanthan Gum Market Revenue Share (%), by Form 2024 & 2032
- Figure 44: South Africa Xanthan Gum Market Revenue (Million), by Application 2024 & 2032
- Figure 45: South Africa Xanthan Gum Market Revenue Share (%), by Application 2024 & 2032
- Figure 46: South Africa Xanthan Gum Market Revenue (Million), by Country 2024 & 2032
- Figure 47: South Africa Xanthan Gum Market Revenue Share (%), by Country 2024 & 2032
List of Tables
- Table 1: Global Xanthan Gum Market Revenue Million Forecast, by Region 2019 & 2032
- Table 2: Global Xanthan Gum Market Revenue Million Forecast, by Form 2019 & 2032
- Table 3: Global Xanthan Gum Market Revenue Million Forecast, by Application 2019 & 2032
- Table 4: Global Xanthan Gum Market Revenue Million Forecast, by Region 2019 & 2032
- Table 5: Global Xanthan Gum Market Revenue Million Forecast, by Country 2019 & 2032
- Table 6: United States Xanthan Gum Market Revenue (Million) Forecast, by Application 2019 & 2032
- Table 7: Canada Xanthan Gum Market Revenue (Million) Forecast, by Application 2019 & 2032
- Table 8: Mexico Xanthan Gum Market Revenue (Million) Forecast, by Application 2019 & 2032
- Table 9: Rest of North America Xanthan Gum Market Revenue (Million) Forecast, by Application 2019 & 2032
- Table 10: Global Xanthan Gum Market Revenue Million Forecast, by Country 2019 & 2032
- Table 11: Spain Xanthan Gum Market Revenue (Million) Forecast, by Application 2019 & 2032
- Table 12: United Kingdom Xanthan Gum Market Revenue (Million) Forecast, by Application 2019 & 2032
- Table 13: Germany Xanthan Gum Market Revenue (Million) Forecast, by Application 2019 & 2032
- Table 14: France Xanthan Gum Market Revenue (Million) Forecast, by Application 2019 & 2032
- Table 15: Italy Xanthan Gum Market Revenue (Million) Forecast, by Application 2019 & 2032
- Table 16: Russia Xanthan Gum Market Revenue (Million) Forecast, by Application 2019 & 2032
- Table 17: Rest of Europe Xanthan Gum Market Revenue (Million) Forecast, by Application 2019 & 2032
- Table 18: Global Xanthan Gum Market Revenue Million Forecast, by Country 2019 & 2032
- Table 19: China Xanthan Gum Market Revenue (Million) Forecast, by Application 2019 & 2032
- Table 20: Japan Xanthan Gum Market Revenue (Million) Forecast, by Application 2019 & 2032
- Table 21: India Xanthan Gum Market Revenue (Million) Forecast, by Application 2019 & 2032
- Table 22: Australia Xanthan Gum Market Revenue (Million) Forecast, by Application 2019 & 2032
- Table 23: Rest of Asia Pacific Xanthan Gum Market Revenue (Million) Forecast, by Application 2019 & 2032
- Table 24: Global Xanthan Gum Market Revenue Million Forecast, by Country 2019 & 2032
- Table 25: Brazil Xanthan Gum Market Revenue (Million) Forecast, by Application 2019 & 2032
- Table 26: Argentina Xanthan Gum Market Revenue (Million) Forecast, by Application 2019 & 2032
- Table 27: Rest of South America Xanthan Gum Market Revenue (Million) Forecast, by Application 2019 & 2032
- Table 28: Global Xanthan Gum Market Revenue Million Forecast, by Country 2019 & 2032
- Table 29: United Arab Emrates Xanthan Gum Market Revenue (Million) Forecast, by Application 2019 & 2032
- Table 30: Rest of Middle East and Africa Xanthan Gum Market Revenue (Million) Forecast, by Application 2019 & 2032
- Table 31: Global Xanthan Gum Market Revenue Million Forecast, by Form 2019 & 2032
- Table 32: Global Xanthan Gum Market Revenue Million Forecast, by Application 2019 & 2032
- Table 33: Global Xanthan Gum Market Revenue Million Forecast, by Country 2019 & 2032
- Table 34: United States Xanthan Gum Market Revenue (Million) Forecast, by Application 2019 & 2032
- Table 35: Canada Xanthan Gum Market Revenue (Million) Forecast, by Application 2019 & 2032
- Table 36: Mexico Xanthan Gum Market Revenue (Million) Forecast, by Application 2019 & 2032
- Table 37: Rest of North America Xanthan Gum Market Revenue (Million) Forecast, by Application 2019 & 2032
- Table 38: Global Xanthan Gum Market Revenue Million Forecast, by Form 2019 & 2032
- Table 39: Global Xanthan Gum Market Revenue Million Forecast, by Application 2019 & 2032
- Table 40: Global Xanthan Gum Market Revenue Million Forecast, by Country 2019 & 2032
- Table 41: Spain Xanthan Gum Market Revenue (Million) Forecast, by Application 2019 & 2032
- Table 42: United Kingdom Xanthan Gum Market Revenue (Million) Forecast, by Application 2019 & 2032
- Table 43: Germany Xanthan Gum Market Revenue (Million) Forecast, by Application 2019 & 2032
- Table 44: France Xanthan Gum Market Revenue (Million) Forecast, by Application 2019 & 2032
- Table 45: Italy Xanthan Gum Market Revenue (Million) Forecast, by Application 2019 & 2032
- Table 46: Russia Xanthan Gum Market Revenue (Million) Forecast, by Application 2019 & 2032
- Table 47: Rest of Europe Xanthan Gum Market Revenue (Million) Forecast, by Application 2019 & 2032
- Table 48: Global Xanthan Gum Market Revenue Million Forecast, by Form 2019 & 2032
- Table 49: Global Xanthan Gum Market Revenue Million Forecast, by Application 2019 & 2032
- Table 50: Global Xanthan Gum Market Revenue Million Forecast, by Country 2019 & 2032
- Table 51: China Xanthan Gum Market Revenue (Million) Forecast, by Application 2019 & 2032
- Table 52: Japan Xanthan Gum Market Revenue (Million) Forecast, by Application 2019 & 2032
- Table 53: India Xanthan Gum Market Revenue (Million) Forecast, by Application 2019 & 2032
- Table 54: Australia Xanthan Gum Market Revenue (Million) Forecast, by Application 2019 & 2032
- Table 55: Rest of Asia Pacific Xanthan Gum Market Revenue (Million) Forecast, by Application 2019 & 2032
- Table 56: Global Xanthan Gum Market Revenue Million Forecast, by Form 2019 & 2032
- Table 57: Global Xanthan Gum Market Revenue Million Forecast, by Application 2019 & 2032
- Table 58: Global Xanthan Gum Market Revenue Million Forecast, by Country 2019 & 2032
- Table 59: Brazil Xanthan Gum Market Revenue (Million) Forecast, by Application 2019 & 2032
- Table 60: Argentina Xanthan Gum Market Revenue (Million) Forecast, by Application 2019 & 2032
- Table 61: Rest of South America Xanthan Gum Market Revenue (Million) Forecast, by Application 2019 & 2032
- Table 62: Global Xanthan Gum Market Revenue Million Forecast, by Form 2019 & 2032
- Table 63: Global Xanthan Gum Market Revenue Million Forecast, by Application 2019 & 2032
- Table 64: Global Xanthan Gum Market Revenue Million Forecast, by Country 2019 & 2032
- Table 65: Global Xanthan Gum Market Revenue Million Forecast, by Form 2019 & 2032
- Table 66: Global Xanthan Gum Market Revenue Million Forecast, by Application 2019 & 2032
- Table 67: Global Xanthan Gum Market Revenue Million Forecast, by Country 2019 & 2032
- Table 68: United Arab Emrates Xanthan Gum Market Revenue (Million) Forecast, by Application 2019 & 2032
- Table 69: Rest of Middle East and Africa Xanthan Gum Market Revenue (Million) Forecast, by Application 2019 & 2032
Frequently Asked Questions
1. What is the projected Compound Annual Growth Rate (CAGR) of the Xanthan Gum Market?
The projected CAGR is approximately 5.71%.
2. Which companies are prominent players in the Xanthan Gum Market?
Key companies in the market include Mitsubishi Corporation, Solvay S A, Cargill Incorporated, The Archer-Daniels-Midland Company, JM Huber Corporation , Foodchem International Corporation, Ingredion Incorporated, International Flavours and Fragrances Inc, Deosen Biochemical Ltd, C E Roeper GmbH.
3. What are the main segments of the Xanthan Gum Market?
The market segments include Form, Application.
4. Can you provide details about the market size?
The market size is estimated to be USD 754.80 Million as of 2022.
5. What are some drivers contributing to market growth?
Wide Applications and Functionality; Demand For Gluten-Free Products.
6. What are the notable trends driving market growth?
Food and Beverage Industry is the Biggest Consumer of Xanthan Gum.
7. Are there any restraints impacting market growth?
Easy Availability of Economically Feasible Alternatives.
8. Can you provide examples of recent developments in the market?
November 2023: Mitsubishi Corporation Life Sciences Limited expanded its food ingredient product capacity at the Saiki Factory of its subsidiary Kohjin Life Sciences Ltd. The company expanded the production capacity for its main products by approximately 1,000 metric tons annually.
9. What pricing options are available for accessing the report?
Pricing options include single-user, multi-user, and enterprise licenses priced at USD 4750, USD 5250, and USD 8750 respectively.
10. Is the market size provided in terms of value or volume?
The market size is provided in terms of value, measured in Million.
11. Are there any specific market keywords associated with the report?
Yes, the market keyword associated with the report is "Xanthan Gum Market," which aids in identifying and referencing the specific market segment covered.
12. How do I determine which pricing option suits my needs best?
The pricing options vary based on user requirements and access needs. Individual users may opt for single-user licenses, while businesses requiring broader access may choose multi-user or enterprise licenses for cost-effective access to the report.
13. Are there any additional resources or data provided in the Xanthan Gum Market report?
While the report offers comprehensive insights, it's advisable to review the specific contents or supplementary materials provided to ascertain if additional resources or data are available.
14. How can I stay updated on further developments or reports in the Xanthan Gum Market?
To stay informed about further developments, trends, and reports in the Xanthan Gum Market, consider subscribing to industry newsletters, following relevant companies and organizations, or regularly checking reputable industry news sources and publications.
Methodology
Step 1 - Identification of Relevant Samples Size from Population Database


Step 2 - Approaches for Defining Global Market Size (Value, Volume* & Price*)

Note*: In applicable scenarios
Step 3 - Data Sources
Primary Research
- Web Analytics
- Survey Reports
- Research Institute
- Latest Research Reports
- Opinion Leaders
Secondary Research
- Annual Reports
- White Paper
- Latest Press Release
- Industry Association
- Paid Database
- Investor Presentations

Step 4 - Data Triangulation
Involves using different sources of information in order to increase the validity of a study
These sources are likely to be stakeholders in a program - participants, other researchers, program staff, other community members, and so on.
Then we put all data in single framework & apply various statistical tools to find out the dynamic on the market.
During the analysis stage, feedback from the stakeholder groups would be compared to determine areas of agreement as well as areas of divergence
