

Key Insights
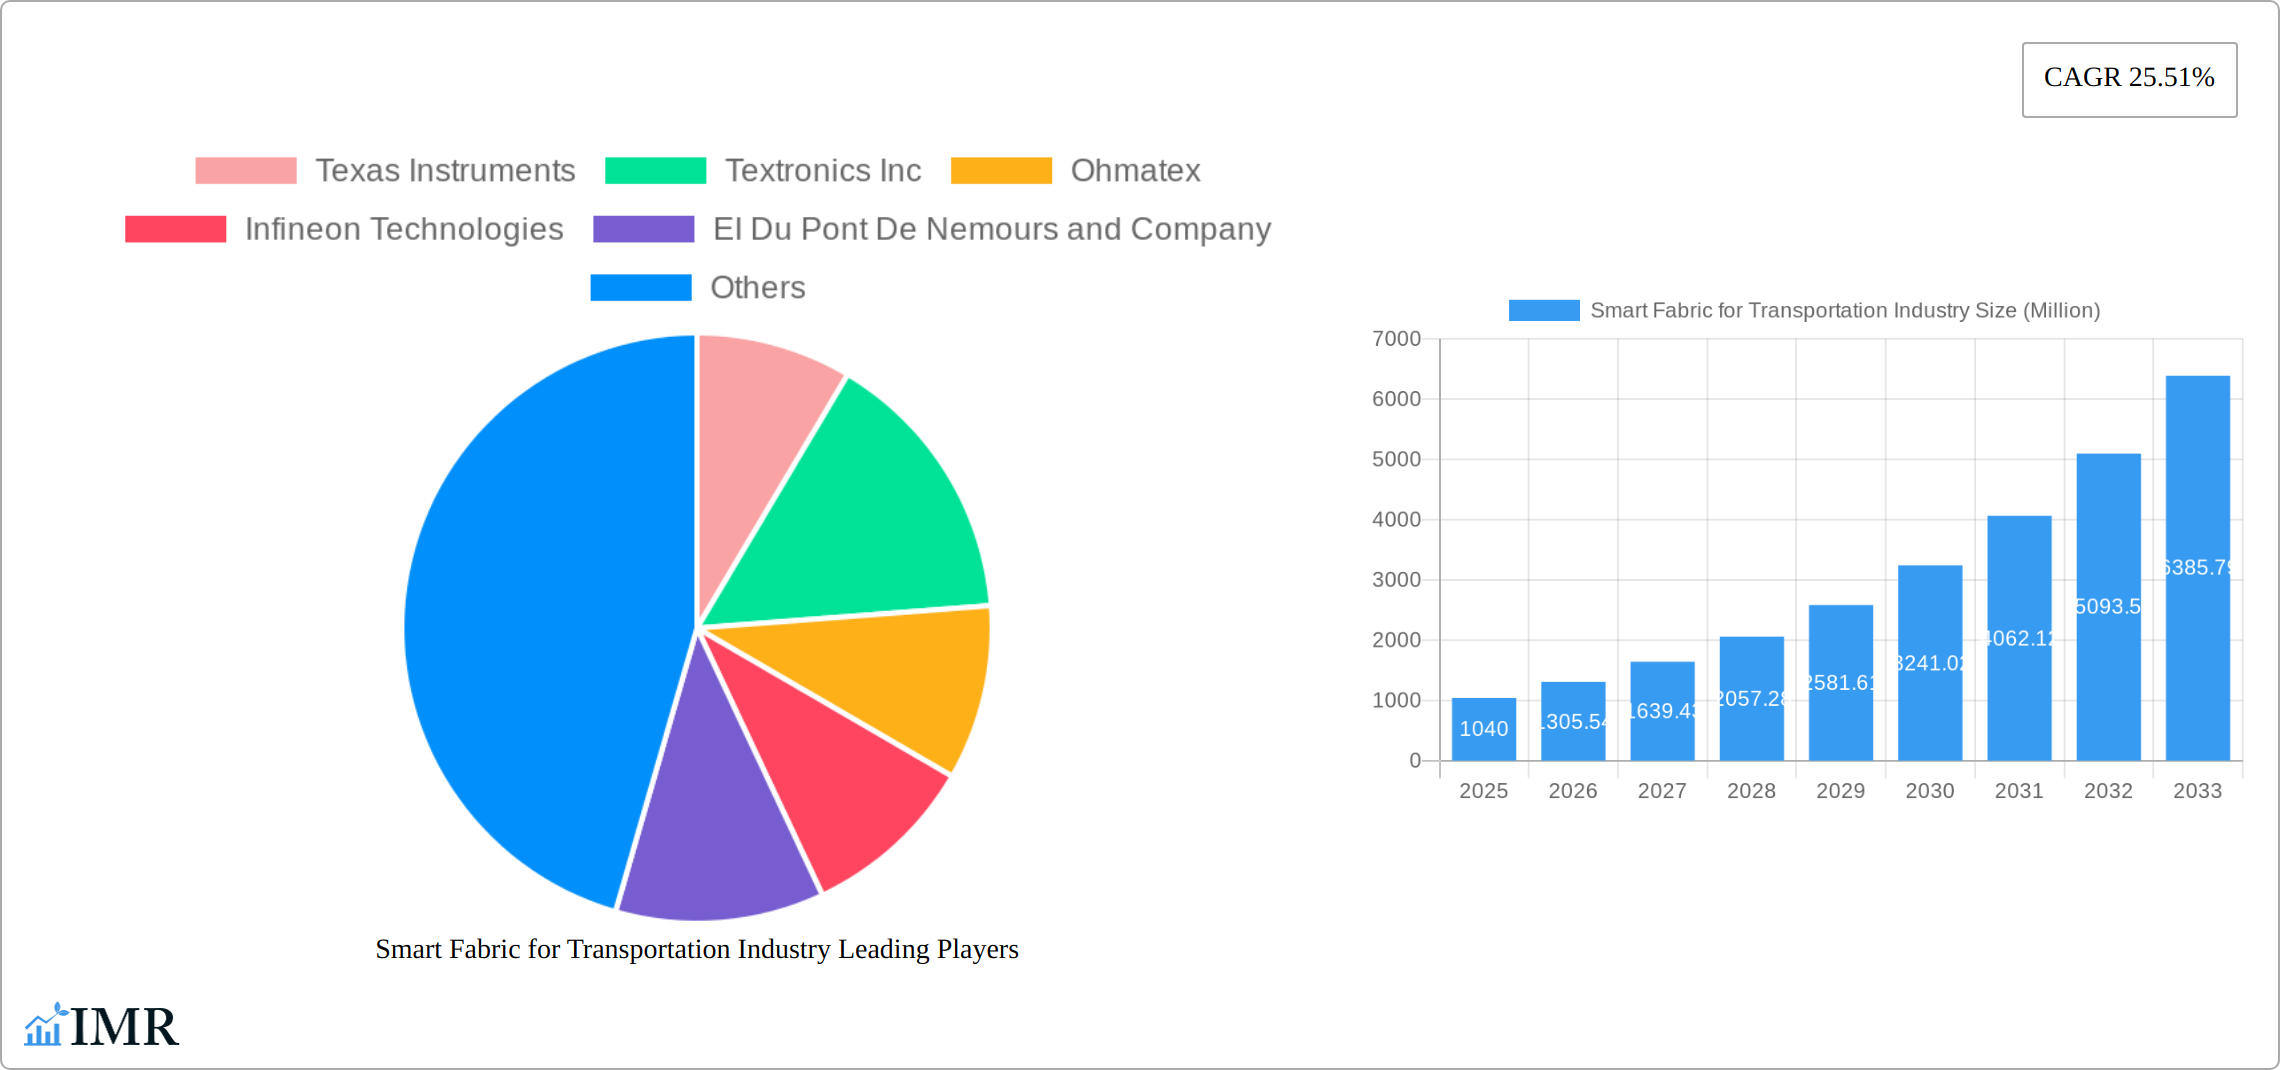
The smart fabric market for the transportation industry is experiencing robust growth, driven by increasing demand for enhanced safety, comfort, and advanced functionalities within vehicles. With a current market size of $1.04 billion in 2025 and a projected Compound Annual Growth Rate (CAGR) of 25.51% from 2025 to 2033, the market is poised for significant expansion. Key drivers include the rising adoption of electric vehicles (EVs) necessitating advanced thermal management solutions offered by smart fabrics, the increasing focus on driver and passenger safety features such as improved airbag systems and seatbelt technologies, and the growing demand for personalized in-vehicle experiences facilitated by smart textiles integrating infotainment and comfort adjustments. The integration of smart fabrics into automotive interiors, including carpets, heated seats, and advanced safety features, is a major contributor to this growth. Further expansion is propelled by the development of innovative materials like color-changing, light-emitting, and temperature-regulating fabrics, opening up possibilities for dynamic ambient lighting, enhanced comfort control, and improved energy efficiency.
Segment-wise, the automotive application segment dominates the market, followed by railways and aerospace, with significant potential for growth in shipping. The use of smart fabrics in automotive applications is likely to remain the largest segment due to the high volume of vehicle production. While material innovation is a key driver, challenges remain including the high initial cost of implementing smart fabric technologies and potential concerns regarding durability and maintenance. However, continuous advancements in material science and manufacturing processes are expected to mitigate these challenges, paving the way for wider adoption across different transportation sectors. Leading companies like Texas Instruments, Textronics Inc., and Kolon Glotech Inc. are actively involved in developing and commercializing these technologies, fueling competition and innovation within the market. Regional growth is expected to be strongest in Asia Pacific, driven by rapid industrialization and increasing automotive production in regions such as China and India, followed by North America and Europe.
Smart Fabric for Transportation Industry: A Comprehensive Market Report (2019-2033)
This comprehensive report provides an in-depth analysis of the Smart Fabric for Transportation Industry market, encompassing market dynamics, growth trends, regional dominance, product landscape, key challenges, emerging opportunities, and key players. The report covers the period 2019-2033, with a focus on the forecast period 2025-2033, using 2025 as the base year. The market size is projected in million units.
Smart Fabric for Transportation Industry Market Dynamics & Structure
The Smart Fabric for Transportation market is experiencing significant growth driven by technological advancements, increasing demand for enhanced safety and comfort features, and stricter environmental regulations. Market concentration is moderate, with several key players competing across various segments. Technological innovation, particularly in materials science and electronics miniaturization, remains a crucial driver. Regulatory frameworks concerning vehicle safety and sustainability are shaping product development and adoption. Competitive product substitutes include traditional materials, but the superior performance and functionalities of smart fabrics are driving market shift. The end-user demographic is expanding to include both luxury and mass-market vehicle segments, as well as various transportation modes like railways and aerospace. M&A activity is expected to increase, as larger companies seek to acquire smaller innovative players to expand their product portfolio and market share.
- Market Concentration: Moderate, with no single dominant player. Top 5 players hold approximately xx% market share (2025).
- Technological Innovation: Focus on lightweight, durable, and multifunctional fabrics with embedded sensors and actuators.
- Regulatory Frameworks: Increasing emphasis on safety and sustainability standards impacting material selection and manufacturing processes.
- Competitive Substitutes: Traditional materials like leather, cotton, and synthetic fibers.
- End-user Demographics: Expanding across various vehicle segments and transportation modes.
- M&A Trends: Consolidation expected, with larger companies acquiring smaller innovative firms. Estimated xx M&A deals in the forecast period.
Smart Fabric for Transportation Industry Growth Trends & Insights
The Smart Fabric for Transportation market is witnessing robust growth, propelled by increasing demand for advanced features in vehicles and other transportation sectors. The market size reached xx million units in 2024 and is projected to reach xx million units by 2033, exhibiting a CAGR of xx% during the forecast period. Adoption rates are increasing steadily, driven by factors like decreasing costs, improved performance characteristics, and rising consumer awareness. Technological disruptions, particularly in areas such as IoT integration and advanced material science, are continuously pushing the boundaries of smart fabric applications. Consumer behavior shifts towards increased preference for comfort, safety, and technologically advanced vehicles contribute to the market’s expansion.
- Market Size (Million Units): 2024: xx; 2033: xx
- CAGR (2025-2033): xx%
- Market Penetration: xx% in 2025, projected to reach xx% by 2033.

Dominant Regions, Countries, or Segments in Smart Fabric for Transportation Industry
North America, particularly the US, currently holds the largest market share in the smart fabric for transportation industry. Strong automotive manufacturing and technological advancement are key drivers. Within segments, the automobile interior carpets segment is currently leading with xx million units, followed by automotive airbags with xx million units. The high growth potential is seen in the "Light Emitting Materials" (particularly LEDs) segment due to growing demand for aesthetically pleasing and informative interior designs. The application of smart fabrics in automotive safety and security is also a rapidly growing sector.
- Leading Region: North America (US)
- Dominant Segment (By Component): Automobile Interior Carpets
- High-Growth Segment (By Material): Light Emitting Materials (LEDs)
- Key Driver (By Application): Safety and Security
- Key Regional Drivers: Strong automotive manufacturing base in North America and Europe. Growing infrastructure investment in Asia-Pacific driving the railway and shipping applications.
Smart Fabric for Transportation Industry Product Landscape
Smart fabrics for transportation applications are characterized by their integration of advanced functionalities into lightweight, durable materials. These include embedded sensors for monitoring conditions, actuators for adjusting properties like temperature, and conductive materials for power and data transmission. Unique selling propositions include improved safety, increased comfort, and enhanced aesthetics. Continuous innovation leads to improved performance, such as higher sensitivity in sensors, faster response times in actuators, and increased durability of the overall material.
Key Drivers, Barriers & Challenges in Smart Fabric for Transportation Industry
Key Drivers:
- Technological advancements in materials science and electronics miniaturization.
- Increasing demand for enhanced safety and comfort features in vehicles.
- Stricter environmental regulations promoting sustainable materials.
Challenges:
- High initial investment costs associated with development and manufacturing.
- Supply chain complexities associated with sourcing specialized materials.
- Regulatory hurdles and safety certifications requirements.
- Competitive pressure from traditional materials and emerging technologies. (Estimated impact: xx% reduction in market growth in the next 5 years).
Emerging Opportunities in Smart Fabric for Transportation Industry
- Expansion into new transportation modes like autonomous vehicles and urban air mobility.
- Development of smart fabrics with integrated health monitoring capabilities.
- Growing demand for customized and personalized in-vehicle experiences.
- Integration with AI and machine learning for enhanced functionalities and user interactions.
Growth Accelerators in the Smart Fabric for Transportation Industry
Long-term growth will be propelled by technological breakthroughs in material science, allowing for more multifunctional and cost-effective smart fabrics. Strategic partnerships between material suppliers, electronics manufacturers, and automotive companies will play a vital role in accelerating adoption. Market expansion into emerging economies with growing vehicle markets will unlock significant growth potential.
Key Players Shaping the Smart Fabric for Transportation Industry Market
- Texas Instruments
- Textronics Inc
- Ohmatex
- Infineon Technologies
- EI Du Pont De Nemours and Company
- AIQ Smart Clothing Inc
- Sensoria Inc
- Kolon Glotech Inc
- Schoeller Textil AG
- Interactive Wear AG
Notable Milestones in Smart Fabric for Transportation Industry Sector
- March 2023: Apple patents a smart fabric lighting system for vehicle interiors.
- November 2022: Autoneum introduces a 100% recyclable polyester carpet for vehicles.
In-Depth Smart Fabric for Transportation Industry Market Outlook
The Smart Fabric for Transportation market holds significant future potential. Continued technological advancements, coupled with increasing consumer demand for enhanced vehicle features and sustainability, will drive strong growth. Strategic investments in research and development, coupled with strategic partnerships, will be crucial for companies to capitalize on this growing market. The market’s long-term outlook is positive, with ample opportunities for innovation and expansion across various transportation sectors.
Smart Fabric for Transportation Industry Segmentation
-
1. Component
- 1.1. Automobile Interior Carpets
- 1.2. Automotive Airbags
- 1.3. Seat Belt Webbings
- 1.4. Heated Seats
- 1.5. Nylon Tire Cord Fabrics
-
2. Material
- 2.1. Color Ch
- 2.2. Light Em
- 2.3. Moving M
- 2.4. Temperat
-
3. Application
- 3.1. Mobility Management
- 3.2. Vehicle Management
- 3.3. Safety and Security
- 3.4. Passenger Information System
-
4. End-user Industry
- 4.1. Automobiles
- 4.2. Shipping
- 4.3. Railways
- 4.4. Aerospace
Smart Fabric for Transportation Industry Segmentation By Geography
- 1. North America
- 2. Europe
- 3. Asia
- 4. Latin America
- 5. Middle East and Africa

Smart Fabric for Transportation Industry REPORT HIGHLIGHTS
| Aspects | Details |
|---|---|
| Study Period | 2019-2033 |
| Base Year | 2024 |
| Estimated Year | 2025 |
| Forecast Period | 2025-2033 |
| Historical Period | 2019-2024 |
| Growth Rate | CAGR of 25.51% from 2019-2033 |
| Segmentation |
|
Table of Contents
- 1. Introduction
- 1.1. Research Scope
- 1.2. Market Segmentation
- 1.3. Research Methodology
- 1.4. Definitions and Assumptions
- 2. Executive Summary
- 2.1. Introduction
- 3. Market Dynamics
- 3.1. Introduction
- 3.2. Market Drivers
- 3.2.1. Increasing Number of Connected Cars and Heavy Vehicles; Miniaturization of Electronic Components; Increasing Safety and Security Concerns in Transportation
- 3.3. Market Restrains
- 3.3.1. Slow Penetration Rate in Developing Countries; Lack of Funding and Capital Expenditure
- 3.4. Market Trends
- 3.4.1. Mobility Management to Witness Significantly High Growth Rate
- 4. Market Factor Analysis
- 4.1. Porters Five Forces
- 4.2. Supply/Value Chain
- 4.3. PESTEL analysis
- 4.4. Market Entropy
- 4.5. Patent/Trademark Analysis
- 5. Global Smart Fabric for Transportation Industry Analysis, Insights and Forecast, 2019-2031
- 5.1. Market Analysis, Insights and Forecast - by Component
- 5.1.1. Automobile Interior Carpets
- 5.1.2. Automotive Airbags
- 5.1.3. Seat Belt Webbings
- 5.1.4. Heated Seats
- 5.1.5. Nylon Tire Cord Fabrics
- 5.2. Market Analysis, Insights and Forecast - by Material
- 5.2.1. Color Ch
- 5.2.2. Light Em
- 5.2.3. Moving M
- 5.2.4. Temperat
- 5.3. Market Analysis, Insights and Forecast - by Application
- 5.3.1. Mobility Management
- 5.3.2. Vehicle Management
- 5.3.3. Safety and Security
- 5.3.4. Passenger Information System
- 5.4. Market Analysis, Insights and Forecast - by End-user Industry
- 5.4.1. Automobiles
- 5.4.2. Shipping
- 5.4.3. Railways
- 5.4.4. Aerospace
- 5.5. Market Analysis, Insights and Forecast - by Region
- 5.5.1. North America
- 5.5.2. Europe
- 5.5.3. Asia
- 5.5.4. Latin America
- 5.5.5. Middle East and Africa
- 5.1. Market Analysis, Insights and Forecast - by Component
- 6. North America Smart Fabric for Transportation Industry Analysis, Insights and Forecast, 2019-2031
- 6.1. Market Analysis, Insights and Forecast - by Component
- 6.1.1. Automobile Interior Carpets
- 6.1.2. Automotive Airbags
- 6.1.3. Seat Belt Webbings
- 6.1.4. Heated Seats
- 6.1.5. Nylon Tire Cord Fabrics
- 6.2. Market Analysis, Insights and Forecast - by Material
- 6.2.1. Color Ch
- 6.2.2. Light Em
- 6.2.3. Moving M
- 6.2.4. Temperat
- 6.3. Market Analysis, Insights and Forecast - by Application
- 6.3.1. Mobility Management
- 6.3.2. Vehicle Management
- 6.3.3. Safety and Security
- 6.3.4. Passenger Information System
- 6.4. Market Analysis, Insights and Forecast - by End-user Industry
- 6.4.1. Automobiles
- 6.4.2. Shipping
- 6.4.3. Railways
- 6.4.4. Aerospace
- 6.1. Market Analysis, Insights and Forecast - by Component
- 7. Europe Smart Fabric for Transportation Industry Analysis, Insights and Forecast, 2019-2031
- 7.1. Market Analysis, Insights and Forecast - by Component
- 7.1.1. Automobile Interior Carpets
- 7.1.2. Automotive Airbags
- 7.1.3. Seat Belt Webbings
- 7.1.4. Heated Seats
- 7.1.5. Nylon Tire Cord Fabrics
- 7.2. Market Analysis, Insights and Forecast - by Material
- 7.2.1. Color Ch
- 7.2.2. Light Em
- 7.2.3. Moving M
- 7.2.4. Temperat
- 7.3. Market Analysis, Insights and Forecast - by Application
- 7.3.1. Mobility Management
- 7.3.2. Vehicle Management
- 7.3.3. Safety and Security
- 7.3.4. Passenger Information System
- 7.4. Market Analysis, Insights and Forecast - by End-user Industry
- 7.4.1. Automobiles
- 7.4.2. Shipping
- 7.4.3. Railways
- 7.4.4. Aerospace
- 7.1. Market Analysis, Insights and Forecast - by Component
- 8. Asia Smart Fabric for Transportation Industry Analysis, Insights and Forecast, 2019-2031
- 8.1. Market Analysis, Insights and Forecast - by Component
- 8.1.1. Automobile Interior Carpets
- 8.1.2. Automotive Airbags
- 8.1.3. Seat Belt Webbings
- 8.1.4. Heated Seats
- 8.1.5. Nylon Tire Cord Fabrics
- 8.2. Market Analysis, Insights and Forecast - by Material
- 8.2.1. Color Ch
- 8.2.2. Light Em
- 8.2.3. Moving M
- 8.2.4. Temperat
- 8.3. Market Analysis, Insights and Forecast - by Application
- 8.3.1. Mobility Management
- 8.3.2. Vehicle Management
- 8.3.3. Safety and Security
- 8.3.4. Passenger Information System
- 8.4. Market Analysis, Insights and Forecast - by End-user Industry
- 8.4.1. Automobiles
- 8.4.2. Shipping
- 8.4.3. Railways
- 8.4.4. Aerospace
- 8.1. Market Analysis, Insights and Forecast - by Component
- 9. Latin America Smart Fabric for Transportation Industry Analysis, Insights and Forecast, 2019-2031
- 9.1. Market Analysis, Insights and Forecast - by Component
- 9.1.1. Automobile Interior Carpets
- 9.1.2. Automotive Airbags
- 9.1.3. Seat Belt Webbings
- 9.1.4. Heated Seats
- 9.1.5. Nylon Tire Cord Fabrics
- 9.2. Market Analysis, Insights and Forecast - by Material
- 9.2.1. Color Ch
- 9.2.2. Light Em
- 9.2.3. Moving M
- 9.2.4. Temperat
- 9.3. Market Analysis, Insights and Forecast - by Application
- 9.3.1. Mobility Management
- 9.3.2. Vehicle Management
- 9.3.3. Safety and Security
- 9.3.4. Passenger Information System
- 9.4. Market Analysis, Insights and Forecast - by End-user Industry
- 9.4.1. Automobiles
- 9.4.2. Shipping
- 9.4.3. Railways
- 9.4.4. Aerospace
- 9.1. Market Analysis, Insights and Forecast - by Component
- 10. Middle East and Africa Smart Fabric for Transportation Industry Analysis, Insights and Forecast, 2019-2031
- 10.1. Market Analysis, Insights and Forecast - by Component
- 10.1.1. Automobile Interior Carpets
- 10.1.2. Automotive Airbags
- 10.1.3. Seat Belt Webbings
- 10.1.4. Heated Seats
- 10.1.5. Nylon Tire Cord Fabrics
- 10.2. Market Analysis, Insights and Forecast - by Material
- 10.2.1. Color Ch
- 10.2.2. Light Em
- 10.2.3. Moving M
- 10.2.4. Temperat
- 10.3. Market Analysis, Insights and Forecast - by Application
- 10.3.1. Mobility Management
- 10.3.2. Vehicle Management
- 10.3.3. Safety and Security
- 10.3.4. Passenger Information System
- 10.4. Market Analysis, Insights and Forecast - by End-user Industry
- 10.4.1. Automobiles
- 10.4.2. Shipping
- 10.4.3. Railways
- 10.4.4. Aerospace
- 10.1. Market Analysis, Insights and Forecast - by Component
- 11. North America Smart Fabric for Transportation Industry Analysis, Insights and Forecast, 2019-2031
- 11.1. Market Analysis, Insights and Forecast - By Country/Sub-region
- 11.1.1 United States
- 11.1.2 Canada
- 11.1.3 Mexico
- 12. Europe Smart Fabric for Transportation Industry Analysis, Insights and Forecast, 2019-2031
- 12.1. Market Analysis, Insights and Forecast - By Country/Sub-region
- 12.1.1 Germany
- 12.1.2 United Kingdom
- 12.1.3 France
- 12.1.4 Spain
- 12.1.5 Italy
- 12.1.6 Spain
- 12.1.7 Belgium
- 12.1.8 Netherland
- 12.1.9 Nordics
- 12.1.10 Rest of Europe
- 13. Asia Pacific Smart Fabric for Transportation Industry Analysis, Insights and Forecast, 2019-2031
- 13.1. Market Analysis, Insights and Forecast - By Country/Sub-region
- 13.1.1 China
- 13.1.2 Japan
- 13.1.3 India
- 13.1.4 South Korea
- 13.1.5 Southeast Asia
- 13.1.6 Australia
- 13.1.7 Indonesia
- 13.1.8 Phillipes
- 13.1.9 Singapore
- 13.1.10 Thailandc
- 13.1.11 Rest of Asia Pacific
- 14. South America Smart Fabric for Transportation Industry Analysis, Insights and Forecast, 2019-2031
- 14.1. Market Analysis, Insights and Forecast - By Country/Sub-region
- 14.1.1 Brazil
- 14.1.2 Argentina
- 14.1.3 Peru
- 14.1.4 Chile
- 14.1.5 Colombia
- 14.1.6 Ecuador
- 14.1.7 Venezuela
- 14.1.8 Rest of South America
- 15. North America Smart Fabric for Transportation Industry Analysis, Insights and Forecast, 2019-2031
- 15.1. Market Analysis, Insights and Forecast - By Country/Sub-region
- 15.1.1 United States
- 15.1.2 Canada
- 15.1.3 Mexico
- 16. MEA Smart Fabric for Transportation Industry Analysis, Insights and Forecast, 2019-2031
- 16.1. Market Analysis, Insights and Forecast - By Country/Sub-region
- 16.1.1 United Arab Emirates
- 16.1.2 Saudi Arabia
- 16.1.3 South Africa
- 16.1.4 Rest of Middle East and Africa
- 17. Competitive Analysis
- 17.1. Global Market Share Analysis 2024
- 17.2. Company Profiles
- 17.2.1 Texas Instruments
- 17.2.1.1. Overview
- 17.2.1.2. Products
- 17.2.1.3. SWOT Analysis
- 17.2.1.4. Recent Developments
- 17.2.1.5. Financials (Based on Availability)
- 17.2.2 Textronics Inc
- 17.2.2.1. Overview
- 17.2.2.2. Products
- 17.2.2.3. SWOT Analysis
- 17.2.2.4. Recent Developments
- 17.2.2.5. Financials (Based on Availability)
- 17.2.3 Ohmatex
- 17.2.3.1. Overview
- 17.2.3.2. Products
- 17.2.3.3. SWOT Analysis
- 17.2.3.4. Recent Developments
- 17.2.3.5. Financials (Based on Availability)
- 17.2.4 Infineon Technologies
- 17.2.4.1. Overview
- 17.2.4.2. Products
- 17.2.4.3. SWOT Analysis
- 17.2.4.4. Recent Developments
- 17.2.4.5. Financials (Based on Availability)
- 17.2.5 EI Du Pont De Nemours and Company
- 17.2.5.1. Overview
- 17.2.5.2. Products
- 17.2.5.3. SWOT Analysis
- 17.2.5.4. Recent Developments
- 17.2.5.5. Financials (Based on Availability)
- 17.2.6 AIQ Smart Clothing Inc
- 17.2.6.1. Overview
- 17.2.6.2. Products
- 17.2.6.3. SWOT Analysis
- 17.2.6.4. Recent Developments
- 17.2.6.5. Financials (Based on Availability)
- 17.2.7 Sensoria Inc
- 17.2.7.1. Overview
- 17.2.7.2. Products
- 17.2.7.3. SWOT Analysis
- 17.2.7.4. Recent Developments
- 17.2.7.5. Financials (Based on Availability)
- 17.2.8 Kolon Glotech Inc
- 17.2.8.1. Overview
- 17.2.8.2. Products
- 17.2.8.3. SWOT Analysis
- 17.2.8.4. Recent Developments
- 17.2.8.5. Financials (Based on Availability)
- 17.2.9 Schoeller Textil AG
- 17.2.9.1. Overview
- 17.2.9.2. Products
- 17.2.9.3. SWOT Analysis
- 17.2.9.4. Recent Developments
- 17.2.9.5. Financials (Based on Availability)
- 17.2.10 Interactive Wear AG
- 17.2.10.1. Overview
- 17.2.10.2. Products
- 17.2.10.3. SWOT Analysis
- 17.2.10.4. Recent Developments
- 17.2.10.5. Financials (Based on Availability)
- 17.2.1 Texas Instruments
List of Figures
- Figure 1: Global Smart Fabric for Transportation Industry Revenue Breakdown (Million, %) by Region 2024 & 2032
- Figure 2: Global Smart Fabric for Transportation Industry Volume Breakdown (K Unit, %) by Region 2024 & 2032
- Figure 3: North America Smart Fabric for Transportation Industry Revenue (Million), by Country 2024 & 2032
- Figure 4: North America Smart Fabric for Transportation Industry Volume (K Unit), by Country 2024 & 2032
- Figure 5: North America Smart Fabric for Transportation Industry Revenue Share (%), by Country 2024 & 2032
- Figure 6: North America Smart Fabric for Transportation Industry Volume Share (%), by Country 2024 & 2032
- Figure 7: Europe Smart Fabric for Transportation Industry Revenue (Million), by Country 2024 & 2032
- Figure 8: Europe Smart Fabric for Transportation Industry Volume (K Unit), by Country 2024 & 2032
- Figure 9: Europe Smart Fabric for Transportation Industry Revenue Share (%), by Country 2024 & 2032
- Figure 10: Europe Smart Fabric for Transportation Industry Volume Share (%), by Country 2024 & 2032
- Figure 11: Asia Pacific Smart Fabric for Transportation Industry Revenue (Million), by Country 2024 & 2032
- Figure 12: Asia Pacific Smart Fabric for Transportation Industry Volume (K Unit), by Country 2024 & 2032
- Figure 13: Asia Pacific Smart Fabric for Transportation Industry Revenue Share (%), by Country 2024 & 2032
- Figure 14: Asia Pacific Smart Fabric for Transportation Industry Volume Share (%), by Country 2024 & 2032
- Figure 15: South America Smart Fabric for Transportation Industry Revenue (Million), by Country 2024 & 2032
- Figure 16: South America Smart Fabric for Transportation Industry Volume (K Unit), by Country 2024 & 2032
- Figure 17: South America Smart Fabric for Transportation Industry Revenue Share (%), by Country 2024 & 2032
- Figure 18: South America Smart Fabric for Transportation Industry Volume Share (%), by Country 2024 & 2032
- Figure 19: North America Smart Fabric for Transportation Industry Revenue (Million), by Country 2024 & 2032
- Figure 20: North America Smart Fabric for Transportation Industry Volume (K Unit), by Country 2024 & 2032
- Figure 21: North America Smart Fabric for Transportation Industry Revenue Share (%), by Country 2024 & 2032
- Figure 22: North America Smart Fabric for Transportation Industry Volume Share (%), by Country 2024 & 2032
- Figure 23: MEA Smart Fabric for Transportation Industry Revenue (Million), by Country 2024 & 2032
- Figure 24: MEA Smart Fabric for Transportation Industry Volume (K Unit), by Country 2024 & 2032
- Figure 25: MEA Smart Fabric for Transportation Industry Revenue Share (%), by Country 2024 & 2032
- Figure 26: MEA Smart Fabric for Transportation Industry Volume Share (%), by Country 2024 & 2032
- Figure 27: North America Smart Fabric for Transportation Industry Revenue (Million), by Component 2024 & 2032
- Figure 28: North America Smart Fabric for Transportation Industry Volume (K Unit), by Component 2024 & 2032
- Figure 29: North America Smart Fabric for Transportation Industry Revenue Share (%), by Component 2024 & 2032
- Figure 30: North America Smart Fabric for Transportation Industry Volume Share (%), by Component 2024 & 2032
- Figure 31: North America Smart Fabric for Transportation Industry Revenue (Million), by Material 2024 & 2032
- Figure 32: North America Smart Fabric for Transportation Industry Volume (K Unit), by Material 2024 & 2032
- Figure 33: North America Smart Fabric for Transportation Industry Revenue Share (%), by Material 2024 & 2032
- Figure 34: North America Smart Fabric for Transportation Industry Volume Share (%), by Material 2024 & 2032
- Figure 35: North America Smart Fabric for Transportation Industry Revenue (Million), by Application 2024 & 2032
- Figure 36: North America Smart Fabric for Transportation Industry Volume (K Unit), by Application 2024 & 2032
- Figure 37: North America Smart Fabric for Transportation Industry Revenue Share (%), by Application 2024 & 2032
- Figure 38: North America Smart Fabric for Transportation Industry Volume Share (%), by Application 2024 & 2032
- Figure 39: North America Smart Fabric for Transportation Industry Revenue (Million), by End-user Industry 2024 & 2032
- Figure 40: North America Smart Fabric for Transportation Industry Volume (K Unit), by End-user Industry 2024 & 2032
- Figure 41: North America Smart Fabric for Transportation Industry Revenue Share (%), by End-user Industry 2024 & 2032
- Figure 42: North America Smart Fabric for Transportation Industry Volume Share (%), by End-user Industry 2024 & 2032
- Figure 43: North America Smart Fabric for Transportation Industry Revenue (Million), by Country 2024 & 2032
- Figure 44: North America Smart Fabric for Transportation Industry Volume (K Unit), by Country 2024 & 2032
- Figure 45: North America Smart Fabric for Transportation Industry Revenue Share (%), by Country 2024 & 2032
- Figure 46: North America Smart Fabric for Transportation Industry Volume Share (%), by Country 2024 & 2032
- Figure 47: Europe Smart Fabric for Transportation Industry Revenue (Million), by Component 2024 & 2032
- Figure 48: Europe Smart Fabric for Transportation Industry Volume (K Unit), by Component 2024 & 2032
- Figure 49: Europe Smart Fabric for Transportation Industry Revenue Share (%), by Component 2024 & 2032
- Figure 50: Europe Smart Fabric for Transportation Industry Volume Share (%), by Component 2024 & 2032
- Figure 51: Europe Smart Fabric for Transportation Industry Revenue (Million), by Material 2024 & 2032
- Figure 52: Europe Smart Fabric for Transportation Industry Volume (K Unit), by Material 2024 & 2032
- Figure 53: Europe Smart Fabric for Transportation Industry Revenue Share (%), by Material 2024 & 2032
- Figure 54: Europe Smart Fabric for Transportation Industry Volume Share (%), by Material 2024 & 2032
- Figure 55: Europe Smart Fabric for Transportation Industry Revenue (Million), by Application 2024 & 2032
- Figure 56: Europe Smart Fabric for Transportation Industry Volume (K Unit), by Application 2024 & 2032
- Figure 57: Europe Smart Fabric for Transportation Industry Revenue Share (%), by Application 2024 & 2032
- Figure 58: Europe Smart Fabric for Transportation Industry Volume Share (%), by Application 2024 & 2032
- Figure 59: Europe Smart Fabric for Transportation Industry Revenue (Million), by End-user Industry 2024 & 2032
- Figure 60: Europe Smart Fabric for Transportation Industry Volume (K Unit), by End-user Industry 2024 & 2032
- Figure 61: Europe Smart Fabric for Transportation Industry Revenue Share (%), by End-user Industry 2024 & 2032
- Figure 62: Europe Smart Fabric for Transportation Industry Volume Share (%), by End-user Industry 2024 & 2032
- Figure 63: Europe Smart Fabric for Transportation Industry Revenue (Million), by Country 2024 & 2032
- Figure 64: Europe Smart Fabric for Transportation Industry Volume (K Unit), by Country 2024 & 2032
- Figure 65: Europe Smart Fabric for Transportation Industry Revenue Share (%), by Country 2024 & 2032
- Figure 66: Europe Smart Fabric for Transportation Industry Volume Share (%), by Country 2024 & 2032
- Figure 67: Asia Smart Fabric for Transportation Industry Revenue (Million), by Component 2024 & 2032
- Figure 68: Asia Smart Fabric for Transportation Industry Volume (K Unit), by Component 2024 & 2032
- Figure 69: Asia Smart Fabric for Transportation Industry Revenue Share (%), by Component 2024 & 2032
- Figure 70: Asia Smart Fabric for Transportation Industry Volume Share (%), by Component 2024 & 2032
- Figure 71: Asia Smart Fabric for Transportation Industry Revenue (Million), by Material 2024 & 2032
- Figure 72: Asia Smart Fabric for Transportation Industry Volume (K Unit), by Material 2024 & 2032
- Figure 73: Asia Smart Fabric for Transportation Industry Revenue Share (%), by Material 2024 & 2032
- Figure 74: Asia Smart Fabric for Transportation Industry Volume Share (%), by Material 2024 & 2032
- Figure 75: Asia Smart Fabric for Transportation Industry Revenue (Million), by Application 2024 & 2032
- Figure 76: Asia Smart Fabric for Transportation Industry Volume (K Unit), by Application 2024 & 2032
- Figure 77: Asia Smart Fabric for Transportation Industry Revenue Share (%), by Application 2024 & 2032
- Figure 78: Asia Smart Fabric for Transportation Industry Volume Share (%), by Application 2024 & 2032
- Figure 79: Asia Smart Fabric for Transportation Industry Revenue (Million), by End-user Industry 2024 & 2032
- Figure 80: Asia Smart Fabric for Transportation Industry Volume (K Unit), by End-user Industry 2024 & 2032
- Figure 81: Asia Smart Fabric for Transportation Industry Revenue Share (%), by End-user Industry 2024 & 2032
- Figure 82: Asia Smart Fabric for Transportation Industry Volume Share (%), by End-user Industry 2024 & 2032
- Figure 83: Asia Smart Fabric for Transportation Industry Revenue (Million), by Country 2024 & 2032
- Figure 84: Asia Smart Fabric for Transportation Industry Volume (K Unit), by Country 2024 & 2032
- Figure 85: Asia Smart Fabric for Transportation Industry Revenue Share (%), by Country 2024 & 2032
- Figure 86: Asia Smart Fabric for Transportation Industry Volume Share (%), by Country 2024 & 2032
- Figure 87: Latin America Smart Fabric for Transportation Industry Revenue (Million), by Component 2024 & 2032
- Figure 88: Latin America Smart Fabric for Transportation Industry Volume (K Unit), by Component 2024 & 2032
- Figure 89: Latin America Smart Fabric for Transportation Industry Revenue Share (%), by Component 2024 & 2032
- Figure 90: Latin America Smart Fabric for Transportation Industry Volume Share (%), by Component 2024 & 2032
- Figure 91: Latin America Smart Fabric for Transportation Industry Revenue (Million), by Material 2024 & 2032
- Figure 92: Latin America Smart Fabric for Transportation Industry Volume (K Unit), by Material 2024 & 2032
- Figure 93: Latin America Smart Fabric for Transportation Industry Revenue Share (%), by Material 2024 & 2032
- Figure 94: Latin America Smart Fabric for Transportation Industry Volume Share (%), by Material 2024 & 2032
- Figure 95: Latin America Smart Fabric for Transportation Industry Revenue (Million), by Application 2024 & 2032
- Figure 96: Latin America Smart Fabric for Transportation Industry Volume (K Unit), by Application 2024 & 2032
- Figure 97: Latin America Smart Fabric for Transportation Industry Revenue Share (%), by Application 2024 & 2032
- Figure 98: Latin America Smart Fabric for Transportation Industry Volume Share (%), by Application 2024 & 2032
- Figure 99: Latin America Smart Fabric for Transportation Industry Revenue (Million), by End-user Industry 2024 & 2032
- Figure 100: Latin America Smart Fabric for Transportation Industry Volume (K Unit), by End-user Industry 2024 & 2032
- Figure 101: Latin America Smart Fabric for Transportation Industry Revenue Share (%), by End-user Industry 2024 & 2032
- Figure 102: Latin America Smart Fabric for Transportation Industry Volume Share (%), by End-user Industry 2024 & 2032
- Figure 103: Latin America Smart Fabric for Transportation Industry Revenue (Million), by Country 2024 & 2032
- Figure 104: Latin America Smart Fabric for Transportation Industry Volume (K Unit), by Country 2024 & 2032
- Figure 105: Latin America Smart Fabric for Transportation Industry Revenue Share (%), by Country 2024 & 2032
- Figure 106: Latin America Smart Fabric for Transportation Industry Volume Share (%), by Country 2024 & 2032
- Figure 107: Middle East and Africa Smart Fabric for Transportation Industry Revenue (Million), by Component 2024 & 2032
- Figure 108: Middle East and Africa Smart Fabric for Transportation Industry Volume (K Unit), by Component 2024 & 2032
- Figure 109: Middle East and Africa Smart Fabric for Transportation Industry Revenue Share (%), by Component 2024 & 2032
- Figure 110: Middle East and Africa Smart Fabric for Transportation Industry Volume Share (%), by Component 2024 & 2032
- Figure 111: Middle East and Africa Smart Fabric for Transportation Industry Revenue (Million), by Material 2024 & 2032
- Figure 112: Middle East and Africa Smart Fabric for Transportation Industry Volume (K Unit), by Material 2024 & 2032
- Figure 113: Middle East and Africa Smart Fabric for Transportation Industry Revenue Share (%), by Material 2024 & 2032
- Figure 114: Middle East and Africa Smart Fabric for Transportation Industry Volume Share (%), by Material 2024 & 2032
- Figure 115: Middle East and Africa Smart Fabric for Transportation Industry Revenue (Million), by Application 2024 & 2032
- Figure 116: Middle East and Africa Smart Fabric for Transportation Industry Volume (K Unit), by Application 2024 & 2032
- Figure 117: Middle East and Africa Smart Fabric for Transportation Industry Revenue Share (%), by Application 2024 & 2032
- Figure 118: Middle East and Africa Smart Fabric for Transportation Industry Volume Share (%), by Application 2024 & 2032
- Figure 119: Middle East and Africa Smart Fabric for Transportation Industry Revenue (Million), by End-user Industry 2024 & 2032
- Figure 120: Middle East and Africa Smart Fabric for Transportation Industry Volume (K Unit), by End-user Industry 2024 & 2032
- Figure 121: Middle East and Africa Smart Fabric for Transportation Industry Revenue Share (%), by End-user Industry 2024 & 2032
- Figure 122: Middle East and Africa Smart Fabric for Transportation Industry Volume Share (%), by End-user Industry 2024 & 2032
- Figure 123: Middle East and Africa Smart Fabric for Transportation Industry Revenue (Million), by Country 2024 & 2032
- Figure 124: Middle East and Africa Smart Fabric for Transportation Industry Volume (K Unit), by Country 2024 & 2032
- Figure 125: Middle East and Africa Smart Fabric for Transportation Industry Revenue Share (%), by Country 2024 & 2032
- Figure 126: Middle East and Africa Smart Fabric for Transportation Industry Volume Share (%), by Country 2024 & 2032
List of Tables
- Table 1: Global Smart Fabric for Transportation Industry Revenue Million Forecast, by Region 2019 & 2032
- Table 2: Global Smart Fabric for Transportation Industry Volume K Unit Forecast, by Region 2019 & 2032
- Table 3: Global Smart Fabric for Transportation Industry Revenue Million Forecast, by Component 2019 & 2032
- Table 4: Global Smart Fabric for Transportation Industry Volume K Unit Forecast, by Component 2019 & 2032
- Table 5: Global Smart Fabric for Transportation Industry Revenue Million Forecast, by Material 2019 & 2032
- Table 6: Global Smart Fabric for Transportation Industry Volume K Unit Forecast, by Material 2019 & 2032
- Table 7: Global Smart Fabric for Transportation Industry Revenue Million Forecast, by Application 2019 & 2032
- Table 8: Global Smart Fabric for Transportation Industry Volume K Unit Forecast, by Application 2019 & 2032
- Table 9: Global Smart Fabric for Transportation Industry Revenue Million Forecast, by End-user Industry 2019 & 2032
- Table 10: Global Smart Fabric for Transportation Industry Volume K Unit Forecast, by End-user Industry 2019 & 2032
- Table 11: Global Smart Fabric for Transportation Industry Revenue Million Forecast, by Region 2019 & 2032
- Table 12: Global Smart Fabric for Transportation Industry Volume K Unit Forecast, by Region 2019 & 2032
- Table 13: Global Smart Fabric for Transportation Industry Revenue Million Forecast, by Country 2019 & 2032
- Table 14: Global Smart Fabric for Transportation Industry Volume K Unit Forecast, by Country 2019 & 2032
- Table 15: United States Smart Fabric for Transportation Industry Revenue (Million) Forecast, by Application 2019 & 2032
- Table 16: United States Smart Fabric for Transportation Industry Volume (K Unit) Forecast, by Application 2019 & 2032
- Table 17: Canada Smart Fabric for Transportation Industry Revenue (Million) Forecast, by Application 2019 & 2032
- Table 18: Canada Smart Fabric for Transportation Industry Volume (K Unit) Forecast, by Application 2019 & 2032
- Table 19: Mexico Smart Fabric for Transportation Industry Revenue (Million) Forecast, by Application 2019 & 2032
- Table 20: Mexico Smart Fabric for Transportation Industry Volume (K Unit) Forecast, by Application 2019 & 2032
- Table 21: Global Smart Fabric for Transportation Industry Revenue Million Forecast, by Country 2019 & 2032
- Table 22: Global Smart Fabric for Transportation Industry Volume K Unit Forecast, by Country 2019 & 2032
- Table 23: Germany Smart Fabric for Transportation Industry Revenue (Million) Forecast, by Application 2019 & 2032
- Table 24: Germany Smart Fabric for Transportation Industry Volume (K Unit) Forecast, by Application 2019 & 2032
- Table 25: United Kingdom Smart Fabric for Transportation Industry Revenue (Million) Forecast, by Application 2019 & 2032
- Table 26: United Kingdom Smart Fabric for Transportation Industry Volume (K Unit) Forecast, by Application 2019 & 2032
- Table 27: France Smart Fabric for Transportation Industry Revenue (Million) Forecast, by Application 2019 & 2032
- Table 28: France Smart Fabric for Transportation Industry Volume (K Unit) Forecast, by Application 2019 & 2032
- Table 29: Spain Smart Fabric for Transportation Industry Revenue (Million) Forecast, by Application 2019 & 2032
- Table 30: Spain Smart Fabric for Transportation Industry Volume (K Unit) Forecast, by Application 2019 & 2032
- Table 31: Italy Smart Fabric for Transportation Industry Revenue (Million) Forecast, by Application 2019 & 2032
- Table 32: Italy Smart Fabric for Transportation Industry Volume (K Unit) Forecast, by Application 2019 & 2032
- Table 33: Spain Smart Fabric for Transportation Industry Revenue (Million) Forecast, by Application 2019 & 2032
- Table 34: Spain Smart Fabric for Transportation Industry Volume (K Unit) Forecast, by Application 2019 & 2032
- Table 35: Belgium Smart Fabric for Transportation Industry Revenue (Million) Forecast, by Application 2019 & 2032
- Table 36: Belgium Smart Fabric for Transportation Industry Volume (K Unit) Forecast, by Application 2019 & 2032
- Table 37: Netherland Smart Fabric for Transportation Industry Revenue (Million) Forecast, by Application 2019 & 2032
- Table 38: Netherland Smart Fabric for Transportation Industry Volume (K Unit) Forecast, by Application 2019 & 2032
- Table 39: Nordics Smart Fabric for Transportation Industry Revenue (Million) Forecast, by Application 2019 & 2032
- Table 40: Nordics Smart Fabric for Transportation Industry Volume (K Unit) Forecast, by Application 2019 & 2032
- Table 41: Rest of Europe Smart Fabric for Transportation Industry Revenue (Million) Forecast, by Application 2019 & 2032
- Table 42: Rest of Europe Smart Fabric for Transportation Industry Volume (K Unit) Forecast, by Application 2019 & 2032
- Table 43: Global Smart Fabric for Transportation Industry Revenue Million Forecast, by Country 2019 & 2032
- Table 44: Global Smart Fabric for Transportation Industry Volume K Unit Forecast, by Country 2019 & 2032
- Table 45: China Smart Fabric for Transportation Industry Revenue (Million) Forecast, by Application 2019 & 2032
- Table 46: China Smart Fabric for Transportation Industry Volume (K Unit) Forecast, by Application 2019 & 2032
- Table 47: Japan Smart Fabric for Transportation Industry Revenue (Million) Forecast, by Application 2019 & 2032
- Table 48: Japan Smart Fabric for Transportation Industry Volume (K Unit) Forecast, by Application 2019 & 2032
- Table 49: India Smart Fabric for Transportation Industry Revenue (Million) Forecast, by Application 2019 & 2032
- Table 50: India Smart Fabric for Transportation Industry Volume (K Unit) Forecast, by Application 2019 & 2032
- Table 51: South Korea Smart Fabric for Transportation Industry Revenue (Million) Forecast, by Application 2019 & 2032
- Table 52: South Korea Smart Fabric for Transportation Industry Volume (K Unit) Forecast, by Application 2019 & 2032
- Table 53: Southeast Asia Smart Fabric for Transportation Industry Revenue (Million) Forecast, by Application 2019 & 2032
- Table 54: Southeast Asia Smart Fabric for Transportation Industry Volume (K Unit) Forecast, by Application 2019 & 2032
- Table 55: Australia Smart Fabric for Transportation Industry Revenue (Million) Forecast, by Application 2019 & 2032
- Table 56: Australia Smart Fabric for Transportation Industry Volume (K Unit) Forecast, by Application 2019 & 2032
- Table 57: Indonesia Smart Fabric for Transportation Industry Revenue (Million) Forecast, by Application 2019 & 2032
- Table 58: Indonesia Smart Fabric for Transportation Industry Volume (K Unit) Forecast, by Application 2019 & 2032
- Table 59: Phillipes Smart Fabric for Transportation Industry Revenue (Million) Forecast, by Application 2019 & 2032
- Table 60: Phillipes Smart Fabric for Transportation Industry Volume (K Unit) Forecast, by Application 2019 & 2032
- Table 61: Singapore Smart Fabric for Transportation Industry Revenue (Million) Forecast, by Application 2019 & 2032
- Table 62: Singapore Smart Fabric for Transportation Industry Volume (K Unit) Forecast, by Application 2019 & 2032
- Table 63: Thailandc Smart Fabric for Transportation Industry Revenue (Million) Forecast, by Application 2019 & 2032
- Table 64: Thailandc Smart Fabric for Transportation Industry Volume (K Unit) Forecast, by Application 2019 & 2032
- Table 65: Rest of Asia Pacific Smart Fabric for Transportation Industry Revenue (Million) Forecast, by Application 2019 & 2032
- Table 66: Rest of Asia Pacific Smart Fabric for Transportation Industry Volume (K Unit) Forecast, by Application 2019 & 2032
- Table 67: Global Smart Fabric for Transportation Industry Revenue Million Forecast, by Country 2019 & 2032
- Table 68: Global Smart Fabric for Transportation Industry Volume K Unit Forecast, by Country 2019 & 2032
- Table 69: Brazil Smart Fabric for Transportation Industry Revenue (Million) Forecast, by Application 2019 & 2032
- Table 70: Brazil Smart Fabric for Transportation Industry Volume (K Unit) Forecast, by Application 2019 & 2032
- Table 71: Argentina Smart Fabric for Transportation Industry Revenue (Million) Forecast, by Application 2019 & 2032
- Table 72: Argentina Smart Fabric for Transportation Industry Volume (K Unit) Forecast, by Application 2019 & 2032
- Table 73: Peru Smart Fabric for Transportation Industry Revenue (Million) Forecast, by Application 2019 & 2032
- Table 74: Peru Smart Fabric for Transportation Industry Volume (K Unit) Forecast, by Application 2019 & 2032
- Table 75: Chile Smart Fabric for Transportation Industry Revenue (Million) Forecast, by Application 2019 & 2032
- Table 76: Chile Smart Fabric for Transportation Industry Volume (K Unit) Forecast, by Application 2019 & 2032
- Table 77: Colombia Smart Fabric for Transportation Industry Revenue (Million) Forecast, by Application 2019 & 2032
- Table 78: Colombia Smart Fabric for Transportation Industry Volume (K Unit) Forecast, by Application 2019 & 2032
- Table 79: Ecuador Smart Fabric for Transportation Industry Revenue (Million) Forecast, by Application 2019 & 2032
- Table 80: Ecuador Smart Fabric for Transportation Industry Volume (K Unit) Forecast, by Application 2019 & 2032
- Table 81: Venezuela Smart Fabric for Transportation Industry Revenue (Million) Forecast, by Application 2019 & 2032
- Table 82: Venezuela Smart Fabric for Transportation Industry Volume (K Unit) Forecast, by Application 2019 & 2032
- Table 83: Rest of South America Smart Fabric for Transportation Industry Revenue (Million) Forecast, by Application 2019 & 2032
- Table 84: Rest of South America Smart Fabric for Transportation Industry Volume (K Unit) Forecast, by Application 2019 & 2032
- Table 85: Global Smart Fabric for Transportation Industry Revenue Million Forecast, by Country 2019 & 2032
- Table 86: Global Smart Fabric for Transportation Industry Volume K Unit Forecast, by Country 2019 & 2032
- Table 87: United States Smart Fabric for Transportation Industry Revenue (Million) Forecast, by Application 2019 & 2032
- Table 88: United States Smart Fabric for Transportation Industry Volume (K Unit) Forecast, by Application 2019 & 2032
- Table 89: Canada Smart Fabric for Transportation Industry Revenue (Million) Forecast, by Application 2019 & 2032
- Table 90: Canada Smart Fabric for Transportation Industry Volume (K Unit) Forecast, by Application 2019 & 2032
- Table 91: Mexico Smart Fabric for Transportation Industry Revenue (Million) Forecast, by Application 2019 & 2032
- Table 92: Mexico Smart Fabric for Transportation Industry Volume (K Unit) Forecast, by Application 2019 & 2032
- Table 93: Global Smart Fabric for Transportation Industry Revenue Million Forecast, by Country 2019 & 2032
- Table 94: Global Smart Fabric for Transportation Industry Volume K Unit Forecast, by Country 2019 & 2032
- Table 95: United Arab Emirates Smart Fabric for Transportation Industry Revenue (Million) Forecast, by Application 2019 & 2032
- Table 96: United Arab Emirates Smart Fabric for Transportation Industry Volume (K Unit) Forecast, by Application 2019 & 2032
- Table 97: Saudi Arabia Smart Fabric for Transportation Industry Revenue (Million) Forecast, by Application 2019 & 2032
- Table 98: Saudi Arabia Smart Fabric for Transportation Industry Volume (K Unit) Forecast, by Application 2019 & 2032
- Table 99: South Africa Smart Fabric for Transportation Industry Revenue (Million) Forecast, by Application 2019 & 2032
- Table 100: South Africa Smart Fabric for Transportation Industry Volume (K Unit) Forecast, by Application 2019 & 2032
- Table 101: Rest of Middle East and Africa Smart Fabric for Transportation Industry Revenue (Million) Forecast, by Application 2019 & 2032
- Table 102: Rest of Middle East and Africa Smart Fabric for Transportation Industry Volume (K Unit) Forecast, by Application 2019 & 2032
- Table 103: Global Smart Fabric for Transportation Industry Revenue Million Forecast, by Component 2019 & 2032
- Table 104: Global Smart Fabric for Transportation Industry Volume K Unit Forecast, by Component 2019 & 2032
- Table 105: Global Smart Fabric for Transportation Industry Revenue Million Forecast, by Material 2019 & 2032
- Table 106: Global Smart Fabric for Transportation Industry Volume K Unit Forecast, by Material 2019 & 2032
- Table 107: Global Smart Fabric for Transportation Industry Revenue Million Forecast, by Application 2019 & 2032
- Table 108: Global Smart Fabric for Transportation Industry Volume K Unit Forecast, by Application 2019 & 2032
- Table 109: Global Smart Fabric for Transportation Industry Revenue Million Forecast, by End-user Industry 2019 & 2032
- Table 110: Global Smart Fabric for Transportation Industry Volume K Unit Forecast, by End-user Industry 2019 & 2032
- Table 111: Global Smart Fabric for Transportation Industry Revenue Million Forecast, by Country 2019 & 2032
- Table 112: Global Smart Fabric for Transportation Industry Volume K Unit Forecast, by Country 2019 & 2032
- Table 113: Global Smart Fabric for Transportation Industry Revenue Million Forecast, by Component 2019 & 2032
- Table 114: Global Smart Fabric for Transportation Industry Volume K Unit Forecast, by Component 2019 & 2032
- Table 115: Global Smart Fabric for Transportation Industry Revenue Million Forecast, by Material 2019 & 2032
- Table 116: Global Smart Fabric for Transportation Industry Volume K Unit Forecast, by Material 2019 & 2032
- Table 117: Global Smart Fabric for Transportation Industry Revenue Million Forecast, by Application 2019 & 2032
- Table 118: Global Smart Fabric for Transportation Industry Volume K Unit Forecast, by Application 2019 & 2032
- Table 119: Global Smart Fabric for Transportation Industry Revenue Million Forecast, by End-user Industry 2019 & 2032
- Table 120: Global Smart Fabric for Transportation Industry Volume K Unit Forecast, by End-user Industry 2019 & 2032
- Table 121: Global Smart Fabric for Transportation Industry Revenue Million Forecast, by Country 2019 & 2032
- Table 122: Global Smart Fabric for Transportation Industry Volume K Unit Forecast, by Country 2019 & 2032
- Table 123: Global Smart Fabric for Transportation Industry Revenue Million Forecast, by Component 2019 & 2032
- Table 124: Global Smart Fabric for Transportation Industry Volume K Unit Forecast, by Component 2019 & 2032
- Table 125: Global Smart Fabric for Transportation Industry Revenue Million Forecast, by Material 2019 & 2032
- Table 126: Global Smart Fabric for Transportation Industry Volume K Unit Forecast, by Material 2019 & 2032
- Table 127: Global Smart Fabric for Transportation Industry Revenue Million Forecast, by Application 2019 & 2032
- Table 128: Global Smart Fabric for Transportation Industry Volume K Unit Forecast, by Application 2019 & 2032
- Table 129: Global Smart Fabric for Transportation Industry Revenue Million Forecast, by End-user Industry 2019 & 2032
- Table 130: Global Smart Fabric for Transportation Industry Volume K Unit Forecast, by End-user Industry 2019 & 2032
- Table 131: Global Smart Fabric for Transportation Industry Revenue Million Forecast, by Country 2019 & 2032
- Table 132: Global Smart Fabric for Transportation Industry Volume K Unit Forecast, by Country 2019 & 2032
- Table 133: Global Smart Fabric for Transportation Industry Revenue Million Forecast, by Component 2019 & 2032
- Table 134: Global Smart Fabric for Transportation Industry Volume K Unit Forecast, by Component 2019 & 2032
- Table 135: Global Smart Fabric for Transportation Industry Revenue Million Forecast, by Material 2019 & 2032
- Table 136: Global Smart Fabric for Transportation Industry Volume K Unit Forecast, by Material 2019 & 2032
- Table 137: Global Smart Fabric for Transportation Industry Revenue Million Forecast, by Application 2019 & 2032
- Table 138: Global Smart Fabric for Transportation Industry Volume K Unit Forecast, by Application 2019 & 2032
- Table 139: Global Smart Fabric for Transportation Industry Revenue Million Forecast, by End-user Industry 2019 & 2032
- Table 140: Global Smart Fabric for Transportation Industry Volume K Unit Forecast, by End-user Industry 2019 & 2032
- Table 141: Global Smart Fabric for Transportation Industry Revenue Million Forecast, by Country 2019 & 2032
- Table 142: Global Smart Fabric for Transportation Industry Volume K Unit Forecast, by Country 2019 & 2032
- Table 143: Global Smart Fabric for Transportation Industry Revenue Million Forecast, by Component 2019 & 2032
- Table 144: Global Smart Fabric for Transportation Industry Volume K Unit Forecast, by Component 2019 & 2032
- Table 145: Global Smart Fabric for Transportation Industry Revenue Million Forecast, by Material 2019 & 2032
- Table 146: Global Smart Fabric for Transportation Industry Volume K Unit Forecast, by Material 2019 & 2032
- Table 147: Global Smart Fabric for Transportation Industry Revenue Million Forecast, by Application 2019 & 2032
- Table 148: Global Smart Fabric for Transportation Industry Volume K Unit Forecast, by Application 2019 & 2032
- Table 149: Global Smart Fabric for Transportation Industry Revenue Million Forecast, by End-user Industry 2019 & 2032
- Table 150: Global Smart Fabric for Transportation Industry Volume K Unit Forecast, by End-user Industry 2019 & 2032
- Table 151: Global Smart Fabric for Transportation Industry Revenue Million Forecast, by Country 2019 & 2032
- Table 152: Global Smart Fabric for Transportation Industry Volume K Unit Forecast, by Country 2019 & 2032
Frequently Asked Questions
1. What is the projected Compound Annual Growth Rate (CAGR) of the Smart Fabric for Transportation Industry?
The projected CAGR is approximately 25.51%.
2. Which companies are prominent players in the Smart Fabric for Transportation Industry?
Key companies in the market include Texas Instruments, Textronics Inc, Ohmatex, Infineon Technologies, EI Du Pont De Nemours and Company, AIQ Smart Clothing Inc, Sensoria Inc, Kolon Glotech Inc, Schoeller Textil AG, Interactive Wear AG.
3. What are the main segments of the Smart Fabric for Transportation Industry?
The market segments include Component, Material, Application, End-user Industry.
4. Can you provide details about the market size?
The market size is estimated to be USD 1.04 Million as of 2022.
5. What are some drivers contributing to market growth?
Increasing Number of Connected Cars and Heavy Vehicles; Miniaturization of Electronic Components; Increasing Safety and Security Concerns in Transportation.
6. What are the notable trends driving market growth?
Mobility Management to Witness Significantly High Growth Rate.
7. Are there any restraints impacting market growth?
Slow Penetration Rate in Developing Countries; Lack of Funding and Capital Expenditure.
8. Can you provide examples of recent developments in the market?
March 2023: Apple's patent pertains to the integration of smart fabrics with a lighting system designed for incorporation into fabric seats, door panels, dashboards, and other interior components of systems like vehicles. This lighting system not only offers ambient illumination but also enables the creation of bespoke surface textures, decorative patterns, and the display of icons, text, and other information. Additionally, it supports custom gauge configurations.
9. What pricing options are available for accessing the report?
Pricing options include single-user, multi-user, and enterprise licenses priced at USD 4750, USD 5250, and USD 8750 respectively.
10. Is the market size provided in terms of value or volume?
The market size is provided in terms of value, measured in Million and volume, measured in K Unit.
11. Are there any specific market keywords associated with the report?
Yes, the market keyword associated with the report is "Smart Fabric for Transportation Industry," which aids in identifying and referencing the specific market segment covered.
12. How do I determine which pricing option suits my needs best?
The pricing options vary based on user requirements and access needs. Individual users may opt for single-user licenses, while businesses requiring broader access may choose multi-user or enterprise licenses for cost-effective access to the report.
13. Are there any additional resources or data provided in the Smart Fabric for Transportation Industry report?
While the report offers comprehensive insights, it's advisable to review the specific contents or supplementary materials provided to ascertain if additional resources or data are available.
14. How can I stay updated on further developments or reports in the Smart Fabric for Transportation Industry?
To stay informed about further developments, trends, and reports in the Smart Fabric for Transportation Industry, consider subscribing to industry newsletters, following relevant companies and organizations, or regularly checking reputable industry news sources and publications.
Methodology
Step 1 - Identification of Relevant Samples Size from Population Database


Step 2 - Approaches for Defining Global Market Size (Value, Volume* & Price*)

Note*: In applicable scenarios
Step 3 - Data Sources
Primary Research
- Web Analytics
- Survey Reports
- Research Institute
- Latest Research Reports
- Opinion Leaders
Secondary Research
- Annual Reports
- White Paper
- Latest Press Release
- Industry Association
- Paid Database
- Investor Presentations

Step 4 - Data Triangulation
Involves using different sources of information in order to increase the validity of a study
These sources are likely to be stakeholders in a program - participants, other researchers, program staff, other community members, and so on.
Then we put all data in single framework & apply various statistical tools to find out the dynamic on the market.
During the analysis stage, feedback from the stakeholder groups would be compared to determine areas of agreement as well as areas of divergence
