

Key Insights
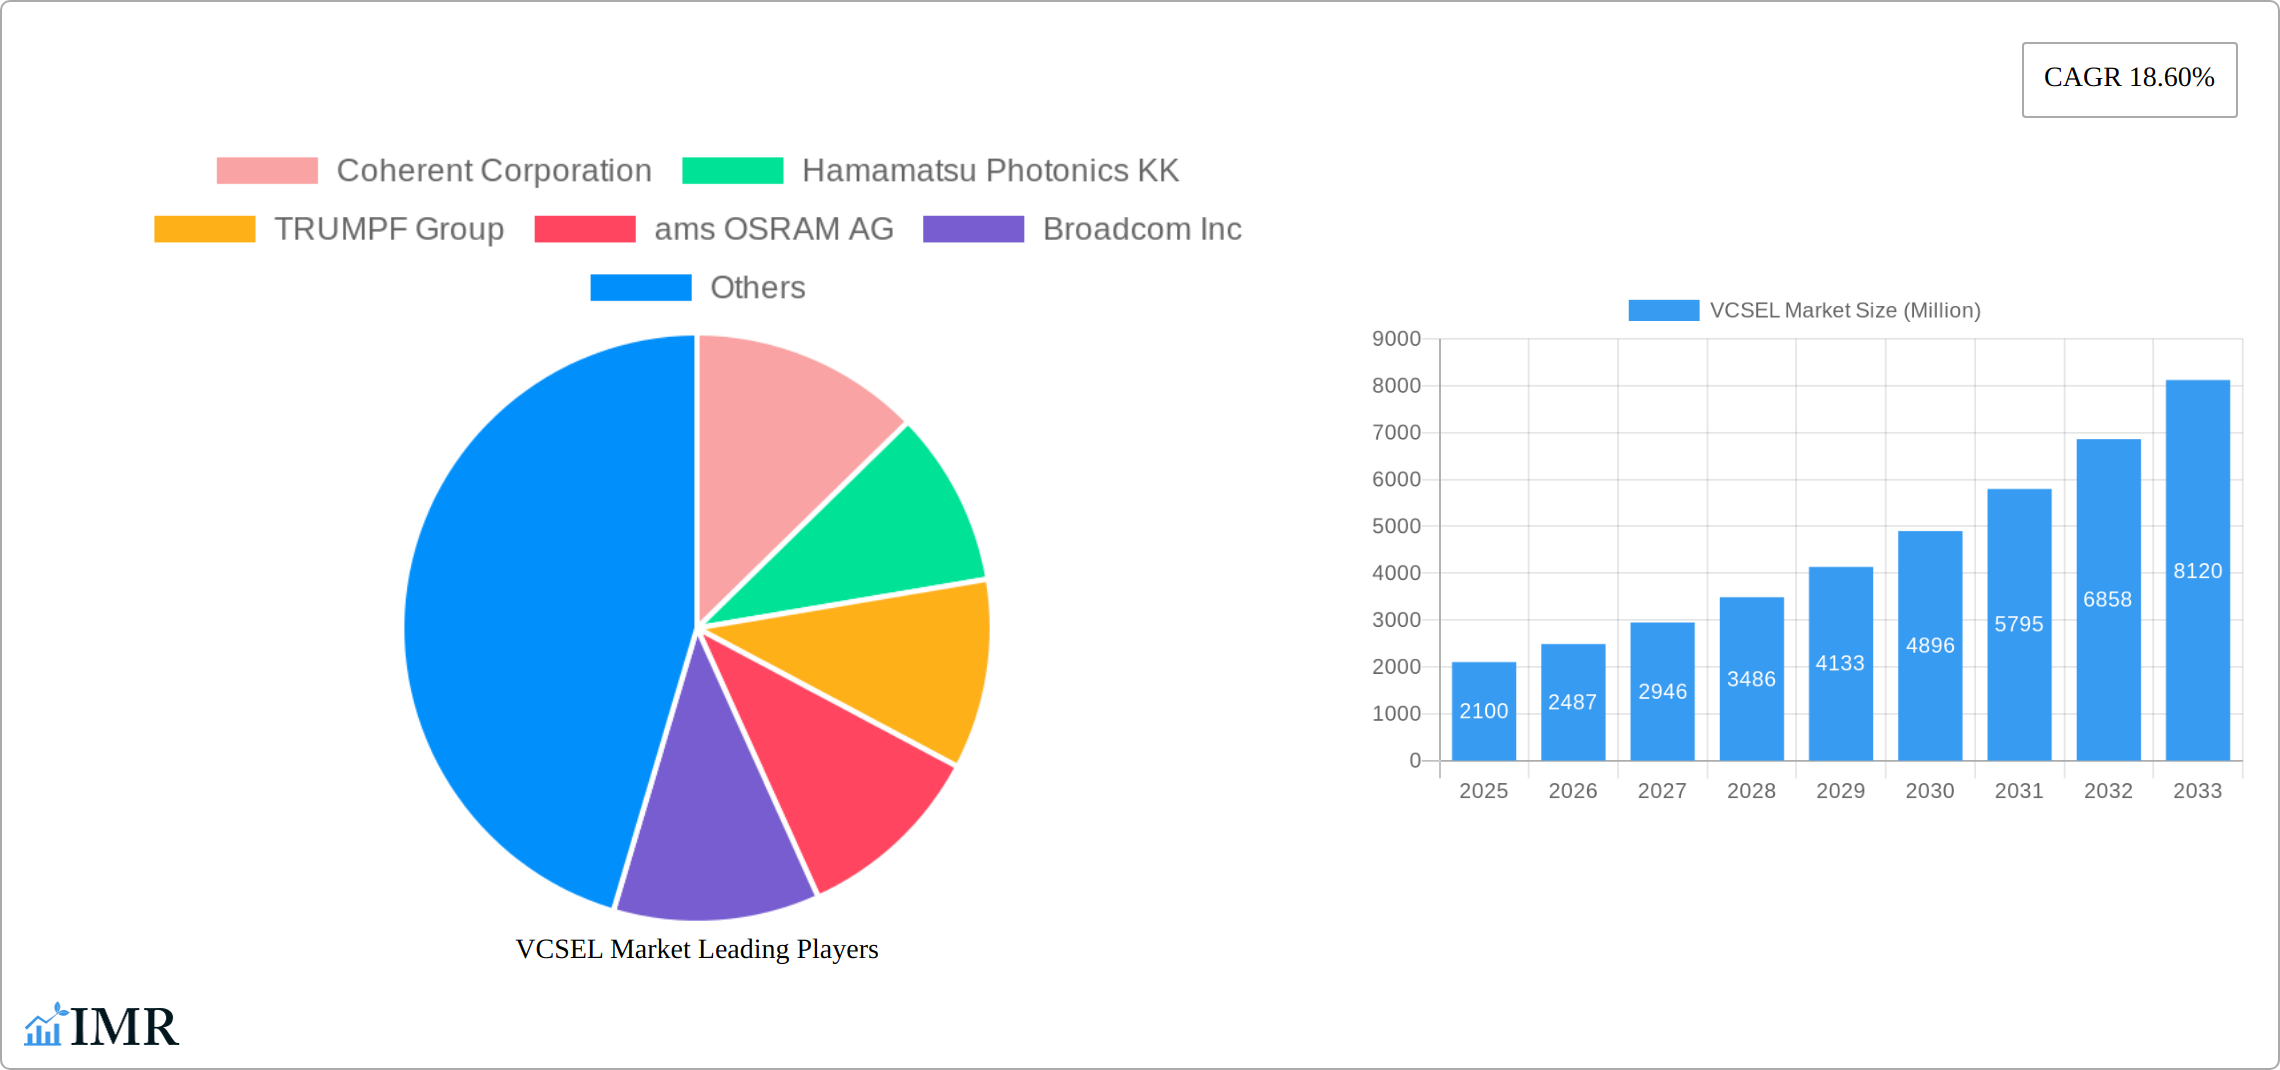
The VCSEL (Vertical-Cavity Surface-Emitting Laser) market is experiencing robust growth, projected to reach $2.10 billion in 2025 and exhibiting a Compound Annual Growth Rate (CAGR) of 18.60% from 2025 to 2033. This expansion is driven by several key factors. The increasing adoption of VCSELs in consumer electronics, particularly smartphones incorporating advanced features like facial recognition and 3D sensing, is a major catalyst. Furthermore, the automotive industry's burgeoning demand for advanced driver-assistance systems (ADAS) and LiDAR technology, which rely heavily on VCSELs for precise distance measurement, significantly fuels market growth. The expanding datacom sector, requiring high-speed optical communication, also presents a substantial opportunity. While technological advancements continually push the boundaries of VCSEL performance, potential restraints include the complexity of manufacturing high-performance devices and the competitive landscape with other laser technologies. The market segmentation reveals a diverse application spectrum, with telecom, mobile, and automotive sectors representing significant portions of the overall demand. Geographically, North America and Asia Pacific currently hold substantial market shares, driven by strong technological infrastructure and a high concentration of key players. However, other regions like Europe and parts of Asia are rapidly developing, leading to a spread of adoption and market expansion across the globe.
The competitive landscape is characterized by a mix of established players and emerging companies. Key market players like Coherent, Hamamatsu Photonics, TRUMPF, ams OSRAM, and Broadcom are continuously investing in R&D to enhance VCSEL performance and broaden applications. This competitive intensity drives innovation and ensures the supply of advanced VCSEL solutions across various industries. The projected growth trajectory indicates that VCSEL technology will continue to play a critical role in shaping technological advancements across numerous sectors, from daily consumer devices to sophisticated industrial and automotive applications. The market's evolution will likely witness further specialization in wavelengths and applications, with niche players catering to specialized requirements within specific sectors.
This comprehensive report delivers an in-depth analysis of the VCSEL market, encompassing market dynamics, growth trends, regional dominance, product landscape, and key players. With a focus on the parent market of photonics and the child market of vertical cavity surface emitting lasers (VCSELs), this report provides critical insights for industry professionals, investors, and strategic decision-makers. The study period covers 2019-2033, with 2025 as the base and estimated year, and a forecast period of 2025-2033.
VCSEL Market Market Dynamics & Structure
The VCSEL market is characterized by a moderately concentrated structure with key players like Coherent Corporation, Hamamatsu Photonics KK, TRUMPF Group, ams OSRAM AG, and Broadcom Inc. holding significant market share. Technological innovation, particularly in wavelengths and applications, is a primary driver, alongside increasing demand from diverse end-user industries. Regulatory frameworks concerning safety and standards, especially in sectors like automotive and medical, significantly impact market growth. Competitive product substitutes, such as edge-emitting lasers, exist but VCSELs maintain an advantage in specific applications due to their unique characteristics.
- Market Concentration: Top 5 players hold approximately xx% market share (2024).
- Technological Innovation: Focus on higher power outputs, shorter wavelengths, and improved beam quality.
- Regulatory Landscape: Stringent safety and performance standards in automotive and medical sectors.
- M&A Activity: A moderate level of mergers and acquisitions observed, driven by the need to expand product portfolios and market reach. xx M&A deals recorded between 2019-2024.
- End-User Demographics: Growing demand from data centers and consumer electronics sectors, particularly in regions with robust digital infrastructure.
- Competitive Landscape: Intense competition among established players and emerging entrants.
VCSEL Market Growth Trends & Insights
The VCSEL market experienced significant growth during the historical period (2019-2024), driven primarily by the proliferation of smartphones, data centers, and the rise of 3D sensing applications. The market size reached xx million units in 2024, demonstrating a CAGR of xx% from 2019 to 2024. This growth trajectory is projected to continue throughout the forecast period (2025-2033), fueled by increasing adoption in automotive (ADAS LiDAR), augmented reality/virtual reality (AR/VR) devices, and industrial automation. Technological disruptions, including advancements in materials science and manufacturing processes, are enabling higher performance and lower costs, thus enhancing market penetration. Consumer behavior shifts toward smarter and more connected devices are also contributing to market expansion.

Dominant Regions, Countries, or Segments in VCSEL Market
North America and Asia-Pacific currently dominate the VCSEL market, driven by high demand from the telecom, consumer electronics, and automotive sectors. Within these regions, specific countries like the US, China, Japan, and South Korea demonstrate exceptionally high growth potential, fueled by strong economic activity and technological advancements. Analyzing segments reveals Near-infrared (750-1400 nm) wavelengths and the telecom/datacom applications segment hold a significant market share due to widespread usage in data communication and optical mouse applications. The automotive sector shows a rapidly growing demand for VCSELs, particularly for LiDAR applications.
- Leading Region: North America & Asia-Pacific (Combined Market Share: xx% in 2024).
- Key Countries: US, China, Japan, South Korea.
- Dominant Wavelength: Near-infrared (750-1400 nm)
- Leading Application Segment: Telecom/Datacom; Automotive (ADAS LiDAR)
VCSEL Market Product Landscape
VCSEL technology continues to evolve, with innovations focusing on improving efficiency, power output, and wavelength range. These advancements are driving wider adoption across diverse applications. Unique selling propositions of VCSELs include their inherent low cost, high reliability, and suitability for high-volume manufacturing. Continuous advancements in materials and packaging techniques are further enhancing VCSEL performance metrics like beam quality, thermal stability and power consumption.
Key Drivers, Barriers & Challenges in VCSEL Market
Key Drivers:
- The growing demand for high-speed data transmission in data centers and 5G networks.
- The rise of 3D sensing technologies in consumer electronics (facial recognition, gesture control).
- The increasing adoption of LiDAR technology in autonomous vehicles.
Key Challenges and Restraints:
- Competition from alternative technologies such as edge-emitting lasers in certain applications.
- Supply chain disruptions impacting component availability and manufacturing costs.
- Regulatory hurdles and safety standards particularly in automotive and medical sectors.
- High research and development costs associated with new wavelength and power development.
Emerging Opportunities in VCSEL Market
- Expansion into new applications such as augmented reality (AR) and virtual reality (VR) devices.
- Development of VCSELs for short-wave infrared (SWIR) applications in industrial sensing and medical imaging.
- Growing demand for VCSELs in smart city infrastructure and environmental monitoring systems.
Growth Accelerators in the VCSEL Market Industry
The VCSEL market's long-term growth is projected to be driven by strategic partnerships between technology companies and component manufacturers, fostering innovation and collaboration. Technological breakthroughs in materials science and device fabrication are set to enhance VCSEL performance, opening up new application possibilities. Expansion of high-speed data centers worldwide and increasing investment in autonomous driving technology further accelerates market growth.
Key Players Shaping the VCSEL Market Market
- Coherent Corporation
- Hamamatsu Photonics KK
- TRUMPF Group
- ams OSRAM AG
- Broadcom Inc
- Leonardo Electronics US (Lasertel)
- Lumentum Operations LLC
- Vertilite Inc
- Santec Corporation
- Teledyne FLIR Systems Inc
- Vixar Inc (OSRAM AG)
- HLJ Technology Co Ltd
Notable Milestones in VCSEL Market Sector
- November 2023: The Japanese government's JPY 2 trillion (USD 13 billion) investment in its chip industry boosts the potential for VCSEL manufacturing within the country. This initiative significantly impacts the supply chain and production capabilities for VCSEL components.
- September 2023: The collaborative agreement between ams OSRAM AG and the Malaysian Investment Development Authority (MIDA) strengthens ams OSRAM's presence in Malaysia, potentially leading to increased VCSEL production and market share.
In-Depth VCSEL Market Market Outlook
The VCSEL market is poised for robust growth in the coming years, driven by technological advancements, rising demand from key sectors, and strategic investments by governments and companies alike. Focus on developing higher power, wider wavelength range, and improved beam quality VCSELs will open new applications and markets. Strategic partnerships and collaborations across the value chain will also play a key role in driving innovation and market expansion, leading to a substantial increase in market size and value over the forecast period.
VCSEL Market Segmentation
-
1. Wavelength
- 1.1. Red (650-750 nm)
- 1.2. Near-infrared (750-1400 nm)
- 1.3. Shortwave-infrared (1400-3000 nm)
-
2. Die-size
- 2.1. 0.02 - 0.06 mm2
- 2.2. 0.06 - 0.4 mm2
- 2.3. 0.4 - 1.3 mm2
- 2.4. 10 - 75 mm2
-
3. End-user Industry
- 3.1. Telecom
- 3.2. Mobile and Consumer
- 3.3. Automotive
- 3.4. Medical
- 3.5. Industrial
- 3.6. Aerospace and Defense
-
4. Application
- 4.1. Datacom
- 4.2. Optical Mouse
- 4.3. Facial Recognition and Depth Camera
- 4.4. Gesture Recognition
- 4.5. Laser Autofocus
- 4.6. Proximity sensing
- 4.7. Iris Scan
- 4.8. Medical
- 4.9. ADAS LiDAR
- 4.10. Industrial Applications
- 4.11. Other Applications
VCSEL Market Segmentation By Geography
- 1. North America
- 2. Europe
- 3. Taiwan
- 4. China
- 5. South Korea
- 6. Japan
- 7. Rest of the World

VCSEL Market REPORT HIGHLIGHTS
| Aspects | Details |
|---|---|
| Study Period | 2019-2033 |
| Base Year | 2024 |
| Estimated Year | 2025 |
| Forecast Period | 2025-2033 |
| Historical Period | 2019-2024 |
| Growth Rate | CAGR of 18.60% from 2019-2033 |
| Segmentation |
|
Table of Contents
- 1. Introduction
- 1.1. Research Scope
- 1.2. Market Segmentation
- 1.3. Research Methodology
- 1.4. Definitions and Assumptions
- 2. Executive Summary
- 2.1. Introduction
- 3. Market Dynamics
- 3.1. Introduction
- 3.2. Market Drivers
- 3.2.1. Increasing Adoption of VCSEL in Data Centers; Growing Demand for 3D Sensing Applications in Smartphones
- 3.3. Market Restrains
- 3.3.1. Low Penetration of InP-based VCSELs and Limited Data Transmission Range
- 3.4. Market Trends
- 3.4.1. ADAS and LiDAR to be the Fastest-growing Application
- 4. Market Factor Analysis
- 4.1. Porters Five Forces
- 4.2. Supply/Value Chain
- 4.3. PESTEL analysis
- 4.4. Market Entropy
- 4.5. Patent/Trademark Analysis
- 5. Global VCSEL Market Analysis, Insights and Forecast, 2019-2031
- 5.1. Market Analysis, Insights and Forecast - by Wavelength
- 5.1.1. Red (650-750 nm)
- 5.1.2. Near-infrared (750-1400 nm)
- 5.1.3. Shortwave-infrared (1400-3000 nm)
- 5.2. Market Analysis, Insights and Forecast - by Die-size
- 5.2.1. 0.02 - 0.06 mm2
- 5.2.2. 0.06 - 0.4 mm2
- 5.2.3. 0.4 - 1.3 mm2
- 5.2.4. 10 - 75 mm2
- 5.3. Market Analysis, Insights and Forecast - by End-user Industry
- 5.3.1. Telecom
- 5.3.2. Mobile and Consumer
- 5.3.3. Automotive
- 5.3.4. Medical
- 5.3.5. Industrial
- 5.3.6. Aerospace and Defense
- 5.4. Market Analysis, Insights and Forecast - by Application
- 5.4.1. Datacom
- 5.4.2. Optical Mouse
- 5.4.3. Facial Recognition and Depth Camera
- 5.4.4. Gesture Recognition
- 5.4.5. Laser Autofocus
- 5.4.6. Proximity sensing
- 5.4.7. Iris Scan
- 5.4.8. Medical
- 5.4.9. ADAS LiDAR
- 5.4.10. Industrial Applications
- 5.4.11. Other Applications
- 5.5. Market Analysis, Insights and Forecast - by Region
- 5.5.1. North America
- 5.5.2. Europe
- 5.5.3. Taiwan
- 5.5.4. China
- 5.5.5. South Korea
- 5.5.6. Japan
- 5.5.7. Rest of the World
- 5.1. Market Analysis, Insights and Forecast - by Wavelength
- 6. North America VCSEL Market Analysis, Insights and Forecast, 2019-2031
- 6.1. Market Analysis, Insights and Forecast - by Wavelength
- 6.1.1. Red (650-750 nm)
- 6.1.2. Near-infrared (750-1400 nm)
- 6.1.3. Shortwave-infrared (1400-3000 nm)
- 6.2. Market Analysis, Insights and Forecast - by Die-size
- 6.2.1. 0.02 - 0.06 mm2
- 6.2.2. 0.06 - 0.4 mm2
- 6.2.3. 0.4 - 1.3 mm2
- 6.2.4. 10 - 75 mm2
- 6.3. Market Analysis, Insights and Forecast - by End-user Industry
- 6.3.1. Telecom
- 6.3.2. Mobile and Consumer
- 6.3.3. Automotive
- 6.3.4. Medical
- 6.3.5. Industrial
- 6.3.6. Aerospace and Defense
- 6.4. Market Analysis, Insights and Forecast - by Application
- 6.4.1. Datacom
- 6.4.2. Optical Mouse
- 6.4.3. Facial Recognition and Depth Camera
- 6.4.4. Gesture Recognition
- 6.4.5. Laser Autofocus
- 6.4.6. Proximity sensing
- 6.4.7. Iris Scan
- 6.4.8. Medical
- 6.4.9. ADAS LiDAR
- 6.4.10. Industrial Applications
- 6.4.11. Other Applications
- 6.1. Market Analysis, Insights and Forecast - by Wavelength
- 7. Europe VCSEL Market Analysis, Insights and Forecast, 2019-2031
- 7.1. Market Analysis, Insights and Forecast - by Wavelength
- 7.1.1. Red (650-750 nm)
- 7.1.2. Near-infrared (750-1400 nm)
- 7.1.3. Shortwave-infrared (1400-3000 nm)
- 7.2. Market Analysis, Insights and Forecast - by Die-size
- 7.2.1. 0.02 - 0.06 mm2
- 7.2.2. 0.06 - 0.4 mm2
- 7.2.3. 0.4 - 1.3 mm2
- 7.2.4. 10 - 75 mm2
- 7.3. Market Analysis, Insights and Forecast - by End-user Industry
- 7.3.1. Telecom
- 7.3.2. Mobile and Consumer
- 7.3.3. Automotive
- 7.3.4. Medical
- 7.3.5. Industrial
- 7.3.6. Aerospace and Defense
- 7.4. Market Analysis, Insights and Forecast - by Application
- 7.4.1. Datacom
- 7.4.2. Optical Mouse
- 7.4.3. Facial Recognition and Depth Camera
- 7.4.4. Gesture Recognition
- 7.4.5. Laser Autofocus
- 7.4.6. Proximity sensing
- 7.4.7. Iris Scan
- 7.4.8. Medical
- 7.4.9. ADAS LiDAR
- 7.4.10. Industrial Applications
- 7.4.11. Other Applications
- 7.1. Market Analysis, Insights and Forecast - by Wavelength
- 8. Taiwan VCSEL Market Analysis, Insights and Forecast, 2019-2031
- 8.1. Market Analysis, Insights and Forecast - by Wavelength
- 8.1.1. Red (650-750 nm)
- 8.1.2. Near-infrared (750-1400 nm)
- 8.1.3. Shortwave-infrared (1400-3000 nm)
- 8.2. Market Analysis, Insights and Forecast - by Die-size
- 8.2.1. 0.02 - 0.06 mm2
- 8.2.2. 0.06 - 0.4 mm2
- 8.2.3. 0.4 - 1.3 mm2
- 8.2.4. 10 - 75 mm2
- 8.3. Market Analysis, Insights and Forecast - by End-user Industry
- 8.3.1. Telecom
- 8.3.2. Mobile and Consumer
- 8.3.3. Automotive
- 8.3.4. Medical
- 8.3.5. Industrial
- 8.3.6. Aerospace and Defense
- 8.4. Market Analysis, Insights and Forecast - by Application
- 8.4.1. Datacom
- 8.4.2. Optical Mouse
- 8.4.3. Facial Recognition and Depth Camera
- 8.4.4. Gesture Recognition
- 8.4.5. Laser Autofocus
- 8.4.6. Proximity sensing
- 8.4.7. Iris Scan
- 8.4.8. Medical
- 8.4.9. ADAS LiDAR
- 8.4.10. Industrial Applications
- 8.4.11. Other Applications
- 8.1. Market Analysis, Insights and Forecast - by Wavelength
- 9. China VCSEL Market Analysis, Insights and Forecast, 2019-2031
- 9.1. Market Analysis, Insights and Forecast - by Wavelength
- 9.1.1. Red (650-750 nm)
- 9.1.2. Near-infrared (750-1400 nm)
- 9.1.3. Shortwave-infrared (1400-3000 nm)
- 9.2. Market Analysis, Insights and Forecast - by Die-size
- 9.2.1. 0.02 - 0.06 mm2
- 9.2.2. 0.06 - 0.4 mm2
- 9.2.3. 0.4 - 1.3 mm2
- 9.2.4. 10 - 75 mm2
- 9.3. Market Analysis, Insights and Forecast - by End-user Industry
- 9.3.1. Telecom
- 9.3.2. Mobile and Consumer
- 9.3.3. Automotive
- 9.3.4. Medical
- 9.3.5. Industrial
- 9.3.6. Aerospace and Defense
- 9.4. Market Analysis, Insights and Forecast - by Application
- 9.4.1. Datacom
- 9.4.2. Optical Mouse
- 9.4.3. Facial Recognition and Depth Camera
- 9.4.4. Gesture Recognition
- 9.4.5. Laser Autofocus
- 9.4.6. Proximity sensing
- 9.4.7. Iris Scan
- 9.4.8. Medical
- 9.4.9. ADAS LiDAR
- 9.4.10. Industrial Applications
- 9.4.11. Other Applications
- 9.1. Market Analysis, Insights and Forecast - by Wavelength
- 10. South Korea VCSEL Market Analysis, Insights and Forecast, 2019-2031
- 10.1. Market Analysis, Insights and Forecast - by Wavelength
- 10.1.1. Red (650-750 nm)
- 10.1.2. Near-infrared (750-1400 nm)
- 10.1.3. Shortwave-infrared (1400-3000 nm)
- 10.2. Market Analysis, Insights and Forecast - by Die-size
- 10.2.1. 0.02 - 0.06 mm2
- 10.2.2. 0.06 - 0.4 mm2
- 10.2.3. 0.4 - 1.3 mm2
- 10.2.4. 10 - 75 mm2
- 10.3. Market Analysis, Insights and Forecast - by End-user Industry
- 10.3.1. Telecom
- 10.3.2. Mobile and Consumer
- 10.3.3. Automotive
- 10.3.4. Medical
- 10.3.5. Industrial
- 10.3.6. Aerospace and Defense
- 10.4. Market Analysis, Insights and Forecast - by Application
- 10.4.1. Datacom
- 10.4.2. Optical Mouse
- 10.4.3. Facial Recognition and Depth Camera
- 10.4.4. Gesture Recognition
- 10.4.5. Laser Autofocus
- 10.4.6. Proximity sensing
- 10.4.7. Iris Scan
- 10.4.8. Medical
- 10.4.9. ADAS LiDAR
- 10.4.10. Industrial Applications
- 10.4.11. Other Applications
- 10.1. Market Analysis, Insights and Forecast - by Wavelength
- 11. Japan VCSEL Market Analysis, Insights and Forecast, 2019-2031
- 11.1. Market Analysis, Insights and Forecast - by Wavelength
- 11.1.1. Red (650-750 nm)
- 11.1.2. Near-infrared (750-1400 nm)
- 11.1.3. Shortwave-infrared (1400-3000 nm)
- 11.2. Market Analysis, Insights and Forecast - by Die-size
- 11.2.1. 0.02 - 0.06 mm2
- 11.2.2. 0.06 - 0.4 mm2
- 11.2.3. 0.4 - 1.3 mm2
- 11.2.4. 10 - 75 mm2
- 11.3. Market Analysis, Insights and Forecast - by End-user Industry
- 11.3.1. Telecom
- 11.3.2. Mobile and Consumer
- 11.3.3. Automotive
- 11.3.4. Medical
- 11.3.5. Industrial
- 11.3.6. Aerospace and Defense
- 11.4. Market Analysis, Insights and Forecast - by Application
- 11.4.1. Datacom
- 11.4.2. Optical Mouse
- 11.4.3. Facial Recognition and Depth Camera
- 11.4.4. Gesture Recognition
- 11.4.5. Laser Autofocus
- 11.4.6. Proximity sensing
- 11.4.7. Iris Scan
- 11.4.8. Medical
- 11.4.9. ADAS LiDAR
- 11.4.10. Industrial Applications
- 11.4.11. Other Applications
- 11.1. Market Analysis, Insights and Forecast - by Wavelength
- 12. Rest of the World VCSEL Market Analysis, Insights and Forecast, 2019-2031
- 12.1. Market Analysis, Insights and Forecast - by Wavelength
- 12.1.1. Red (650-750 nm)
- 12.1.2. Near-infrared (750-1400 nm)
- 12.1.3. Shortwave-infrared (1400-3000 nm)
- 12.2. Market Analysis, Insights and Forecast - by Die-size
- 12.2.1. 0.02 - 0.06 mm2
- 12.2.2. 0.06 - 0.4 mm2
- 12.2.3. 0.4 - 1.3 mm2
- 12.2.4. 10 - 75 mm2
- 12.3. Market Analysis, Insights and Forecast - by End-user Industry
- 12.3.1. Telecom
- 12.3.2. Mobile and Consumer
- 12.3.3. Automotive
- 12.3.4. Medical
- 12.3.5. Industrial
- 12.3.6. Aerospace and Defense
- 12.4. Market Analysis, Insights and Forecast - by Application
- 12.4.1. Datacom
- 12.4.2. Optical Mouse
- 12.4.3. Facial Recognition and Depth Camera
- 12.4.4. Gesture Recognition
- 12.4.5. Laser Autofocus
- 12.4.6. Proximity sensing
- 12.4.7. Iris Scan
- 12.4.8. Medical
- 12.4.9. ADAS LiDAR
- 12.4.10. Industrial Applications
- 12.4.11. Other Applications
- 12.1. Market Analysis, Insights and Forecast - by Wavelength
- 13. North America VCSEL Market Analysis, Insights and Forecast, 2019-2031
- 13.1. Market Analysis, Insights and Forecast - By Country/Sub-region
- 13.1.1 United States
- 13.1.2 Canada
- 13.1.3 Mexico
- 14. Europe VCSEL Market Analysis, Insights and Forecast, 2019-2031
- 14.1. Market Analysis, Insights and Forecast - By Country/Sub-region
- 14.1.1 Germany
- 14.1.2 United Kingdom
- 14.1.3 France
- 14.1.4 Spain
- 14.1.5 Italy
- 14.1.6 Spain
- 14.1.7 Belgium
- 14.1.8 Netherland
- 14.1.9 Nordics
- 14.1.10 Rest of Europe
- 15. Asia Pacific VCSEL Market Analysis, Insights and Forecast, 2019-2031
- 15.1. Market Analysis, Insights and Forecast - By Country/Sub-region
- 15.1.1 China
- 15.1.2 Japan
- 15.1.3 India
- 15.1.4 South Korea
- 15.1.5 Southeast Asia
- 15.1.6 Australia
- 15.1.7 Indonesia
- 15.1.8 Phillipes
- 15.1.9 Singapore
- 15.1.10 Thailandc
- 15.1.11 Rest of Asia Pacific
- 16. South America VCSEL Market Analysis, Insights and Forecast, 2019-2031
- 16.1. Market Analysis, Insights and Forecast - By Country/Sub-region
- 16.1.1 Brazil
- 16.1.2 Argentina
- 16.1.3 Peru
- 16.1.4 Chile
- 16.1.5 Colombia
- 16.1.6 Ecuador
- 16.1.7 Venezuela
- 16.1.8 Rest of South America
- 17. North America VCSEL Market Analysis, Insights and Forecast, 2019-2031
- 17.1. Market Analysis, Insights and Forecast - By Country/Sub-region
- 17.1.1 United States
- 17.1.2 Canada
- 17.1.3 Mexico
- 18. MEA VCSEL Market Analysis, Insights and Forecast, 2019-2031
- 18.1. Market Analysis, Insights and Forecast - By Country/Sub-region
- 18.1.1 United Arab Emirates
- 18.1.2 Saudi Arabia
- 18.1.3 South Africa
- 18.1.4 Rest of Middle East and Africa
- 19. Competitive Analysis
- 19.1. Global Market Share Analysis 2024
- 19.2. Company Profiles
- 19.2.1 Coherent Corporation
- 19.2.1.1. Overview
- 19.2.1.2. Products
- 19.2.1.3. SWOT Analysis
- 19.2.1.4. Recent Developments
- 19.2.1.5. Financials (Based on Availability)
- 19.2.2 Hamamatsu Photonics KK
- 19.2.2.1. Overview
- 19.2.2.2. Products
- 19.2.2.3. SWOT Analysis
- 19.2.2.4. Recent Developments
- 19.2.2.5. Financials (Based on Availability)
- 19.2.3 TRUMPF Group
- 19.2.3.1. Overview
- 19.2.3.2. Products
- 19.2.3.3. SWOT Analysis
- 19.2.3.4. Recent Developments
- 19.2.3.5. Financials (Based on Availability)
- 19.2.4 ams OSRAM AG
- 19.2.4.1. Overview
- 19.2.4.2. Products
- 19.2.4.3. SWOT Analysis
- 19.2.4.4. Recent Developments
- 19.2.4.5. Financials (Based on Availability)
- 19.2.5 Broadcom Inc
- 19.2.5.1. Overview
- 19.2.5.2. Products
- 19.2.5.3. SWOT Analysis
- 19.2.5.4. Recent Developments
- 19.2.5.5. Financials (Based on Availability)
- 19.2.6 Leanardo Electronics US (Lasertel)
- 19.2.6.1. Overview
- 19.2.6.2. Products
- 19.2.6.3. SWOT Analysis
- 19.2.6.4. Recent Developments
- 19.2.6.5. Financials (Based on Availability)
- 19.2.7 Lumentum Operations LLC
- 19.2.7.1. Overview
- 19.2.7.2. Products
- 19.2.7.3. SWOT Analysis
- 19.2.7.4. Recent Developments
- 19.2.7.5. Financials (Based on Availability)
- 19.2.8 Vertilite Inc
- 19.2.8.1. Overview
- 19.2.8.2. Products
- 19.2.8.3. SWOT Analysis
- 19.2.8.4. Recent Developments
- 19.2.8.5. Financials (Based on Availability)
- 19.2.9 Santec Corporatio
- 19.2.9.1. Overview
- 19.2.9.2. Products
- 19.2.9.3. SWOT Analysis
- 19.2.9.4. Recent Developments
- 19.2.9.5. Financials (Based on Availability)
- 19.2.10 Teledyne FLIR Systems Inc
- 19.2.10.1. Overview
- 19.2.10.2. Products
- 19.2.10.3. SWOT Analysis
- 19.2.10.4. Recent Developments
- 19.2.10.5. Financials (Based on Availability)
- 19.2.11 Vixar Inc (OSRAM AG)
- 19.2.11.1. Overview
- 19.2.11.2. Products
- 19.2.11.3. SWOT Analysis
- 19.2.11.4. Recent Developments
- 19.2.11.5. Financials (Based on Availability)
- 19.2.12 HLJ Technology Co Ltd
- 19.2.12.1. Overview
- 19.2.12.2. Products
- 19.2.12.3. SWOT Analysis
- 19.2.12.4. Recent Developments
- 19.2.12.5. Financials (Based on Availability)
- 19.2.1 Coherent Corporation
List of Figures
- Figure 1: Global VCSEL Market Revenue Breakdown (Million, %) by Region 2024 & 2032
- Figure 2: North America VCSEL Market Revenue (Million), by Country 2024 & 2032
- Figure 3: North America VCSEL Market Revenue Share (%), by Country 2024 & 2032
- Figure 4: Europe VCSEL Market Revenue (Million), by Country 2024 & 2032
- Figure 5: Europe VCSEL Market Revenue Share (%), by Country 2024 & 2032
- Figure 6: Asia Pacific VCSEL Market Revenue (Million), by Country 2024 & 2032
- Figure 7: Asia Pacific VCSEL Market Revenue Share (%), by Country 2024 & 2032
- Figure 8: South America VCSEL Market Revenue (Million), by Country 2024 & 2032
- Figure 9: South America VCSEL Market Revenue Share (%), by Country 2024 & 2032
- Figure 10: North America VCSEL Market Revenue (Million), by Country 2024 & 2032
- Figure 11: North America VCSEL Market Revenue Share (%), by Country 2024 & 2032
- Figure 12: MEA VCSEL Market Revenue (Million), by Country 2024 & 2032
- Figure 13: MEA VCSEL Market Revenue Share (%), by Country 2024 & 2032
- Figure 14: North America VCSEL Market Revenue (Million), by Wavelength 2024 & 2032
- Figure 15: North America VCSEL Market Revenue Share (%), by Wavelength 2024 & 2032
- Figure 16: North America VCSEL Market Revenue (Million), by Die-size 2024 & 2032
- Figure 17: North America VCSEL Market Revenue Share (%), by Die-size 2024 & 2032
- Figure 18: North America VCSEL Market Revenue (Million), by End-user Industry 2024 & 2032
- Figure 19: North America VCSEL Market Revenue Share (%), by End-user Industry 2024 & 2032
- Figure 20: North America VCSEL Market Revenue (Million), by Application 2024 & 2032
- Figure 21: North America VCSEL Market Revenue Share (%), by Application 2024 & 2032
- Figure 22: North America VCSEL Market Revenue (Million), by Country 2024 & 2032
- Figure 23: North America VCSEL Market Revenue Share (%), by Country 2024 & 2032
- Figure 24: Europe VCSEL Market Revenue (Million), by Wavelength 2024 & 2032
- Figure 25: Europe VCSEL Market Revenue Share (%), by Wavelength 2024 & 2032
- Figure 26: Europe VCSEL Market Revenue (Million), by Die-size 2024 & 2032
- Figure 27: Europe VCSEL Market Revenue Share (%), by Die-size 2024 & 2032
- Figure 28: Europe VCSEL Market Revenue (Million), by End-user Industry 2024 & 2032
- Figure 29: Europe VCSEL Market Revenue Share (%), by End-user Industry 2024 & 2032
- Figure 30: Europe VCSEL Market Revenue (Million), by Application 2024 & 2032
- Figure 31: Europe VCSEL Market Revenue Share (%), by Application 2024 & 2032
- Figure 32: Europe VCSEL Market Revenue (Million), by Country 2024 & 2032
- Figure 33: Europe VCSEL Market Revenue Share (%), by Country 2024 & 2032
- Figure 34: Taiwan VCSEL Market Revenue (Million), by Wavelength 2024 & 2032
- Figure 35: Taiwan VCSEL Market Revenue Share (%), by Wavelength 2024 & 2032
- Figure 36: Taiwan VCSEL Market Revenue (Million), by Die-size 2024 & 2032
- Figure 37: Taiwan VCSEL Market Revenue Share (%), by Die-size 2024 & 2032
- Figure 38: Taiwan VCSEL Market Revenue (Million), by End-user Industry 2024 & 2032
- Figure 39: Taiwan VCSEL Market Revenue Share (%), by End-user Industry 2024 & 2032
- Figure 40: Taiwan VCSEL Market Revenue (Million), by Application 2024 & 2032
- Figure 41: Taiwan VCSEL Market Revenue Share (%), by Application 2024 & 2032
- Figure 42: Taiwan VCSEL Market Revenue (Million), by Country 2024 & 2032
- Figure 43: Taiwan VCSEL Market Revenue Share (%), by Country 2024 & 2032
- Figure 44: China VCSEL Market Revenue (Million), by Wavelength 2024 & 2032
- Figure 45: China VCSEL Market Revenue Share (%), by Wavelength 2024 & 2032
- Figure 46: China VCSEL Market Revenue (Million), by Die-size 2024 & 2032
- Figure 47: China VCSEL Market Revenue Share (%), by Die-size 2024 & 2032
- Figure 48: China VCSEL Market Revenue (Million), by End-user Industry 2024 & 2032
- Figure 49: China VCSEL Market Revenue Share (%), by End-user Industry 2024 & 2032
- Figure 50: China VCSEL Market Revenue (Million), by Application 2024 & 2032
- Figure 51: China VCSEL Market Revenue Share (%), by Application 2024 & 2032
- Figure 52: China VCSEL Market Revenue (Million), by Country 2024 & 2032
- Figure 53: China VCSEL Market Revenue Share (%), by Country 2024 & 2032
- Figure 54: South Korea VCSEL Market Revenue (Million), by Wavelength 2024 & 2032
- Figure 55: South Korea VCSEL Market Revenue Share (%), by Wavelength 2024 & 2032
- Figure 56: South Korea VCSEL Market Revenue (Million), by Die-size 2024 & 2032
- Figure 57: South Korea VCSEL Market Revenue Share (%), by Die-size 2024 & 2032
- Figure 58: South Korea VCSEL Market Revenue (Million), by End-user Industry 2024 & 2032
- Figure 59: South Korea VCSEL Market Revenue Share (%), by End-user Industry 2024 & 2032
- Figure 60: South Korea VCSEL Market Revenue (Million), by Application 2024 & 2032
- Figure 61: South Korea VCSEL Market Revenue Share (%), by Application 2024 & 2032
- Figure 62: South Korea VCSEL Market Revenue (Million), by Country 2024 & 2032
- Figure 63: South Korea VCSEL Market Revenue Share (%), by Country 2024 & 2032
- Figure 64: Japan VCSEL Market Revenue (Million), by Wavelength 2024 & 2032
- Figure 65: Japan VCSEL Market Revenue Share (%), by Wavelength 2024 & 2032
- Figure 66: Japan VCSEL Market Revenue (Million), by Die-size 2024 & 2032
- Figure 67: Japan VCSEL Market Revenue Share (%), by Die-size 2024 & 2032
- Figure 68: Japan VCSEL Market Revenue (Million), by End-user Industry 2024 & 2032
- Figure 69: Japan VCSEL Market Revenue Share (%), by End-user Industry 2024 & 2032
- Figure 70: Japan VCSEL Market Revenue (Million), by Application 2024 & 2032
- Figure 71: Japan VCSEL Market Revenue Share (%), by Application 2024 & 2032
- Figure 72: Japan VCSEL Market Revenue (Million), by Country 2024 & 2032
- Figure 73: Japan VCSEL Market Revenue Share (%), by Country 2024 & 2032
- Figure 74: Rest of the World VCSEL Market Revenue (Million), by Wavelength 2024 & 2032
- Figure 75: Rest of the World VCSEL Market Revenue Share (%), by Wavelength 2024 & 2032
- Figure 76: Rest of the World VCSEL Market Revenue (Million), by Die-size 2024 & 2032
- Figure 77: Rest of the World VCSEL Market Revenue Share (%), by Die-size 2024 & 2032
- Figure 78: Rest of the World VCSEL Market Revenue (Million), by End-user Industry 2024 & 2032
- Figure 79: Rest of the World VCSEL Market Revenue Share (%), by End-user Industry 2024 & 2032
- Figure 80: Rest of the World VCSEL Market Revenue (Million), by Application 2024 & 2032
- Figure 81: Rest of the World VCSEL Market Revenue Share (%), by Application 2024 & 2032
- Figure 82: Rest of the World VCSEL Market Revenue (Million), by Country 2024 & 2032
- Figure 83: Rest of the World VCSEL Market Revenue Share (%), by Country 2024 & 2032
List of Tables
- Table 1: Global VCSEL Market Revenue Million Forecast, by Region 2019 & 2032
- Table 2: Global VCSEL Market Revenue Million Forecast, by Wavelength 2019 & 2032
- Table 3: Global VCSEL Market Revenue Million Forecast, by Die-size 2019 & 2032
- Table 4: Global VCSEL Market Revenue Million Forecast, by End-user Industry 2019 & 2032
- Table 5: Global VCSEL Market Revenue Million Forecast, by Application 2019 & 2032
- Table 6: Global VCSEL Market Revenue Million Forecast, by Region 2019 & 2032
- Table 7: Global VCSEL Market Revenue Million Forecast, by Country 2019 & 2032
- Table 8: United States VCSEL Market Revenue (Million) Forecast, by Application 2019 & 2032
- Table 9: Canada VCSEL Market Revenue (Million) Forecast, by Application 2019 & 2032
- Table 10: Mexico VCSEL Market Revenue (Million) Forecast, by Application 2019 & 2032
- Table 11: Global VCSEL Market Revenue Million Forecast, by Country 2019 & 2032
- Table 12: Germany VCSEL Market Revenue (Million) Forecast, by Application 2019 & 2032
- Table 13: United Kingdom VCSEL Market Revenue (Million) Forecast, by Application 2019 & 2032
- Table 14: France VCSEL Market Revenue (Million) Forecast, by Application 2019 & 2032
- Table 15: Spain VCSEL Market Revenue (Million) Forecast, by Application 2019 & 2032
- Table 16: Italy VCSEL Market Revenue (Million) Forecast, by Application 2019 & 2032
- Table 17: Spain VCSEL Market Revenue (Million) Forecast, by Application 2019 & 2032
- Table 18: Belgium VCSEL Market Revenue (Million) Forecast, by Application 2019 & 2032
- Table 19: Netherland VCSEL Market Revenue (Million) Forecast, by Application 2019 & 2032
- Table 20: Nordics VCSEL Market Revenue (Million) Forecast, by Application 2019 & 2032
- Table 21: Rest of Europe VCSEL Market Revenue (Million) Forecast, by Application 2019 & 2032
- Table 22: Global VCSEL Market Revenue Million Forecast, by Country 2019 & 2032
- Table 23: China VCSEL Market Revenue (Million) Forecast, by Application 2019 & 2032
- Table 24: Japan VCSEL Market Revenue (Million) Forecast, by Application 2019 & 2032
- Table 25: India VCSEL Market Revenue (Million) Forecast, by Application 2019 & 2032
- Table 26: South Korea VCSEL Market Revenue (Million) Forecast, by Application 2019 & 2032
- Table 27: Southeast Asia VCSEL Market Revenue (Million) Forecast, by Application 2019 & 2032
- Table 28: Australia VCSEL Market Revenue (Million) Forecast, by Application 2019 & 2032
- Table 29: Indonesia VCSEL Market Revenue (Million) Forecast, by Application 2019 & 2032
- Table 30: Phillipes VCSEL Market Revenue (Million) Forecast, by Application 2019 & 2032
- Table 31: Singapore VCSEL Market Revenue (Million) Forecast, by Application 2019 & 2032
- Table 32: Thailandc VCSEL Market Revenue (Million) Forecast, by Application 2019 & 2032
- Table 33: Rest of Asia Pacific VCSEL Market Revenue (Million) Forecast, by Application 2019 & 2032
- Table 34: Global VCSEL Market Revenue Million Forecast, by Country 2019 & 2032
- Table 35: Brazil VCSEL Market Revenue (Million) Forecast, by Application 2019 & 2032
- Table 36: Argentina VCSEL Market Revenue (Million) Forecast, by Application 2019 & 2032
- Table 37: Peru VCSEL Market Revenue (Million) Forecast, by Application 2019 & 2032
- Table 38: Chile VCSEL Market Revenue (Million) Forecast, by Application 2019 & 2032
- Table 39: Colombia VCSEL Market Revenue (Million) Forecast, by Application 2019 & 2032
- Table 40: Ecuador VCSEL Market Revenue (Million) Forecast, by Application 2019 & 2032
- Table 41: Venezuela VCSEL Market Revenue (Million) Forecast, by Application 2019 & 2032
- Table 42: Rest of South America VCSEL Market Revenue (Million) Forecast, by Application 2019 & 2032
- Table 43: Global VCSEL Market Revenue Million Forecast, by Country 2019 & 2032
- Table 44: United States VCSEL Market Revenue (Million) Forecast, by Application 2019 & 2032
- Table 45: Canada VCSEL Market Revenue (Million) Forecast, by Application 2019 & 2032
- Table 46: Mexico VCSEL Market Revenue (Million) Forecast, by Application 2019 & 2032
- Table 47: Global VCSEL Market Revenue Million Forecast, by Country 2019 & 2032
- Table 48: United Arab Emirates VCSEL Market Revenue (Million) Forecast, by Application 2019 & 2032
- Table 49: Saudi Arabia VCSEL Market Revenue (Million) Forecast, by Application 2019 & 2032
- Table 50: South Africa VCSEL Market Revenue (Million) Forecast, by Application 2019 & 2032
- Table 51: Rest of Middle East and Africa VCSEL Market Revenue (Million) Forecast, by Application 2019 & 2032
- Table 52: Global VCSEL Market Revenue Million Forecast, by Wavelength 2019 & 2032
- Table 53: Global VCSEL Market Revenue Million Forecast, by Die-size 2019 & 2032
- Table 54: Global VCSEL Market Revenue Million Forecast, by End-user Industry 2019 & 2032
- Table 55: Global VCSEL Market Revenue Million Forecast, by Application 2019 & 2032
- Table 56: Global VCSEL Market Revenue Million Forecast, by Country 2019 & 2032
- Table 57: Global VCSEL Market Revenue Million Forecast, by Wavelength 2019 & 2032
- Table 58: Global VCSEL Market Revenue Million Forecast, by Die-size 2019 & 2032
- Table 59: Global VCSEL Market Revenue Million Forecast, by End-user Industry 2019 & 2032
- Table 60: Global VCSEL Market Revenue Million Forecast, by Application 2019 & 2032
- Table 61: Global VCSEL Market Revenue Million Forecast, by Country 2019 & 2032
- Table 62: Global VCSEL Market Revenue Million Forecast, by Wavelength 2019 & 2032
- Table 63: Global VCSEL Market Revenue Million Forecast, by Die-size 2019 & 2032
- Table 64: Global VCSEL Market Revenue Million Forecast, by End-user Industry 2019 & 2032
- Table 65: Global VCSEL Market Revenue Million Forecast, by Application 2019 & 2032
- Table 66: Global VCSEL Market Revenue Million Forecast, by Country 2019 & 2032
- Table 67: Global VCSEL Market Revenue Million Forecast, by Wavelength 2019 & 2032
- Table 68: Global VCSEL Market Revenue Million Forecast, by Die-size 2019 & 2032
- Table 69: Global VCSEL Market Revenue Million Forecast, by End-user Industry 2019 & 2032
- Table 70: Global VCSEL Market Revenue Million Forecast, by Application 2019 & 2032
- Table 71: Global VCSEL Market Revenue Million Forecast, by Country 2019 & 2032
- Table 72: Global VCSEL Market Revenue Million Forecast, by Wavelength 2019 & 2032
- Table 73: Global VCSEL Market Revenue Million Forecast, by Die-size 2019 & 2032
- Table 74: Global VCSEL Market Revenue Million Forecast, by End-user Industry 2019 & 2032
- Table 75: Global VCSEL Market Revenue Million Forecast, by Application 2019 & 2032
- Table 76: Global VCSEL Market Revenue Million Forecast, by Country 2019 & 2032
- Table 77: Global VCSEL Market Revenue Million Forecast, by Wavelength 2019 & 2032
- Table 78: Global VCSEL Market Revenue Million Forecast, by Die-size 2019 & 2032
- Table 79: Global VCSEL Market Revenue Million Forecast, by End-user Industry 2019 & 2032
- Table 80: Global VCSEL Market Revenue Million Forecast, by Application 2019 & 2032
- Table 81: Global VCSEL Market Revenue Million Forecast, by Country 2019 & 2032
- Table 82: Global VCSEL Market Revenue Million Forecast, by Wavelength 2019 & 2032
- Table 83: Global VCSEL Market Revenue Million Forecast, by Die-size 2019 & 2032
- Table 84: Global VCSEL Market Revenue Million Forecast, by End-user Industry 2019 & 2032
- Table 85: Global VCSEL Market Revenue Million Forecast, by Application 2019 & 2032
- Table 86: Global VCSEL Market Revenue Million Forecast, by Country 2019 & 2032
Frequently Asked Questions
1. What is the projected Compound Annual Growth Rate (CAGR) of the VCSEL Market?
The projected CAGR is approximately 18.60%.
2. Which companies are prominent players in the VCSEL Market?
Key companies in the market include Coherent Corporation, Hamamatsu Photonics KK, TRUMPF Group, ams OSRAM AG, Broadcom Inc, Leanardo Electronics US (Lasertel), Lumentum Operations LLC, Vertilite Inc, Santec Corporatio, Teledyne FLIR Systems Inc, Vixar Inc (OSRAM AG), HLJ Technology Co Ltd.
3. What are the main segments of the VCSEL Market?
The market segments include Wavelength, Die-size, End-user Industry, Application.
4. Can you provide details about the market size?
The market size is estimated to be USD 2.10 Million as of 2022.
5. What are some drivers contributing to market growth?
Increasing Adoption of VCSEL in Data Centers; Growing Demand for 3D Sensing Applications in Smartphones.
6. What are the notable trends driving market growth?
ADAS and LiDAR to be the Fastest-growing Application.
7. Are there any restraints impacting market growth?
Low Penetration of InP-based VCSELs and Limited Data Transmission Range.
8. Can you provide examples of recent developments in the market?
November 2023 - The Japanese government announced that it would allocate roughly JPY 2 trillion (USD 13 billion) to support efforts to boost its chip industry, marking the latest move by the Asian nation to reclaim its past glory in the critical sector. The country is a leading provider of chipmaking tools and materials that lost its edge in manufacturing in recent decades and is now providing subsidies to chipmakers to build capacity.
9. What pricing options are available for accessing the report?
Pricing options include single-user, multi-user, and enterprise licenses priced at USD 4750, USD 5250, and USD 8750 respectively.
10. Is the market size provided in terms of value or volume?
The market size is provided in terms of value, measured in Million.
11. Are there any specific market keywords associated with the report?
Yes, the market keyword associated with the report is "VCSEL Market," which aids in identifying and referencing the specific market segment covered.
12. How do I determine which pricing option suits my needs best?
The pricing options vary based on user requirements and access needs. Individual users may opt for single-user licenses, while businesses requiring broader access may choose multi-user or enterprise licenses for cost-effective access to the report.
13. Are there any additional resources or data provided in the VCSEL Market report?
While the report offers comprehensive insights, it's advisable to review the specific contents or supplementary materials provided to ascertain if additional resources or data are available.
14. How can I stay updated on further developments or reports in the VCSEL Market?
To stay informed about further developments, trends, and reports in the VCSEL Market, consider subscribing to industry newsletters, following relevant companies and organizations, or regularly checking reputable industry news sources and publications.
Methodology
Step 1 - Identification of Relevant Samples Size from Population Database


Step 2 - Approaches for Defining Global Market Size (Value, Volume* & Price*)

Note*: In applicable scenarios
Step 3 - Data Sources
Primary Research
- Web Analytics
- Survey Reports
- Research Institute
- Latest Research Reports
- Opinion Leaders
Secondary Research
- Annual Reports
- White Paper
- Latest Press Release
- Industry Association
- Paid Database
- Investor Presentations

Step 4 - Data Triangulation
Involves using different sources of information in order to increase the validity of a study
These sources are likely to be stakeholders in a program - participants, other researchers, program staff, other community members, and so on.
Then we put all data in single framework & apply various statistical tools to find out the dynamic on the market.
During the analysis stage, feedback from the stakeholder groups would be compared to determine areas of agreement as well as areas of divergence
