

Key Insights
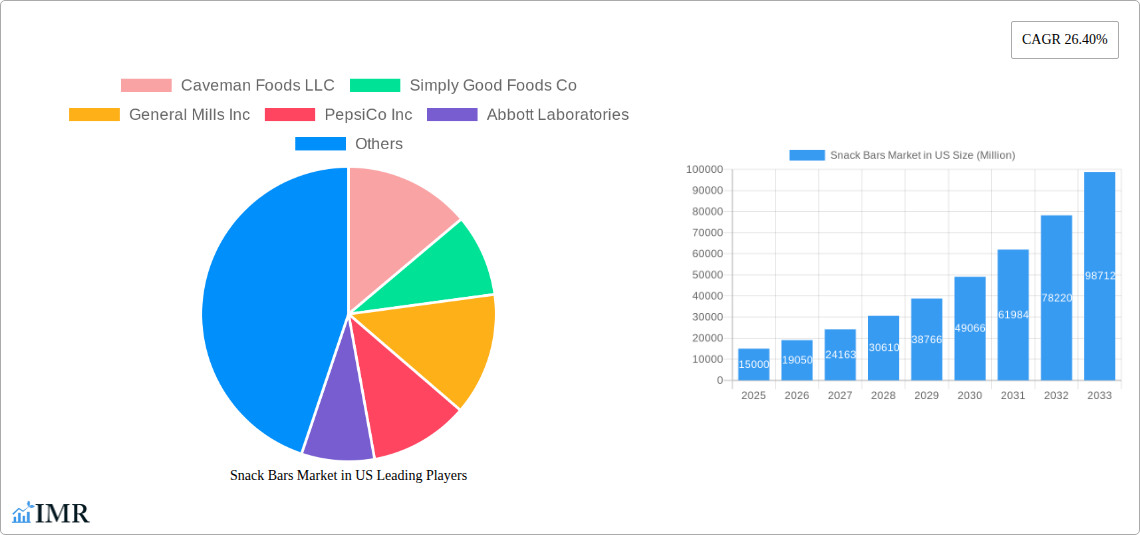
The US snack bar market, a dynamic and rapidly expanding segment within the broader food industry, is projected to experience robust growth over the forecast period (2025-2033). Driven by increasing consumer demand for convenient, nutritious, and on-the-go food options, the market is witnessing a surge in popularity across various demographics. The significant rise in health-conscious consumers seeking protein-rich and functional snack bars fuels this growth. Key segments like protein bars and fruit & nut bars are experiencing particularly high demand, reflecting the growing awareness of the importance of balanced nutrition and dietary supplements. The market's success is also fueled by the expansion of distribution channels, with online retail stores witnessing exponential growth alongside established channels like supermarkets and convenience stores. Competition remains fierce, with established giants like General Mills and PepsiCo vying for market share against innovative startups and smaller, specialized brands that are catering to niche dietary preferences and health trends. The continued rise in disposable incomes and changing lifestyles are also significant factors contributing to the market's expansion. Furthermore, strategic partnerships, product innovations, and effective marketing campaigns are key strategies employed by players to solidify their presence in the highly competitive market.
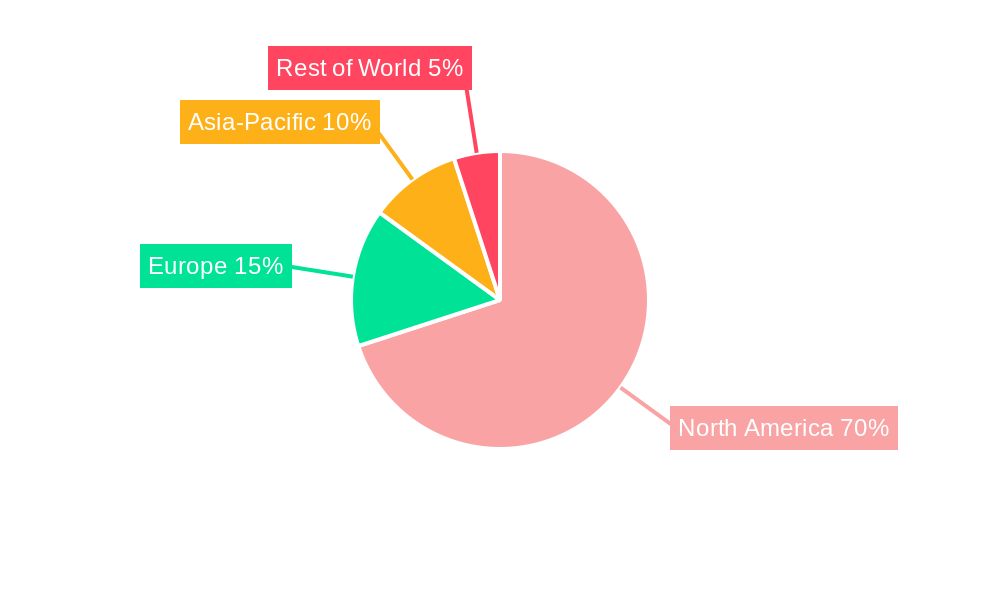
The market segmentation highlights a diversified consumer base with varying preferences. Convenience stores provide immediate accessibility, while online retailers offer broader selection and home delivery. Supermarkets and hypermarkets cater to a larger volume of purchases. The confectionery variant segment is influenced by evolving taste preferences and dietary needs. Cereal bars cater to a broader audience, while the increasing popularity of protein and fruit & nut bars reflects the rising focus on health and wellness. Geographic concentration is high in North America, particularly the US, due to factors such as high disposable income, established distribution networks, and strong consumer awareness of health and wellness trends. However, opportunities for growth exist in other regions as well, reflecting the global shift towards convenient and healthy snacking options. The projected CAGR of 26.40% signifies a substantial expansion in market value, emphasizing the continued growth trajectory of the US snack bar industry.
Snack Bars Market in US: A Comprehensive Report (2019-2033)
This comprehensive report provides an in-depth analysis of the US snack bars market, encompassing market dynamics, growth trends, regional segmentation, product landscape, key players, and future outlook. The study period covers 2019-2033, with 2025 as the base year and forecast period extending to 2033. The report leverages extensive data analysis to deliver actionable insights for industry professionals and investors. The market is segmented by distribution channel (Convenience Store, Online Retail Store, Supermarket/Hypermarket, Others) and confectionery variant (Cereal Bar, Fruit & Nut Bar, Protein Bar). The total market size is projected to reach xx Million units by 2033.
Snack Bars Market in US Market Dynamics & Structure
The US snack bars market is a highly competitive landscape characterized by a diverse range of players, from established food giants to emerging niche brands. Market concentration is moderate, with a few dominant players holding significant market share, while numerous smaller companies cater to specialized segments. Technological innovation, particularly in ingredient sourcing, manufacturing processes, and packaging, significantly impacts market dynamics. Stringent regulatory frameworks related to food safety and labeling influence product development and marketing strategies. Consumers increasingly seek healthier and functional snack options, driving demand for protein bars, organic bars, and bars with added nutritional benefits. This trend is further fueled by rising health consciousness and a growing preference for convenient, on-the-go snacks. The market also sees continuous M&A activity, with larger players strategically acquiring smaller companies to expand their product portfolios and market reach. In the historical period (2019-2024), the number of M&A deals averaged xx per year, representing a xx% increase compared to the previous five-year period.
- Market Concentration: Moderate, with top 5 players holding approximately xx% market share.
- Technological Innovation: Focus on natural ingredients, improved nutritional profiles, and sustainable packaging.
- Regulatory Framework: Stringent food safety and labeling regulations.
- Competitive Substitutes: Other convenient snack options, like chips, crackers, and fruit.
- End-User Demographics: Primarily young adults and health-conscious consumers.
- M&A Trends: Increased consolidation through acquisitions of smaller, specialized brands.
Snack Bars Market in US Growth Trends & Insights
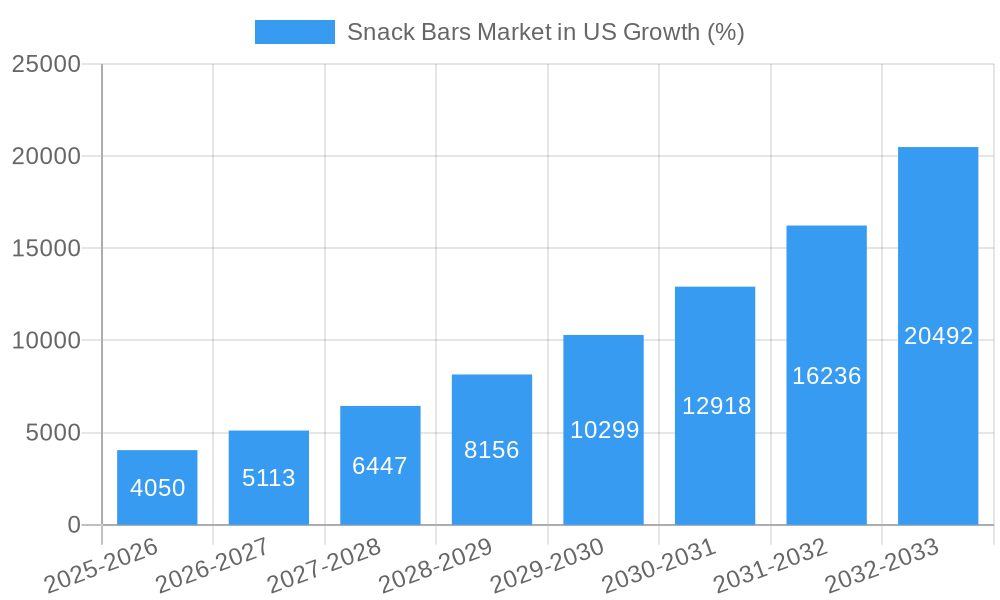
The US snack bars market has witnessed robust growth over the historical period (2019-2024), driven by increasing demand for convenient and healthy snack options. Market size grew from xx Million units in 2019 to xx Million units in 2024, registering a CAGR of xx%. This growth is attributed to several factors, including the rising popularity of health and wellness trends, increased disposable incomes, and evolving consumer lifestyles. Technological advancements in manufacturing and packaging have also contributed to enhanced product quality and shelf life. Consumer behavior shifts toward healthier options, such as protein bars and organic bars, have created new market opportunities. Furthermore, the rise of e-commerce has broadened the distribution channels for snack bars, increasing their accessibility to consumers. The market penetration rate for snack bars has increased from xx% in 2019 to xx% in 2024. We project continued growth in the forecast period (2025-2033), with a projected CAGR of xx%. Emerging trends like personalized nutrition and sustainable sourcing will further shape the market's trajectory.
Dominant Regions, Countries, or Segments in Snack Bars Market in US
The US snack bar market exhibits significant regional variations in consumption patterns and growth potential. The Supermarket/Hypermarket channel remains dominant, representing approximately xx% of the total market share in 2024 due to high consumer traffic and established brand presence. However, the Online Retail Store channel is experiencing rapid growth, with a projected CAGR of xx% during the forecast period, driven by the rising adoption of online shopping and the convenience it offers. Within confectionery variants, Protein Bars are driving the highest growth, capitalizing on the health and fitness trend. This segment is expected to maintain its dominance throughout the forecast period.
- Key Drivers for Supermarket/Hypermarket: Wide product availability, established brand presence, and consumer familiarity.
- Key Drivers for Online Retail: Convenience, wider product selection, and targeted marketing campaigns.
- Key Drivers for Protein Bars: Health and fitness trends, increasing demand for functional foods.
- Regional Variations: Growth rates vary across regions, influenced by socio-economic factors and consumer preferences.
Snack Bars Market in US Product Landscape
The US snack bar market offers a diverse range of products catering to various consumer preferences and dietary needs. Innovations focus on enhancing nutritional value, improving taste and texture, and developing more sustainable packaging. Protein bars remain a significant segment, with continuous advancements in formulations to enhance protein content and improve taste profiles. The increasing popularity of organic and gluten-free options drives the development of new products that meet these specific dietary requirements. Unique selling propositions often revolve around ingredient sourcing, functional benefits (e.g., energy boosts, weight management), and unique flavor profiles. Technological advancements in manufacturing processes lead to longer shelf life, improved texture, and enhanced nutritional retention.
Key Drivers, Barriers & Challenges in Snack Bars Market in US
Key Drivers:
- Rising Health Consciousness: Increased consumer demand for healthier, functional snacks.
- Convenience Factor: Snack bars provide a quick and portable meal or snack option.
- Product Innovation: Introduction of new flavors, ingredients, and formats.
Challenges & Restraints:
- High Raw Material Costs: Increased prices of ingredients can impact profitability.
- Intense Competition: Presence of both established and emerging players creates intense competitive pressure. Market share competition resulted in a price war in 2023, impacting profit margins.
- Changing Consumer Preferences: Keeping up with evolving trends and maintaining innovation is crucial.
Emerging Opportunities in Snack Bars Market in US
- Expansion into Untapped Niches: Growing demand for specialized snack bars targeting specific dietary needs (e.g., keto, vegan).
- Innovative Packaging: Sustainable and functional packaging solutions attract environmentally conscious consumers.
- Personalized Nutrition: Tailoring snack bars to individual nutritional requirements.
Growth Accelerators in the Snack Bars Market in US Industry
Strategic partnerships with retailers and distributors expand market reach and brand visibility. Investing in research and development leads to product innovation and differentiation. Focusing on sustainable and ethical sourcing practices strengthens brand reputation and attracts environmentally conscious consumers. Expansion into new geographical markets offers significant growth potential.
Key Players Shaping the Snack Bars Market in US Market
- Caveman Foods LLC
- Simply Good Foods Co
- General Mills Inc
- PepsiCo Inc
- Abbott Laboratories
- Probar Inc
- Ferrero International SA
- Power Crunch Pty Ltd
- 1440 Foods Company
- Mars Incorporated
- The Hershey Company
- Go Macro LLC
- Mondelēz International Inc
- Kellogg Company
Notable Milestones in Snack Bars Market in US Sector
- March 2023: General Mills' Cascadian Farm launched peanut-free, USDA-certified organic granola bars with 35% less sugar.
- March 2023: General Mills expanded its Geneva factory, increasing production capacity for brands like Fiber One and Nature Valley.
- March 2023: GoMacro® introduced the Cool Endeavor™ MacroBar® and Mini in Mint Chocolate Chip flavor.
In-Depth Snack Bars Market in US Market Outlook
The US snack bars market is poised for sustained growth over the forecast period (2025-2033), driven by health consciousness, convenience, and ongoing product innovation. Strategic partnerships, focused marketing campaigns, and expansion into new channels will play pivotal roles in shaping the market's future. Continued focus on sustainable practices and personalized nutrition offers significant growth opportunities for key players. The market's potential is vast, especially given the increasing demand for healthy and convenient snack options.
Snack Bars Market in US Segmentation
-
1. Confectionery Variant
- 1.1. Cereal Bar
- 1.2. Fruit & Nut Bar
- 1.3. Protein Bar
-
2. Distribution Channel
- 2.1. Convenience Store
- 2.2. Online Retail Store
- 2.3. Supermarket/Hypermarket
- 2.4. Others
Snack Bars Market in US Segmentation By Geography
-
1. North America
- 1.1. United States
- 1.2. Canada
- 1.3. Mexico
-
2. South America
- 2.1. Brazil
- 2.2. Argentina
- 2.3. Rest of South America
-
3. Europe
- 3.1. United Kingdom
- 3.2. Germany
- 3.3. France
- 3.4. Italy
- 3.5. Spain
- 3.6. Russia
- 3.7. Benelux
- 3.8. Nordics
- 3.9. Rest of Europe
-
4. Middle East & Africa
- 4.1. Turkey
- 4.2. Israel
- 4.3. GCC
- 4.4. North Africa
- 4.5. South Africa
- 4.6. Rest of Middle East & Africa
-
5. Asia Pacific
- 5.1. China
- 5.2. India
- 5.3. Japan
- 5.4. South Korea
- 5.5. ASEAN
- 5.6. Oceania
- 5.7. Rest of Asia Pacific
Snack Bars Market in US REPORT HIGHLIGHTS
| Aspects | Details |
|---|---|
| Study Period | 2019-2033 |
| Base Year | 2024 |
| Estimated Year | 2025 |
| Forecast Period | 2025-2033 |
| Historical Period | 2019-2024 |
| Growth Rate | CAGR of 26.40% from 2019-2033 |
| Segmentation |
|
Table of Contents
- 1. Introduction
- 1.1. Research Scope
- 1.2. Market Segmentation
- 1.3. Research Methodology
- 1.4. Definitions and Assumptions
- 2. Executive Summary
- 2.1. Introduction
- 3. Market Dynamics
- 3.1. Introduction
- 3.2. Market Drivers
- 3.2.1. Increasing Urbanization; Growing Disposable Income
- 3.3. Market Restrains
- 3.3.1. High-price and additional delivery charges
- 3.4. Market Trends
- 3.4.1. OTHER KEY INDUSTRY TRENDS COVERED IN THE REPORT
- 4. Market Factor Analysis
- 4.1. Porters Five Forces
- 4.2. Supply/Value Chain
- 4.3. PESTEL analysis
- 4.4. Market Entropy
- 4.5. Patent/Trademark Analysis
- 5. Global Snack Bars Market in US Analysis, Insights and Forecast, 2019-2031
- 5.1. Market Analysis, Insights and Forecast - by Confectionery Variant
- 5.1.1. Cereal Bar
- 5.1.2. Fruit & Nut Bar
- 5.1.3. Protein Bar
- 5.2. Market Analysis, Insights and Forecast - by Distribution Channel
- 5.2.1. Convenience Store
- 5.2.2. Online Retail Store
- 5.2.3. Supermarket/Hypermarket
- 5.2.4. Others
- 5.3. Market Analysis, Insights and Forecast - by Region
- 5.3.1. North America
- 5.3.2. South America
- 5.3.3. Europe
- 5.3.4. Middle East & Africa
- 5.3.5. Asia Pacific
- 5.1. Market Analysis, Insights and Forecast - by Confectionery Variant
- 6. North America Snack Bars Market in US Analysis, Insights and Forecast, 2019-2031
- 6.1. Market Analysis, Insights and Forecast - by Confectionery Variant
- 6.1.1. Cereal Bar
- 6.1.2. Fruit & Nut Bar
- 6.1.3. Protein Bar
- 6.2. Market Analysis, Insights and Forecast - by Distribution Channel
- 6.2.1. Convenience Store
- 6.2.2. Online Retail Store
- 6.2.3. Supermarket/Hypermarket
- 6.2.4. Others
- 6.1. Market Analysis, Insights and Forecast - by Confectionery Variant
- 7. South America Snack Bars Market in US Analysis, Insights and Forecast, 2019-2031
- 7.1. Market Analysis, Insights and Forecast - by Confectionery Variant
- 7.1.1. Cereal Bar
- 7.1.2. Fruit & Nut Bar
- 7.1.3. Protein Bar
- 7.2. Market Analysis, Insights and Forecast - by Distribution Channel
- 7.2.1. Convenience Store
- 7.2.2. Online Retail Store
- 7.2.3. Supermarket/Hypermarket
- 7.2.4. Others
- 7.1. Market Analysis, Insights and Forecast - by Confectionery Variant
- 8. Europe Snack Bars Market in US Analysis, Insights and Forecast, 2019-2031
- 8.1. Market Analysis, Insights and Forecast - by Confectionery Variant
- 8.1.1. Cereal Bar
- 8.1.2. Fruit & Nut Bar
- 8.1.3. Protein Bar
- 8.2. Market Analysis, Insights and Forecast - by Distribution Channel
- 8.2.1. Convenience Store
- 8.2.2. Online Retail Store
- 8.2.3. Supermarket/Hypermarket
- 8.2.4. Others
- 8.1. Market Analysis, Insights and Forecast - by Confectionery Variant
- 9. Middle East & Africa Snack Bars Market in US Analysis, Insights and Forecast, 2019-2031
- 9.1. Market Analysis, Insights and Forecast - by Confectionery Variant
- 9.1.1. Cereal Bar
- 9.1.2. Fruit & Nut Bar
- 9.1.3. Protein Bar
- 9.2. Market Analysis, Insights and Forecast - by Distribution Channel
- 9.2.1. Convenience Store
- 9.2.2. Online Retail Store
- 9.2.3. Supermarket/Hypermarket
- 9.2.4. Others
- 9.1. Market Analysis, Insights and Forecast - by Confectionery Variant
- 10. Asia Pacific Snack Bars Market in US Analysis, Insights and Forecast, 2019-2031
- 10.1. Market Analysis, Insights and Forecast - by Confectionery Variant
- 10.1.1. Cereal Bar
- 10.1.2. Fruit & Nut Bar
- 10.1.3. Protein Bar
- 10.2. Market Analysis, Insights and Forecast - by Distribution Channel
- 10.2.1. Convenience Store
- 10.2.2. Online Retail Store
- 10.2.3. Supermarket/Hypermarket
- 10.2.4. Others
- 10.1. Market Analysis, Insights and Forecast - by Confectionery Variant
- 11. United States Snack Bars Market in US Analysis, Insights and Forecast, 2019-2031
- 12. Canada Snack Bars Market in US Analysis, Insights and Forecast, 2019-2031
- 13. Mexico Snack Bars Market in US Analysis, Insights and Forecast, 2019-2031
- 14. Competitive Analysis
- 14.1. Global Market Share Analysis 2024
- 14.2. Company Profiles
- 14.2.1 Caveman Foods LLC
- 14.2.1.1. Overview
- 14.2.1.2. Products
- 14.2.1.3. SWOT Analysis
- 14.2.1.4. Recent Developments
- 14.2.1.5. Financials (Based on Availability)
- 14.2.2 Simply Good Foods Co
- 14.2.2.1. Overview
- 14.2.2.2. Products
- 14.2.2.3. SWOT Analysis
- 14.2.2.4. Recent Developments
- 14.2.2.5. Financials (Based on Availability)
- 14.2.3 General Mills Inc
- 14.2.3.1. Overview
- 14.2.3.2. Products
- 14.2.3.3. SWOT Analysis
- 14.2.3.4. Recent Developments
- 14.2.3.5. Financials (Based on Availability)
- 14.2.4 PepsiCo Inc
- 14.2.4.1. Overview
- 14.2.4.2. Products
- 14.2.4.3. SWOT Analysis
- 14.2.4.4. Recent Developments
- 14.2.4.5. Financials (Based on Availability)
- 14.2.5 Abbott Laboratories
- 14.2.5.1. Overview
- 14.2.5.2. Products
- 14.2.5.3. SWOT Analysis
- 14.2.5.4. Recent Developments
- 14.2.5.5. Financials (Based on Availability)
- 14.2.6 Probar Inc
- 14.2.6.1. Overview
- 14.2.6.2. Products
- 14.2.6.3. SWOT Analysis
- 14.2.6.4. Recent Developments
- 14.2.6.5. Financials (Based on Availability)
- 14.2.7 Ferrero International SA
- 14.2.7.1. Overview
- 14.2.7.2. Products
- 14.2.7.3. SWOT Analysis
- 14.2.7.4. Recent Developments
- 14.2.7.5. Financials (Based on Availability)
- 14.2.8 Power Crunch Pty Ltd
- 14.2.8.1. Overview
- 14.2.8.2. Products
- 14.2.8.3. SWOT Analysis
- 14.2.8.4. Recent Developments
- 14.2.8.5. Financials (Based on Availability)
- 14.2.9 1440 Foods Company
- 14.2.9.1. Overview
- 14.2.9.2. Products
- 14.2.9.3. SWOT Analysis
- 14.2.9.4. Recent Developments
- 14.2.9.5. Financials (Based on Availability)
- 14.2.10 Mars Incorporated
- 14.2.10.1. Overview
- 14.2.10.2. Products
- 14.2.10.3. SWOT Analysis
- 14.2.10.4. Recent Developments
- 14.2.10.5. Financials (Based on Availability)
- 14.2.11 The Hershey Compan
- 14.2.11.1. Overview
- 14.2.11.2. Products
- 14.2.11.3. SWOT Analysis
- 14.2.11.4. Recent Developments
- 14.2.11.5. Financials (Based on Availability)
- 14.2.12 Go Macro LLC
- 14.2.12.1. Overview
- 14.2.12.2. Products
- 14.2.12.3. SWOT Analysis
- 14.2.12.4. Recent Developments
- 14.2.12.5. Financials (Based on Availability)
- 14.2.13 Mondelēz International Inc
- 14.2.13.1. Overview
- 14.2.13.2. Products
- 14.2.13.3. SWOT Analysis
- 14.2.13.4. Recent Developments
- 14.2.13.5. Financials (Based on Availability)
- 14.2.14 Kellogg Company
- 14.2.14.1. Overview
- 14.2.14.2. Products
- 14.2.14.3. SWOT Analysis
- 14.2.14.4. Recent Developments
- 14.2.14.5. Financials (Based on Availability)
- 14.2.1 Caveman Foods LLC
List of Figures
- Figure 1: Global Snack Bars Market in US Revenue Breakdown (Million, %) by Region 2024 & 2032
- Figure 2: North America Snack Bars Market in US Revenue (Million), by Country 2024 & 2032
- Figure 3: North America Snack Bars Market in US Revenue Share (%), by Country 2024 & 2032
- Figure 4: North America Snack Bars Market in US Revenue (Million), by Confectionery Variant 2024 & 2032
- Figure 5: North America Snack Bars Market in US Revenue Share (%), by Confectionery Variant 2024 & 2032
- Figure 6: North America Snack Bars Market in US Revenue (Million), by Distribution Channel 2024 & 2032
- Figure 7: North America Snack Bars Market in US Revenue Share (%), by Distribution Channel 2024 & 2032
- Figure 8: North America Snack Bars Market in US Revenue (Million), by Country 2024 & 2032
- Figure 9: North America Snack Bars Market in US Revenue Share (%), by Country 2024 & 2032
- Figure 10: South America Snack Bars Market in US Revenue (Million), by Confectionery Variant 2024 & 2032
- Figure 11: South America Snack Bars Market in US Revenue Share (%), by Confectionery Variant 2024 & 2032
- Figure 12: South America Snack Bars Market in US Revenue (Million), by Distribution Channel 2024 & 2032
- Figure 13: South America Snack Bars Market in US Revenue Share (%), by Distribution Channel 2024 & 2032
- Figure 14: South America Snack Bars Market in US Revenue (Million), by Country 2024 & 2032
- Figure 15: South America Snack Bars Market in US Revenue Share (%), by Country 2024 & 2032
- Figure 16: Europe Snack Bars Market in US Revenue (Million), by Confectionery Variant 2024 & 2032
- Figure 17: Europe Snack Bars Market in US Revenue Share (%), by Confectionery Variant 2024 & 2032
- Figure 18: Europe Snack Bars Market in US Revenue (Million), by Distribution Channel 2024 & 2032
- Figure 19: Europe Snack Bars Market in US Revenue Share (%), by Distribution Channel 2024 & 2032
- Figure 20: Europe Snack Bars Market in US Revenue (Million), by Country 2024 & 2032
- Figure 21: Europe Snack Bars Market in US Revenue Share (%), by Country 2024 & 2032
- Figure 22: Middle East & Africa Snack Bars Market in US Revenue (Million), by Confectionery Variant 2024 & 2032
- Figure 23: Middle East & Africa Snack Bars Market in US Revenue Share (%), by Confectionery Variant 2024 & 2032
- Figure 24: Middle East & Africa Snack Bars Market in US Revenue (Million), by Distribution Channel 2024 & 2032
- Figure 25: Middle East & Africa Snack Bars Market in US Revenue Share (%), by Distribution Channel 2024 & 2032
- Figure 26: Middle East & Africa Snack Bars Market in US Revenue (Million), by Country 2024 & 2032
- Figure 27: Middle East & Africa Snack Bars Market in US Revenue Share (%), by Country 2024 & 2032
- Figure 28: Asia Pacific Snack Bars Market in US Revenue (Million), by Confectionery Variant 2024 & 2032
- Figure 29: Asia Pacific Snack Bars Market in US Revenue Share (%), by Confectionery Variant 2024 & 2032
- Figure 30: Asia Pacific Snack Bars Market in US Revenue (Million), by Distribution Channel 2024 & 2032
- Figure 31: Asia Pacific Snack Bars Market in US Revenue Share (%), by Distribution Channel 2024 & 2032
- Figure 32: Asia Pacific Snack Bars Market in US Revenue (Million), by Country 2024 & 2032
- Figure 33: Asia Pacific Snack Bars Market in US Revenue Share (%), by Country 2024 & 2032
List of Tables
- Table 1: Global Snack Bars Market in US Revenue Million Forecast, by Region 2019 & 2032
- Table 2: Global Snack Bars Market in US Revenue Million Forecast, by Confectionery Variant 2019 & 2032
- Table 3: Global Snack Bars Market in US Revenue Million Forecast, by Distribution Channel 2019 & 2032
- Table 4: Global Snack Bars Market in US Revenue Million Forecast, by Region 2019 & 2032
- Table 5: Global Snack Bars Market in US Revenue Million Forecast, by Country 2019 & 2032
- Table 6: United States Snack Bars Market in US Revenue (Million) Forecast, by Application 2019 & 2032
- Table 7: Canada Snack Bars Market in US Revenue (Million) Forecast, by Application 2019 & 2032
- Table 8: Mexico Snack Bars Market in US Revenue (Million) Forecast, by Application 2019 & 2032
- Table 9: Global Snack Bars Market in US Revenue Million Forecast, by Confectionery Variant 2019 & 2032
- Table 10: Global Snack Bars Market in US Revenue Million Forecast, by Distribution Channel 2019 & 2032
- Table 11: Global Snack Bars Market in US Revenue Million Forecast, by Country 2019 & 2032
- Table 12: United States Snack Bars Market in US Revenue (Million) Forecast, by Application 2019 & 2032
- Table 13: Canada Snack Bars Market in US Revenue (Million) Forecast, by Application 2019 & 2032
- Table 14: Mexico Snack Bars Market in US Revenue (Million) Forecast, by Application 2019 & 2032
- Table 15: Global Snack Bars Market in US Revenue Million Forecast, by Confectionery Variant 2019 & 2032
- Table 16: Global Snack Bars Market in US Revenue Million Forecast, by Distribution Channel 2019 & 2032
- Table 17: Global Snack Bars Market in US Revenue Million Forecast, by Country 2019 & 2032
- Table 18: Brazil Snack Bars Market in US Revenue (Million) Forecast, by Application 2019 & 2032
- Table 19: Argentina Snack Bars Market in US Revenue (Million) Forecast, by Application 2019 & 2032
- Table 20: Rest of South America Snack Bars Market in US Revenue (Million) Forecast, by Application 2019 & 2032
- Table 21: Global Snack Bars Market in US Revenue Million Forecast, by Confectionery Variant 2019 & 2032
- Table 22: Global Snack Bars Market in US Revenue Million Forecast, by Distribution Channel 2019 & 2032
- Table 23: Global Snack Bars Market in US Revenue Million Forecast, by Country 2019 & 2032
- Table 24: United Kingdom Snack Bars Market in US Revenue (Million) Forecast, by Application 2019 & 2032
- Table 25: Germany Snack Bars Market in US Revenue (Million) Forecast, by Application 2019 & 2032
- Table 26: France Snack Bars Market in US Revenue (Million) Forecast, by Application 2019 & 2032
- Table 27: Italy Snack Bars Market in US Revenue (Million) Forecast, by Application 2019 & 2032
- Table 28: Spain Snack Bars Market in US Revenue (Million) Forecast, by Application 2019 & 2032
- Table 29: Russia Snack Bars Market in US Revenue (Million) Forecast, by Application 2019 & 2032
- Table 30: Benelux Snack Bars Market in US Revenue (Million) Forecast, by Application 2019 & 2032
- Table 31: Nordics Snack Bars Market in US Revenue (Million) Forecast, by Application 2019 & 2032
- Table 32: Rest of Europe Snack Bars Market in US Revenue (Million) Forecast, by Application 2019 & 2032
- Table 33: Global Snack Bars Market in US Revenue Million Forecast, by Confectionery Variant 2019 & 2032
- Table 34: Global Snack Bars Market in US Revenue Million Forecast, by Distribution Channel 2019 & 2032
- Table 35: Global Snack Bars Market in US Revenue Million Forecast, by Country 2019 & 2032
- Table 36: Turkey Snack Bars Market in US Revenue (Million) Forecast, by Application 2019 & 2032
- Table 37: Israel Snack Bars Market in US Revenue (Million) Forecast, by Application 2019 & 2032
- Table 38: GCC Snack Bars Market in US Revenue (Million) Forecast, by Application 2019 & 2032
- Table 39: North Africa Snack Bars Market in US Revenue (Million) Forecast, by Application 2019 & 2032
- Table 40: South Africa Snack Bars Market in US Revenue (Million) Forecast, by Application 2019 & 2032
- Table 41: Rest of Middle East & Africa Snack Bars Market in US Revenue (Million) Forecast, by Application 2019 & 2032
- Table 42: Global Snack Bars Market in US Revenue Million Forecast, by Confectionery Variant 2019 & 2032
- Table 43: Global Snack Bars Market in US Revenue Million Forecast, by Distribution Channel 2019 & 2032
- Table 44: Global Snack Bars Market in US Revenue Million Forecast, by Country 2019 & 2032
- Table 45: China Snack Bars Market in US Revenue (Million) Forecast, by Application 2019 & 2032
- Table 46: India Snack Bars Market in US Revenue (Million) Forecast, by Application 2019 & 2032
- Table 47: Japan Snack Bars Market in US Revenue (Million) Forecast, by Application 2019 & 2032
- Table 48: South Korea Snack Bars Market in US Revenue (Million) Forecast, by Application 2019 & 2032
- Table 49: ASEAN Snack Bars Market in US Revenue (Million) Forecast, by Application 2019 & 2032
- Table 50: Oceania Snack Bars Market in US Revenue (Million) Forecast, by Application 2019 & 2032
- Table 51: Rest of Asia Pacific Snack Bars Market in US Revenue (Million) Forecast, by Application 2019 & 2032
Frequently Asked Questions
1. What is the projected Compound Annual Growth Rate (CAGR) of the Snack Bars Market in US?
The projected CAGR is approximately 26.40%.
2. Which companies are prominent players in the Snack Bars Market in US?
Key companies in the market include Caveman Foods LLC, Simply Good Foods Co, General Mills Inc, PepsiCo Inc, Abbott Laboratories, Probar Inc, Ferrero International SA, Power Crunch Pty Ltd, 1440 Foods Company, Mars Incorporated, The Hershey Compan, Go Macro LLC, Mondelēz International Inc, Kellogg Company.
3. What are the main segments of the Snack Bars Market in US?
The market segments include Confectionery Variant, Distribution Channel.
4. Can you provide details about the market size?
The market size is estimated to be USD XX Million as of 2022.
5. What are some drivers contributing to market growth?
Increasing Urbanization; Growing Disposable Income.
6. What are the notable trends driving market growth?
OTHER KEY INDUSTRY TRENDS COVERED IN THE REPORT.
7. Are there any restraints impacting market growth?
High-price and additional delivery charges.
8. Can you provide examples of recent developments in the market?
March 2023: General Mills brand Cascadian Farm launched granola bars that are made in a peanut-free facility. The bars are also USDA-certified organic and made with 35% less sugar compared to the original Annie’s Dipped Granola Bars.March 2023: General Mills has added two buildings to the site in Geneva: a one-story 65,600-square-foot asset and a 48,600-square-foot warehouse expansion. The Geneva factory will produce snack brands such as Fiber One, Nature Valley, and Fruit by the Foot, which will be sold across North America.March 2023: GoMacro® introduced the newest addition to its MacroBar® lineup, i.e., Cool Endeavor™. In addition to the full-size MacroBar, this Mint Chocolate Chip flavor is also available as a MacroBar® Mini.
9. What pricing options are available for accessing the report?
Pricing options include single-user, multi-user, and enterprise licenses priced at USD 3800, USD 4500, and USD 5800 respectively.
10. Is the market size provided in terms of value or volume?
The market size is provided in terms of value, measured in Million.
11. Are there any specific market keywords associated with the report?
Yes, the market keyword associated with the report is "Snack Bars Market in US," which aids in identifying and referencing the specific market segment covered.
12. How do I determine which pricing option suits my needs best?
The pricing options vary based on user requirements and access needs. Individual users may opt for single-user licenses, while businesses requiring broader access may choose multi-user or enterprise licenses for cost-effective access to the report.
13. Are there any additional resources or data provided in the Snack Bars Market in US report?
While the report offers comprehensive insights, it's advisable to review the specific contents or supplementary materials provided to ascertain if additional resources or data are available.
14. How can I stay updated on further developments or reports in the Snack Bars Market in US?
To stay informed about further developments, trends, and reports in the Snack Bars Market in US, consider subscribing to industry newsletters, following relevant companies and organizations, or regularly checking reputable industry news sources and publications.
Methodology
Step 1 - Identification of Relevant Samples Size from Population Database


Step 2 - Approaches for Defining Global Market Size (Value, Volume* & Price*)

Note*: In applicable scenarios
Step 3 - Data Sources
Primary Research
- Web Analytics
- Survey Reports
- Research Institute
- Latest Research Reports
- Opinion Leaders
Secondary Research
- Annual Reports
- White Paper
- Latest Press Release
- Industry Association
- Paid Database
- Investor Presentations

Step 4 - Data Triangulation
Involves using different sources of information in order to increase the validity of a study
These sources are likely to be stakeholders in a program - participants, other researchers, program staff, other community members, and so on.
Then we put all data in single framework & apply various statistical tools to find out the dynamic on the market.
During the analysis stage, feedback from the stakeholder groups would be compared to determine areas of agreement as well as areas of divergence
