

Key Insights
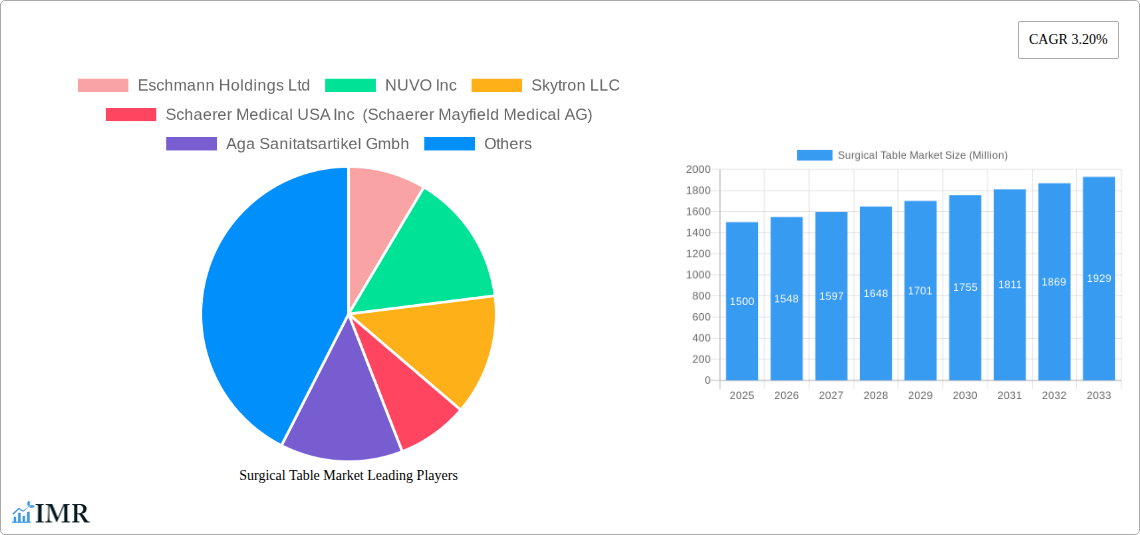
The global surgical table market, valued at approximately $1.5 billion in 2025, is projected to experience steady growth, driven by several key factors. The rising prevalence of surgical procedures globally, fueled by an aging population and increased incidence of chronic diseases, significantly contributes to market expansion. Technological advancements, such as the introduction of innovative materials like lightweight composites and electrically adjustable tables offering enhanced precision and patient comfort, are further stimulating demand. The increasing adoption of minimally invasive surgical techniques also positively impacts market growth, as these procedures necessitate specialized surgical tables. However, the market faces some constraints, including high initial investment costs associated with advanced surgical tables and stringent regulatory approvals. Growth is further segmented by surgical type (general vs. specialty), material (metal vs. composite), and end-user (hospitals, ambulatory surgical centers, and clinics). Hospitals currently dominate the market share, but ambulatory surgical centers are witnessing significant growth due to rising preference for outpatient procedures. The North American market holds a substantial share, driven by advanced healthcare infrastructure and high surgical procedure volume. However, Asia-Pacific is poised for rapid growth, owing to increasing healthcare expenditure and improving healthcare infrastructure in emerging economies.
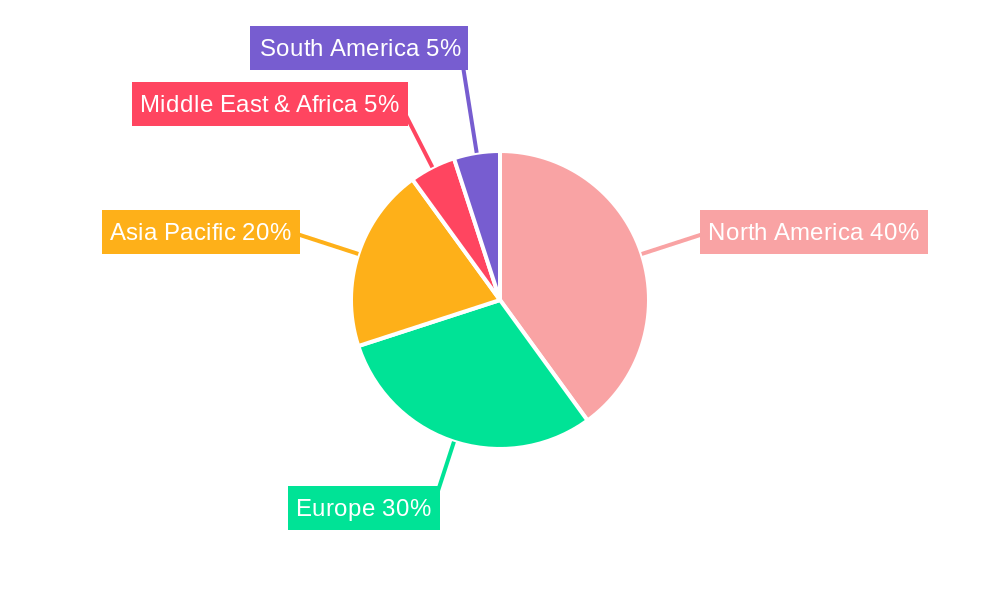
The market's 3.20% CAGR suggests a consistent upward trajectory through 2033. While the specifics of regional market share are unavailable, a logical projection based on current trends suggests North America retaining a significant portion (around 40%), followed by Europe (30%) and Asia-Pacific exhibiting the fastest growth, steadily increasing its share throughout the forecast period. The segments within the market—by material and surgical type—will likely maintain a relatively stable distribution, with metal tables remaining prevalent due to their durability and cost-effectiveness, although composite materials will see gradual market penetration driven by their benefits in weight and maneuverability. Key players in the surgical table market are actively engaged in strategic initiatives such as mergers and acquisitions, product innovation, and geographic expansion to maintain their competitive edge. The overall market outlook is positive, with significant growth opportunities across various regions and segments.
Surgical Table Market: A Comprehensive Market Report (2019-2033)
This comprehensive report provides an in-depth analysis of the global Surgical Table Market, encompassing market dynamics, growth trends, regional performance, product landscape, and key players. The study period covers 2019-2033, with 2025 as the base and estimated year. The report segments the market by Type of Surgery (General, Specialty), Material (Metal, Composite), and End-User (Hospitals, Ambulatory Surgical Centres, Clinics), providing granular insights into each segment's contribution to the overall market value, projected to reach xx Million units by 2033.
Surgical Table Market Dynamics & Structure
The Surgical Table market, valued at xx Million units in 2024, is characterized by a moderately consolidated structure with key players holding significant market share. Technological innovation, particularly in areas like robotic surgery integration and advanced materials, is a primary growth driver. Stringent regulatory frameworks governing medical devices influence market access and product development. The presence of substitute technologies, albeit limited, poses a competitive challenge. End-user demographics, with aging populations and rising healthcare expenditure, positively influence market demand. M&A activity remains moderate, with a total of xx deals recorded between 2019 and 2024, representing a xx% CAGR.
- Market Concentration: Moderately consolidated, with top 5 players holding approximately xx% market share.
- Technological Innovation: Focus on integration with robotic surgery systems, improved ergonomics, and advanced materials like lightweight composites.
- Regulatory Landscape: Stringent regulatory approvals (e.g., FDA, CE marking) impact market entry and product lifecycle.
- Competitive Substitutes: Limited substitutes exist, primarily involving customized solutions or adaptations of existing equipment.
- End-User Demographics: Growing geriatric population and increased healthcare spending in developing nations fuel market expansion.
- M&A Activity: xx deals between 2019-2024, indicating a moderate level of consolidation.
Surgical Table Market Growth Trends & Insights
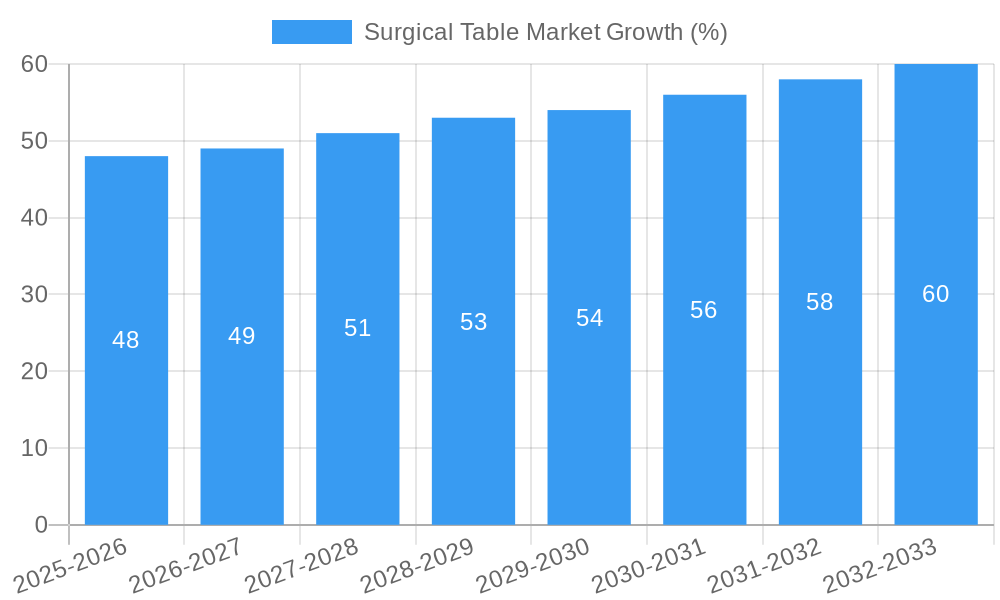
The Surgical Table market exhibits robust growth, driven by factors including technological advancements, expanding healthcare infrastructure, and increasing surgical procedures. The market witnessed a CAGR of xx% during the historical period (2019-2024), and this growth trajectory is projected to continue, albeit at a slightly moderated pace, during the forecast period (2025-2033). Market penetration in developing economies remains relatively low, presenting significant untapped potential. Consumer behavior is shifting towards technologically advanced, ergonomic, and cost-effective surgical tables. The adoption rate of advanced features like integrated imaging and patient monitoring systems is increasing steadily. The market size is expected to reach xx Million units by 2033, driven by a projected CAGR of xx%.
Dominant Regions, Countries, or Segments in Surgical Table Market
North America currently dominates the Surgical Table market, followed by Europe and Asia-Pacific. Within these regions, specific countries like the US, Germany, and Japan exhibit strong market growth. The "General Surgery" segment commands a larger market share compared to "Specialty Surgery," driven by higher volume surgical procedures. Similarly, "Metal" surgical tables hold a significant market share due to their robustness and established acceptance. However, the "Composite" material segment is expected to experience faster growth due to its lightweight and improved properties. Hospitals account for the largest end-user segment.
- Key Drivers in North America: High healthcare expenditure, advanced medical infrastructure, and a significant number of surgical procedures.
- Key Drivers in Europe: Aging population, increasing prevalence of chronic diseases requiring surgery, and well-established healthcare systems.
- Key Drivers in Asia-Pacific: Rapid economic growth, rising disposable incomes, and improvements in healthcare infrastructure.
- Segment Dominance: General Surgery > Specialty Surgery; Metal > Composite; Hospitals > Ambulatory Surgical Centers > Clinics.
Surgical Table Market Product Landscape
Surgical tables are evolving beyond basic functionality, incorporating features like integrated imaging systems, adjustable height and tilt, enhanced patient positioning capabilities, and improved infection control measures. These advancements contribute to improved surgical outcomes, reduced surgical time, and enhanced patient comfort. The market showcases diverse product offerings ranging from basic manual tables to highly sophisticated electrically powered, multi-functional units with advanced features. The unique selling propositions primarily center around ergonomics, improved patient safety, and integration with other surgical equipment.
Key Drivers, Barriers & Challenges in Surgical Table Market
Key Drivers: Technological advancements (robotic integration, advanced materials), increasing prevalence of chronic diseases, growing demand for minimally invasive surgeries, and expansion of healthcare infrastructure in developing nations.
Key Challenges: High initial investment costs, stringent regulatory approvals, intense competition among established players and rising raw material costs, which can impact profitability and market access. Supply chain disruptions can cause delays in manufacturing and delivery, impacting market availability.
Emerging Opportunities in Surgical Table Market
Untapped markets in developing economies present significant growth opportunities. The integration of advanced technologies like AI and IoT offers scope for innovative applications, including predictive maintenance and remote monitoring. Growing demand for minimally invasive surgeries necessitates the development of specialized surgical tables. Furthermore, increasing focus on patient safety and comfort opens opportunities for innovative features like advanced ergonomic designs.
Growth Accelerators in the Surgical Table Market Industry
Technological breakthroughs like the seamless integration of robotic surgery systems and advanced imaging capabilities are driving market growth. Strategic partnerships between manufacturers and healthcare providers enhance market penetration and product adoption. Expansion into underserved markets and diversification of product portfolios further contribute to market expansion.
Key Players Shaping the Surgical Table Market Market
- Eschmann Holdings Ltd
- NUVO Inc
- Skytron LLC
- Schaerer Medical USA Inc (Schaerer Mayfield Medical AG)
- Aga Sanitatsartikel Gmbh
- Trumpf Medical (Hill-Rom Holdings Inc)
- Getinge AB
- Staan Bio-Med Engineering Private Limited
- Stryker Corporation
- Alvo Medical
- Steris PLC
- Mizuho OSI (MIZUHO Corporation)
- Allengers Medical Systems Limited
- Merivaara Corp
Notable Milestones in Surgical Table Market Sector
- April 2022: Getinge partnered with the International Finance Corporation (IFC) to expand access to medical equipment in Africa, boosting market potential in developing regions.
- February 2022: ALVO Medical showcased its ALVO Rapsodia operating table at Arab Health, demonstrating technological advancements and market expansion efforts.
In-Depth Surgical Table Market Market Outlook
The Surgical Table market is poised for sustained growth, driven by ongoing technological advancements, increasing demand for minimally invasive procedures, and the expansion of healthcare infrastructure globally. Strategic partnerships, focused innovation, and penetration into untapped markets present lucrative opportunities for key players to further consolidate their market positions and drive future growth. The market's future trajectory suggests strong potential for continued expansion, exceeding xx Million units by 2033.
Surgical Table Market Segmentation
-
1. Type of Surgery
- 1.1. General
- 1.2. Specialty
-
2. Material
- 2.1. Metal
- 2.2. Composite
-
3. End User
- 3.1. Hospitals
- 3.2. Ambulatory Surgical Centres
- 3.3. Clinics
Surgical Table Market Segmentation By Geography
-
1. North America
- 1.1. United States
- 1.2. Canada
- 1.3. Mexico
-
2. Europe
- 2.1. Germany
- 2.2. United Kingdom
- 2.3. France
- 2.4. Italy
- 2.5. Spain
- 2.6. Rest of Europe
-
3. Asia Pacific
- 3.1. China
- 3.2. Japan
- 3.3. India
- 3.4. Australia
- 3.5. South Korea
- 3.6. Rest of Asia Pacific
-
4. Middle East and Africa
- 4.1. GCC
- 4.2. South Africa
- 4.3. Rest of Middle East and Africa
-
5. South America
- 5.1. Brazil
- 5.2. Argentina
- 5.3. Rest of South America
Surgical Table Market REPORT HIGHLIGHTS
| Aspects | Details |
|---|---|
| Study Period | 2019-2033 |
| Base Year | 2024 |
| Estimated Year | 2025 |
| Forecast Period | 2025-2033 |
| Historical Period | 2019-2024 |
| Growth Rate | CAGR of 3.20% from 2019-2033 |
| Segmentation |
|
Table of Contents
- 1. Introduction
- 1.1. Research Scope
- 1.2. Market Segmentation
- 1.3. Research Methodology
- 1.4. Definitions and Assumptions
- 2. Executive Summary
- 2.1. Introduction
- 3. Market Dynamics
- 3.1. Introduction
- 3.2. Market Drivers
- 3.2.1 Growing Number of Surgeries
- 3.2.2 Coupled with the Increasing Number of Ambulatory Surgical Centers; Technological Advancements in Operation Theatres
- 3.3. Market Restrains
- 3.3.1. High Cost of Composite Surgical Tables; Lack of Skilled Labor
- 3.4. Market Trends
- 3.4.1. General Surgical Table is Expected to Witness Strong Growth Over the Forecast Period
- 4. Market Factor Analysis
- 4.1. Porters Five Forces
- 4.2. Supply/Value Chain
- 4.3. PESTEL analysis
- 4.4. Market Entropy
- 4.5. Patent/Trademark Analysis
- 5. Global Surgical Table Market Analysis, Insights and Forecast, 2019-2031
- 5.1. Market Analysis, Insights and Forecast - by Type of Surgery
- 5.1.1. General
- 5.1.2. Specialty
- 5.2. Market Analysis, Insights and Forecast - by Material
- 5.2.1. Metal
- 5.2.2. Composite
- 5.3. Market Analysis, Insights and Forecast - by End User
- 5.3.1. Hospitals
- 5.3.2. Ambulatory Surgical Centres
- 5.3.3. Clinics
- 5.4. Market Analysis, Insights and Forecast - by Region
- 5.4.1. North America
- 5.4.2. Europe
- 5.4.3. Asia Pacific
- 5.4.4. Middle East and Africa
- 5.4.5. South America
- 5.1. Market Analysis, Insights and Forecast - by Type of Surgery
- 6. North America Surgical Table Market Analysis, Insights and Forecast, 2019-2031
- 6.1. Market Analysis, Insights and Forecast - by Type of Surgery
- 6.1.1. General
- 6.1.2. Specialty
- 6.2. Market Analysis, Insights and Forecast - by Material
- 6.2.1. Metal
- 6.2.2. Composite
- 6.3. Market Analysis, Insights and Forecast - by End User
- 6.3.1. Hospitals
- 6.3.2. Ambulatory Surgical Centres
- 6.3.3. Clinics
- 6.1. Market Analysis, Insights and Forecast - by Type of Surgery
- 7. Europe Surgical Table Market Analysis, Insights and Forecast, 2019-2031
- 7.1. Market Analysis, Insights and Forecast - by Type of Surgery
- 7.1.1. General
- 7.1.2. Specialty
- 7.2. Market Analysis, Insights and Forecast - by Material
- 7.2.1. Metal
- 7.2.2. Composite
- 7.3. Market Analysis, Insights and Forecast - by End User
- 7.3.1. Hospitals
- 7.3.2. Ambulatory Surgical Centres
- 7.3.3. Clinics
- 7.1. Market Analysis, Insights and Forecast - by Type of Surgery
- 8. Asia Pacific Surgical Table Market Analysis, Insights and Forecast, 2019-2031
- 8.1. Market Analysis, Insights and Forecast - by Type of Surgery
- 8.1.1. General
- 8.1.2. Specialty
- 8.2. Market Analysis, Insights and Forecast - by Material
- 8.2.1. Metal
- 8.2.2. Composite
- 8.3. Market Analysis, Insights and Forecast - by End User
- 8.3.1. Hospitals
- 8.3.2. Ambulatory Surgical Centres
- 8.3.3. Clinics
- 8.1. Market Analysis, Insights and Forecast - by Type of Surgery
- 9. Middle East and Africa Surgical Table Market Analysis, Insights and Forecast, 2019-2031
- 9.1. Market Analysis, Insights and Forecast - by Type of Surgery
- 9.1.1. General
- 9.1.2. Specialty
- 9.2. Market Analysis, Insights and Forecast - by Material
- 9.2.1. Metal
- 9.2.2. Composite
- 9.3. Market Analysis, Insights and Forecast - by End User
- 9.3.1. Hospitals
- 9.3.2. Ambulatory Surgical Centres
- 9.3.3. Clinics
- 9.1. Market Analysis, Insights and Forecast - by Type of Surgery
- 10. South America Surgical Table Market Analysis, Insights and Forecast, 2019-2031
- 10.1. Market Analysis, Insights and Forecast - by Type of Surgery
- 10.1.1. General
- 10.1.2. Specialty
- 10.2. Market Analysis, Insights and Forecast - by Material
- 10.2.1. Metal
- 10.2.2. Composite
- 10.3. Market Analysis, Insights and Forecast - by End User
- 10.3.1. Hospitals
- 10.3.2. Ambulatory Surgical Centres
- 10.3.3. Clinics
- 10.1. Market Analysis, Insights and Forecast - by Type of Surgery
- 11. North America Surgical Table Market Analysis, Insights and Forecast, 2019-2031
- 11.1. Market Analysis, Insights and Forecast - By Country/Sub-region
- 11.1.1 United States
- 11.1.2 Canada
- 11.1.3 Mexico
- 12. Europe Surgical Table Market Analysis, Insights and Forecast, 2019-2031
- 12.1. Market Analysis, Insights and Forecast - By Country/Sub-region
- 12.1.1 Germany
- 12.1.2 United Kingdom
- 12.1.3 France
- 12.1.4 Italy
- 12.1.5 Spain
- 12.1.6 Rest of Europe
- 13. Asia Pacific Surgical Table Market Analysis, Insights and Forecast, 2019-2031
- 13.1. Market Analysis, Insights and Forecast - By Country/Sub-region
- 13.1.1 China
- 13.1.2 Japan
- 13.1.3 India
- 13.1.4 Australia
- 13.1.5 South Korea
- 13.1.6 Rest of Asia Pacific
- 14. Middle East and Africa Surgical Table Market Analysis, Insights and Forecast, 2019-2031
- 14.1. Market Analysis, Insights and Forecast - By Country/Sub-region
- 14.1.1 GCC
- 14.1.2 South Africa
- 14.1.3 Rest of Middle East and Africa
- 15. South America Surgical Table Market Analysis, Insights and Forecast, 2019-2031
- 15.1. Market Analysis, Insights and Forecast - By Country/Sub-region
- 15.1.1 Brazil
- 15.1.2 Argentina
- 15.1.3 Rest of South America
- 16. Competitive Analysis
- 16.1. Global Market Share Analysis 2024
- 16.2. Company Profiles
- 16.2.1 Eschmann Holdings Ltd
- 16.2.1.1. Overview
- 16.2.1.2. Products
- 16.2.1.3. SWOT Analysis
- 16.2.1.4. Recent Developments
- 16.2.1.5. Financials (Based on Availability)
- 16.2.2 NUVO Inc
- 16.2.2.1. Overview
- 16.2.2.2. Products
- 16.2.2.3. SWOT Analysis
- 16.2.2.4. Recent Developments
- 16.2.2.5. Financials (Based on Availability)
- 16.2.3 Skytron LLC
- 16.2.3.1. Overview
- 16.2.3.2. Products
- 16.2.3.3. SWOT Analysis
- 16.2.3.4. Recent Developments
- 16.2.3.5. Financials (Based on Availability)
- 16.2.4 Schaerer Medical USA Inc (Schaerer Mayfield Medical AG)
- 16.2.4.1. Overview
- 16.2.4.2. Products
- 16.2.4.3. SWOT Analysis
- 16.2.4.4. Recent Developments
- 16.2.4.5. Financials (Based on Availability)
- 16.2.5 Aga Sanitatsartikel Gmbh
- 16.2.5.1. Overview
- 16.2.5.2. Products
- 16.2.5.3. SWOT Analysis
- 16.2.5.4. Recent Developments
- 16.2.5.5. Financials (Based on Availability)
- 16.2.6 Trumpf Medical (Hill-Rom Holdings Inc )
- 16.2.6.1. Overview
- 16.2.6.2. Products
- 16.2.6.3. SWOT Analysis
- 16.2.6.4. Recent Developments
- 16.2.6.5. Financials (Based on Availability)
- 16.2.7 Getinge AB
- 16.2.7.1. Overview
- 16.2.7.2. Products
- 16.2.7.3. SWOT Analysis
- 16.2.7.4. Recent Developments
- 16.2.7.5. Financials (Based on Availability)
- 16.2.8 Staan Bio-Med Engineering Private Limited
- 16.2.8.1. Overview
- 16.2.8.2. Products
- 16.2.8.3. SWOT Analysis
- 16.2.8.4. Recent Developments
- 16.2.8.5. Financials (Based on Availability)
- 16.2.9 Stryker Corporation
- 16.2.9.1. Overview
- 16.2.9.2. Products
- 16.2.9.3. SWOT Analysis
- 16.2.9.4. Recent Developments
- 16.2.9.5. Financials (Based on Availability)
- 16.2.10 Alvo Medical
- 16.2.10.1. Overview
- 16.2.10.2. Products
- 16.2.10.3. SWOT Analysis
- 16.2.10.4. Recent Developments
- 16.2.10.5. Financials (Based on Availability)
- 16.2.11 Steris PLC
- 16.2.11.1. Overview
- 16.2.11.2. Products
- 16.2.11.3. SWOT Analysis
- 16.2.11.4. Recent Developments
- 16.2.11.5. Financials (Based on Availability)
- 16.2.12 Mizuho OSI (MIZUHO Corporation)
- 16.2.12.1. Overview
- 16.2.12.2. Products
- 16.2.12.3. SWOT Analysis
- 16.2.12.4. Recent Developments
- 16.2.12.5. Financials (Based on Availability)
- 16.2.13 Allengers Medical Systems Limited
- 16.2.13.1. Overview
- 16.2.13.2. Products
- 16.2.13.3. SWOT Analysis
- 16.2.13.4. Recent Developments
- 16.2.13.5. Financials (Based on Availability)
- 16.2.14 Merivaara Corp
- 16.2.14.1. Overview
- 16.2.14.2. Products
- 16.2.14.3. SWOT Analysis
- 16.2.14.4. Recent Developments
- 16.2.14.5. Financials (Based on Availability)
- 16.2.1 Eschmann Holdings Ltd
List of Figures
- Figure 1: Global Surgical Table Market Revenue Breakdown (Million, %) by Region 2024 & 2032
- Figure 2: Global Surgical Table Market Volume Breakdown (K Unit, %) by Region 2024 & 2032
- Figure 3: North America Surgical Table Market Revenue (Million), by Country 2024 & 2032
- Figure 4: North America Surgical Table Market Volume (K Unit), by Country 2024 & 2032
- Figure 5: North America Surgical Table Market Revenue Share (%), by Country 2024 & 2032
- Figure 6: North America Surgical Table Market Volume Share (%), by Country 2024 & 2032
- Figure 7: Europe Surgical Table Market Revenue (Million), by Country 2024 & 2032
- Figure 8: Europe Surgical Table Market Volume (K Unit), by Country 2024 & 2032
- Figure 9: Europe Surgical Table Market Revenue Share (%), by Country 2024 & 2032
- Figure 10: Europe Surgical Table Market Volume Share (%), by Country 2024 & 2032
- Figure 11: Asia Pacific Surgical Table Market Revenue (Million), by Country 2024 & 2032
- Figure 12: Asia Pacific Surgical Table Market Volume (K Unit), by Country 2024 & 2032
- Figure 13: Asia Pacific Surgical Table Market Revenue Share (%), by Country 2024 & 2032
- Figure 14: Asia Pacific Surgical Table Market Volume Share (%), by Country 2024 & 2032
- Figure 15: Middle East and Africa Surgical Table Market Revenue (Million), by Country 2024 & 2032
- Figure 16: Middle East and Africa Surgical Table Market Volume (K Unit), by Country 2024 & 2032
- Figure 17: Middle East and Africa Surgical Table Market Revenue Share (%), by Country 2024 & 2032
- Figure 18: Middle East and Africa Surgical Table Market Volume Share (%), by Country 2024 & 2032
- Figure 19: South America Surgical Table Market Revenue (Million), by Country 2024 & 2032
- Figure 20: South America Surgical Table Market Volume (K Unit), by Country 2024 & 2032
- Figure 21: South America Surgical Table Market Revenue Share (%), by Country 2024 & 2032
- Figure 22: South America Surgical Table Market Volume Share (%), by Country 2024 & 2032
- Figure 23: North America Surgical Table Market Revenue (Million), by Type of Surgery 2024 & 2032
- Figure 24: North America Surgical Table Market Volume (K Unit), by Type of Surgery 2024 & 2032
- Figure 25: North America Surgical Table Market Revenue Share (%), by Type of Surgery 2024 & 2032
- Figure 26: North America Surgical Table Market Volume Share (%), by Type of Surgery 2024 & 2032
- Figure 27: North America Surgical Table Market Revenue (Million), by Material 2024 & 2032
- Figure 28: North America Surgical Table Market Volume (K Unit), by Material 2024 & 2032
- Figure 29: North America Surgical Table Market Revenue Share (%), by Material 2024 & 2032
- Figure 30: North America Surgical Table Market Volume Share (%), by Material 2024 & 2032
- Figure 31: North America Surgical Table Market Revenue (Million), by End User 2024 & 2032
- Figure 32: North America Surgical Table Market Volume (K Unit), by End User 2024 & 2032
- Figure 33: North America Surgical Table Market Revenue Share (%), by End User 2024 & 2032
- Figure 34: North America Surgical Table Market Volume Share (%), by End User 2024 & 2032
- Figure 35: North America Surgical Table Market Revenue (Million), by Country 2024 & 2032
- Figure 36: North America Surgical Table Market Volume (K Unit), by Country 2024 & 2032
- Figure 37: North America Surgical Table Market Revenue Share (%), by Country 2024 & 2032
- Figure 38: North America Surgical Table Market Volume Share (%), by Country 2024 & 2032
- Figure 39: Europe Surgical Table Market Revenue (Million), by Type of Surgery 2024 & 2032
- Figure 40: Europe Surgical Table Market Volume (K Unit), by Type of Surgery 2024 & 2032
- Figure 41: Europe Surgical Table Market Revenue Share (%), by Type of Surgery 2024 & 2032
- Figure 42: Europe Surgical Table Market Volume Share (%), by Type of Surgery 2024 & 2032
- Figure 43: Europe Surgical Table Market Revenue (Million), by Material 2024 & 2032
- Figure 44: Europe Surgical Table Market Volume (K Unit), by Material 2024 & 2032
- Figure 45: Europe Surgical Table Market Revenue Share (%), by Material 2024 & 2032
- Figure 46: Europe Surgical Table Market Volume Share (%), by Material 2024 & 2032
- Figure 47: Europe Surgical Table Market Revenue (Million), by End User 2024 & 2032
- Figure 48: Europe Surgical Table Market Volume (K Unit), by End User 2024 & 2032
- Figure 49: Europe Surgical Table Market Revenue Share (%), by End User 2024 & 2032
- Figure 50: Europe Surgical Table Market Volume Share (%), by End User 2024 & 2032
- Figure 51: Europe Surgical Table Market Revenue (Million), by Country 2024 & 2032
- Figure 52: Europe Surgical Table Market Volume (K Unit), by Country 2024 & 2032
- Figure 53: Europe Surgical Table Market Revenue Share (%), by Country 2024 & 2032
- Figure 54: Europe Surgical Table Market Volume Share (%), by Country 2024 & 2032
- Figure 55: Asia Pacific Surgical Table Market Revenue (Million), by Type of Surgery 2024 & 2032
- Figure 56: Asia Pacific Surgical Table Market Volume (K Unit), by Type of Surgery 2024 & 2032
- Figure 57: Asia Pacific Surgical Table Market Revenue Share (%), by Type of Surgery 2024 & 2032
- Figure 58: Asia Pacific Surgical Table Market Volume Share (%), by Type of Surgery 2024 & 2032
- Figure 59: Asia Pacific Surgical Table Market Revenue (Million), by Material 2024 & 2032
- Figure 60: Asia Pacific Surgical Table Market Volume (K Unit), by Material 2024 & 2032
- Figure 61: Asia Pacific Surgical Table Market Revenue Share (%), by Material 2024 & 2032
- Figure 62: Asia Pacific Surgical Table Market Volume Share (%), by Material 2024 & 2032
- Figure 63: Asia Pacific Surgical Table Market Revenue (Million), by End User 2024 & 2032
- Figure 64: Asia Pacific Surgical Table Market Volume (K Unit), by End User 2024 & 2032
- Figure 65: Asia Pacific Surgical Table Market Revenue Share (%), by End User 2024 & 2032
- Figure 66: Asia Pacific Surgical Table Market Volume Share (%), by End User 2024 & 2032
- Figure 67: Asia Pacific Surgical Table Market Revenue (Million), by Country 2024 & 2032
- Figure 68: Asia Pacific Surgical Table Market Volume (K Unit), by Country 2024 & 2032
- Figure 69: Asia Pacific Surgical Table Market Revenue Share (%), by Country 2024 & 2032
- Figure 70: Asia Pacific Surgical Table Market Volume Share (%), by Country 2024 & 2032
- Figure 71: Middle East and Africa Surgical Table Market Revenue (Million), by Type of Surgery 2024 & 2032
- Figure 72: Middle East and Africa Surgical Table Market Volume (K Unit), by Type of Surgery 2024 & 2032
- Figure 73: Middle East and Africa Surgical Table Market Revenue Share (%), by Type of Surgery 2024 & 2032
- Figure 74: Middle East and Africa Surgical Table Market Volume Share (%), by Type of Surgery 2024 & 2032
- Figure 75: Middle East and Africa Surgical Table Market Revenue (Million), by Material 2024 & 2032
- Figure 76: Middle East and Africa Surgical Table Market Volume (K Unit), by Material 2024 & 2032
- Figure 77: Middle East and Africa Surgical Table Market Revenue Share (%), by Material 2024 & 2032
- Figure 78: Middle East and Africa Surgical Table Market Volume Share (%), by Material 2024 & 2032
- Figure 79: Middle East and Africa Surgical Table Market Revenue (Million), by End User 2024 & 2032
- Figure 80: Middle East and Africa Surgical Table Market Volume (K Unit), by End User 2024 & 2032
- Figure 81: Middle East and Africa Surgical Table Market Revenue Share (%), by End User 2024 & 2032
- Figure 82: Middle East and Africa Surgical Table Market Volume Share (%), by End User 2024 & 2032
- Figure 83: Middle East and Africa Surgical Table Market Revenue (Million), by Country 2024 & 2032
- Figure 84: Middle East and Africa Surgical Table Market Volume (K Unit), by Country 2024 & 2032
- Figure 85: Middle East and Africa Surgical Table Market Revenue Share (%), by Country 2024 & 2032
- Figure 86: Middle East and Africa Surgical Table Market Volume Share (%), by Country 2024 & 2032
- Figure 87: South America Surgical Table Market Revenue (Million), by Type of Surgery 2024 & 2032
- Figure 88: South America Surgical Table Market Volume (K Unit), by Type of Surgery 2024 & 2032
- Figure 89: South America Surgical Table Market Revenue Share (%), by Type of Surgery 2024 & 2032
- Figure 90: South America Surgical Table Market Volume Share (%), by Type of Surgery 2024 & 2032
- Figure 91: South America Surgical Table Market Revenue (Million), by Material 2024 & 2032
- Figure 92: South America Surgical Table Market Volume (K Unit), by Material 2024 & 2032
- Figure 93: South America Surgical Table Market Revenue Share (%), by Material 2024 & 2032
- Figure 94: South America Surgical Table Market Volume Share (%), by Material 2024 & 2032
- Figure 95: South America Surgical Table Market Revenue (Million), by End User 2024 & 2032
- Figure 96: South America Surgical Table Market Volume (K Unit), by End User 2024 & 2032
- Figure 97: South America Surgical Table Market Revenue Share (%), by End User 2024 & 2032
- Figure 98: South America Surgical Table Market Volume Share (%), by End User 2024 & 2032
- Figure 99: South America Surgical Table Market Revenue (Million), by Country 2024 & 2032
- Figure 100: South America Surgical Table Market Volume (K Unit), by Country 2024 & 2032
- Figure 101: South America Surgical Table Market Revenue Share (%), by Country 2024 & 2032
- Figure 102: South America Surgical Table Market Volume Share (%), by Country 2024 & 2032
List of Tables
- Table 1: Global Surgical Table Market Revenue Million Forecast, by Region 2019 & 2032
- Table 2: Global Surgical Table Market Volume K Unit Forecast, by Region 2019 & 2032
- Table 3: Global Surgical Table Market Revenue Million Forecast, by Type of Surgery 2019 & 2032
- Table 4: Global Surgical Table Market Volume K Unit Forecast, by Type of Surgery 2019 & 2032
- Table 5: Global Surgical Table Market Revenue Million Forecast, by Material 2019 & 2032
- Table 6: Global Surgical Table Market Volume K Unit Forecast, by Material 2019 & 2032
- Table 7: Global Surgical Table Market Revenue Million Forecast, by End User 2019 & 2032
- Table 8: Global Surgical Table Market Volume K Unit Forecast, by End User 2019 & 2032
- Table 9: Global Surgical Table Market Revenue Million Forecast, by Region 2019 & 2032
- Table 10: Global Surgical Table Market Volume K Unit Forecast, by Region 2019 & 2032
- Table 11: Global Surgical Table Market Revenue Million Forecast, by Country 2019 & 2032
- Table 12: Global Surgical Table Market Volume K Unit Forecast, by Country 2019 & 2032
- Table 13: United States Surgical Table Market Revenue (Million) Forecast, by Application 2019 & 2032
- Table 14: United States Surgical Table Market Volume (K Unit) Forecast, by Application 2019 & 2032
- Table 15: Canada Surgical Table Market Revenue (Million) Forecast, by Application 2019 & 2032
- Table 16: Canada Surgical Table Market Volume (K Unit) Forecast, by Application 2019 & 2032
- Table 17: Mexico Surgical Table Market Revenue (Million) Forecast, by Application 2019 & 2032
- Table 18: Mexico Surgical Table Market Volume (K Unit) Forecast, by Application 2019 & 2032
- Table 19: Global Surgical Table Market Revenue Million Forecast, by Country 2019 & 2032
- Table 20: Global Surgical Table Market Volume K Unit Forecast, by Country 2019 & 2032
- Table 21: Germany Surgical Table Market Revenue (Million) Forecast, by Application 2019 & 2032
- Table 22: Germany Surgical Table Market Volume (K Unit) Forecast, by Application 2019 & 2032
- Table 23: United Kingdom Surgical Table Market Revenue (Million) Forecast, by Application 2019 & 2032
- Table 24: United Kingdom Surgical Table Market Volume (K Unit) Forecast, by Application 2019 & 2032
- Table 25: France Surgical Table Market Revenue (Million) Forecast, by Application 2019 & 2032
- Table 26: France Surgical Table Market Volume (K Unit) Forecast, by Application 2019 & 2032
- Table 27: Italy Surgical Table Market Revenue (Million) Forecast, by Application 2019 & 2032
- Table 28: Italy Surgical Table Market Volume (K Unit) Forecast, by Application 2019 & 2032
- Table 29: Spain Surgical Table Market Revenue (Million) Forecast, by Application 2019 & 2032
- Table 30: Spain Surgical Table Market Volume (K Unit) Forecast, by Application 2019 & 2032
- Table 31: Rest of Europe Surgical Table Market Revenue (Million) Forecast, by Application 2019 & 2032
- Table 32: Rest of Europe Surgical Table Market Volume (K Unit) Forecast, by Application 2019 & 2032
- Table 33: Global Surgical Table Market Revenue Million Forecast, by Country 2019 & 2032
- Table 34: Global Surgical Table Market Volume K Unit Forecast, by Country 2019 & 2032
- Table 35: China Surgical Table Market Revenue (Million) Forecast, by Application 2019 & 2032
- Table 36: China Surgical Table Market Volume (K Unit) Forecast, by Application 2019 & 2032
- Table 37: Japan Surgical Table Market Revenue (Million) Forecast, by Application 2019 & 2032
- Table 38: Japan Surgical Table Market Volume (K Unit) Forecast, by Application 2019 & 2032
- Table 39: India Surgical Table Market Revenue (Million) Forecast, by Application 2019 & 2032
- Table 40: India Surgical Table Market Volume (K Unit) Forecast, by Application 2019 & 2032
- Table 41: Australia Surgical Table Market Revenue (Million) Forecast, by Application 2019 & 2032
- Table 42: Australia Surgical Table Market Volume (K Unit) Forecast, by Application 2019 & 2032
- Table 43: South Korea Surgical Table Market Revenue (Million) Forecast, by Application 2019 & 2032
- Table 44: South Korea Surgical Table Market Volume (K Unit) Forecast, by Application 2019 & 2032
- Table 45: Rest of Asia Pacific Surgical Table Market Revenue (Million) Forecast, by Application 2019 & 2032
- Table 46: Rest of Asia Pacific Surgical Table Market Volume (K Unit) Forecast, by Application 2019 & 2032
- Table 47: Global Surgical Table Market Revenue Million Forecast, by Country 2019 & 2032
- Table 48: Global Surgical Table Market Volume K Unit Forecast, by Country 2019 & 2032
- Table 49: GCC Surgical Table Market Revenue (Million) Forecast, by Application 2019 & 2032
- Table 50: GCC Surgical Table Market Volume (K Unit) Forecast, by Application 2019 & 2032
- Table 51: South Africa Surgical Table Market Revenue (Million) Forecast, by Application 2019 & 2032
- Table 52: South Africa Surgical Table Market Volume (K Unit) Forecast, by Application 2019 & 2032
- Table 53: Rest of Middle East and Africa Surgical Table Market Revenue (Million) Forecast, by Application 2019 & 2032
- Table 54: Rest of Middle East and Africa Surgical Table Market Volume (K Unit) Forecast, by Application 2019 & 2032
- Table 55: Global Surgical Table Market Revenue Million Forecast, by Country 2019 & 2032
- Table 56: Global Surgical Table Market Volume K Unit Forecast, by Country 2019 & 2032
- Table 57: Brazil Surgical Table Market Revenue (Million) Forecast, by Application 2019 & 2032
- Table 58: Brazil Surgical Table Market Volume (K Unit) Forecast, by Application 2019 & 2032
- Table 59: Argentina Surgical Table Market Revenue (Million) Forecast, by Application 2019 & 2032
- Table 60: Argentina Surgical Table Market Volume (K Unit) Forecast, by Application 2019 & 2032
- Table 61: Rest of South America Surgical Table Market Revenue (Million) Forecast, by Application 2019 & 2032
- Table 62: Rest of South America Surgical Table Market Volume (K Unit) Forecast, by Application 2019 & 2032
- Table 63: Global Surgical Table Market Revenue Million Forecast, by Type of Surgery 2019 & 2032
- Table 64: Global Surgical Table Market Volume K Unit Forecast, by Type of Surgery 2019 & 2032
- Table 65: Global Surgical Table Market Revenue Million Forecast, by Material 2019 & 2032
- Table 66: Global Surgical Table Market Volume K Unit Forecast, by Material 2019 & 2032
- Table 67: Global Surgical Table Market Revenue Million Forecast, by End User 2019 & 2032
- Table 68: Global Surgical Table Market Volume K Unit Forecast, by End User 2019 & 2032
- Table 69: Global Surgical Table Market Revenue Million Forecast, by Country 2019 & 2032
- Table 70: Global Surgical Table Market Volume K Unit Forecast, by Country 2019 & 2032
- Table 71: United States Surgical Table Market Revenue (Million) Forecast, by Application 2019 & 2032
- Table 72: United States Surgical Table Market Volume (K Unit) Forecast, by Application 2019 & 2032
- Table 73: Canada Surgical Table Market Revenue (Million) Forecast, by Application 2019 & 2032
- Table 74: Canada Surgical Table Market Volume (K Unit) Forecast, by Application 2019 & 2032
- Table 75: Mexico Surgical Table Market Revenue (Million) Forecast, by Application 2019 & 2032
- Table 76: Mexico Surgical Table Market Volume (K Unit) Forecast, by Application 2019 & 2032
- Table 77: Global Surgical Table Market Revenue Million Forecast, by Type of Surgery 2019 & 2032
- Table 78: Global Surgical Table Market Volume K Unit Forecast, by Type of Surgery 2019 & 2032
- Table 79: Global Surgical Table Market Revenue Million Forecast, by Material 2019 & 2032
- Table 80: Global Surgical Table Market Volume K Unit Forecast, by Material 2019 & 2032
- Table 81: Global Surgical Table Market Revenue Million Forecast, by End User 2019 & 2032
- Table 82: Global Surgical Table Market Volume K Unit Forecast, by End User 2019 & 2032
- Table 83: Global Surgical Table Market Revenue Million Forecast, by Country 2019 & 2032
- Table 84: Global Surgical Table Market Volume K Unit Forecast, by Country 2019 & 2032
- Table 85: Germany Surgical Table Market Revenue (Million) Forecast, by Application 2019 & 2032
- Table 86: Germany Surgical Table Market Volume (K Unit) Forecast, by Application 2019 & 2032
- Table 87: United Kingdom Surgical Table Market Revenue (Million) Forecast, by Application 2019 & 2032
- Table 88: United Kingdom Surgical Table Market Volume (K Unit) Forecast, by Application 2019 & 2032
- Table 89: France Surgical Table Market Revenue (Million) Forecast, by Application 2019 & 2032
- Table 90: France Surgical Table Market Volume (K Unit) Forecast, by Application 2019 & 2032
- Table 91: Italy Surgical Table Market Revenue (Million) Forecast, by Application 2019 & 2032
- Table 92: Italy Surgical Table Market Volume (K Unit) Forecast, by Application 2019 & 2032
- Table 93: Spain Surgical Table Market Revenue (Million) Forecast, by Application 2019 & 2032
- Table 94: Spain Surgical Table Market Volume (K Unit) Forecast, by Application 2019 & 2032
- Table 95: Rest of Europe Surgical Table Market Revenue (Million) Forecast, by Application 2019 & 2032
- Table 96: Rest of Europe Surgical Table Market Volume (K Unit) Forecast, by Application 2019 & 2032
- Table 97: Global Surgical Table Market Revenue Million Forecast, by Type of Surgery 2019 & 2032
- Table 98: Global Surgical Table Market Volume K Unit Forecast, by Type of Surgery 2019 & 2032
- Table 99: Global Surgical Table Market Revenue Million Forecast, by Material 2019 & 2032
- Table 100: Global Surgical Table Market Volume K Unit Forecast, by Material 2019 & 2032
- Table 101: Global Surgical Table Market Revenue Million Forecast, by End User 2019 & 2032
- Table 102: Global Surgical Table Market Volume K Unit Forecast, by End User 2019 & 2032
- Table 103: Global Surgical Table Market Revenue Million Forecast, by Country 2019 & 2032
- Table 104: Global Surgical Table Market Volume K Unit Forecast, by Country 2019 & 2032
- Table 105: China Surgical Table Market Revenue (Million) Forecast, by Application 2019 & 2032
- Table 106: China Surgical Table Market Volume (K Unit) Forecast, by Application 2019 & 2032
- Table 107: Japan Surgical Table Market Revenue (Million) Forecast, by Application 2019 & 2032
- Table 108: Japan Surgical Table Market Volume (K Unit) Forecast, by Application 2019 & 2032
- Table 109: India Surgical Table Market Revenue (Million) Forecast, by Application 2019 & 2032
- Table 110: India Surgical Table Market Volume (K Unit) Forecast, by Application 2019 & 2032
- Table 111: Australia Surgical Table Market Revenue (Million) Forecast, by Application 2019 & 2032
- Table 112: Australia Surgical Table Market Volume (K Unit) Forecast, by Application 2019 & 2032
- Table 113: South Korea Surgical Table Market Revenue (Million) Forecast, by Application 2019 & 2032
- Table 114: South Korea Surgical Table Market Volume (K Unit) Forecast, by Application 2019 & 2032
- Table 115: Rest of Asia Pacific Surgical Table Market Revenue (Million) Forecast, by Application 2019 & 2032
- Table 116: Rest of Asia Pacific Surgical Table Market Volume (K Unit) Forecast, by Application 2019 & 2032
- Table 117: Global Surgical Table Market Revenue Million Forecast, by Type of Surgery 2019 & 2032
- Table 118: Global Surgical Table Market Volume K Unit Forecast, by Type of Surgery 2019 & 2032
- Table 119: Global Surgical Table Market Revenue Million Forecast, by Material 2019 & 2032
- Table 120: Global Surgical Table Market Volume K Unit Forecast, by Material 2019 & 2032
- Table 121: Global Surgical Table Market Revenue Million Forecast, by End User 2019 & 2032
- Table 122: Global Surgical Table Market Volume K Unit Forecast, by End User 2019 & 2032
- Table 123: Global Surgical Table Market Revenue Million Forecast, by Country 2019 & 2032
- Table 124: Global Surgical Table Market Volume K Unit Forecast, by Country 2019 & 2032
- Table 125: GCC Surgical Table Market Revenue (Million) Forecast, by Application 2019 & 2032
- Table 126: GCC Surgical Table Market Volume (K Unit) Forecast, by Application 2019 & 2032
- Table 127: South Africa Surgical Table Market Revenue (Million) Forecast, by Application 2019 & 2032
- Table 128: South Africa Surgical Table Market Volume (K Unit) Forecast, by Application 2019 & 2032
- Table 129: Rest of Middle East and Africa Surgical Table Market Revenue (Million) Forecast, by Application 2019 & 2032
- Table 130: Rest of Middle East and Africa Surgical Table Market Volume (K Unit) Forecast, by Application 2019 & 2032
- Table 131: Global Surgical Table Market Revenue Million Forecast, by Type of Surgery 2019 & 2032
- Table 132: Global Surgical Table Market Volume K Unit Forecast, by Type of Surgery 2019 & 2032
- Table 133: Global Surgical Table Market Revenue Million Forecast, by Material 2019 & 2032
- Table 134: Global Surgical Table Market Volume K Unit Forecast, by Material 2019 & 2032
- Table 135: Global Surgical Table Market Revenue Million Forecast, by End User 2019 & 2032
- Table 136: Global Surgical Table Market Volume K Unit Forecast, by End User 2019 & 2032
- Table 137: Global Surgical Table Market Revenue Million Forecast, by Country 2019 & 2032
- Table 138: Global Surgical Table Market Volume K Unit Forecast, by Country 2019 & 2032
- Table 139: Brazil Surgical Table Market Revenue (Million) Forecast, by Application 2019 & 2032
- Table 140: Brazil Surgical Table Market Volume (K Unit) Forecast, by Application 2019 & 2032
- Table 141: Argentina Surgical Table Market Revenue (Million) Forecast, by Application 2019 & 2032
- Table 142: Argentina Surgical Table Market Volume (K Unit) Forecast, by Application 2019 & 2032
- Table 143: Rest of South America Surgical Table Market Revenue (Million) Forecast, by Application 2019 & 2032
- Table 144: Rest of South America Surgical Table Market Volume (K Unit) Forecast, by Application 2019 & 2032
Frequently Asked Questions
1. What is the projected Compound Annual Growth Rate (CAGR) of the Surgical Table Market?
The projected CAGR is approximately 3.20%.
2. Which companies are prominent players in the Surgical Table Market?
Key companies in the market include Eschmann Holdings Ltd, NUVO Inc, Skytron LLC, Schaerer Medical USA Inc (Schaerer Mayfield Medical AG), Aga Sanitatsartikel Gmbh, Trumpf Medical (Hill-Rom Holdings Inc ), Getinge AB, Staan Bio-Med Engineering Private Limited, Stryker Corporation, Alvo Medical, Steris PLC, Mizuho OSI (MIZUHO Corporation), Allengers Medical Systems Limited, Merivaara Corp.
3. What are the main segments of the Surgical Table Market?
The market segments include Type of Surgery, Material, End User.
4. Can you provide details about the market size?
The market size is estimated to be USD XX Million as of 2022.
5. What are some drivers contributing to market growth?
Growing Number of Surgeries. Coupled with the Increasing Number of Ambulatory Surgical Centers; Technological Advancements in Operation Theatres.
6. What are the notable trends driving market growth?
General Surgical Table is Expected to Witness Strong Growth Over the Forecast Period.
7. Are there any restraints impacting market growth?
High Cost of Composite Surgical Tables; Lack of Skilled Labor.
8. Can you provide examples of recent developments in the market?
April 2022: Getinge partnered with the International Finance Corporation (IFC) to help increase access to medical equipment across Africa.
9. What pricing options are available for accessing the report?
Pricing options include single-user, multi-user, and enterprise licenses priced at USD 4750, USD 5250, and USD 8750 respectively.
10. Is the market size provided in terms of value or volume?
The market size is provided in terms of value, measured in Million and volume, measured in K Unit.
11. Are there any specific market keywords associated with the report?
Yes, the market keyword associated with the report is "Surgical Table Market," which aids in identifying and referencing the specific market segment covered.
12. How do I determine which pricing option suits my needs best?
The pricing options vary based on user requirements and access needs. Individual users may opt for single-user licenses, while businesses requiring broader access may choose multi-user or enterprise licenses for cost-effective access to the report.
13. Are there any additional resources or data provided in the Surgical Table Market report?
While the report offers comprehensive insights, it's advisable to review the specific contents or supplementary materials provided to ascertain if additional resources or data are available.
14. How can I stay updated on further developments or reports in the Surgical Table Market?
To stay informed about further developments, trends, and reports in the Surgical Table Market, consider subscribing to industry newsletters, following relevant companies and organizations, or regularly checking reputable industry news sources and publications.
Methodology
Step 1 - Identification of Relevant Samples Size from Population Database


Step 2 - Approaches for Defining Global Market Size (Value, Volume* & Price*)

Note*: In applicable scenarios
Step 3 - Data Sources
Primary Research
- Web Analytics
- Survey Reports
- Research Institute
- Latest Research Reports
- Opinion Leaders
Secondary Research
- Annual Reports
- White Paper
- Latest Press Release
- Industry Association
- Paid Database
- Investor Presentations

Step 4 - Data Triangulation
Involves using different sources of information in order to increase the validity of a study
These sources are likely to be stakeholders in a program - participants, other researchers, program staff, other community members, and so on.
Then we put all data in single framework & apply various statistical tools to find out the dynamic on the market.
During the analysis stage, feedback from the stakeholder groups would be compared to determine areas of agreement as well as areas of divergence
