

Key Insights
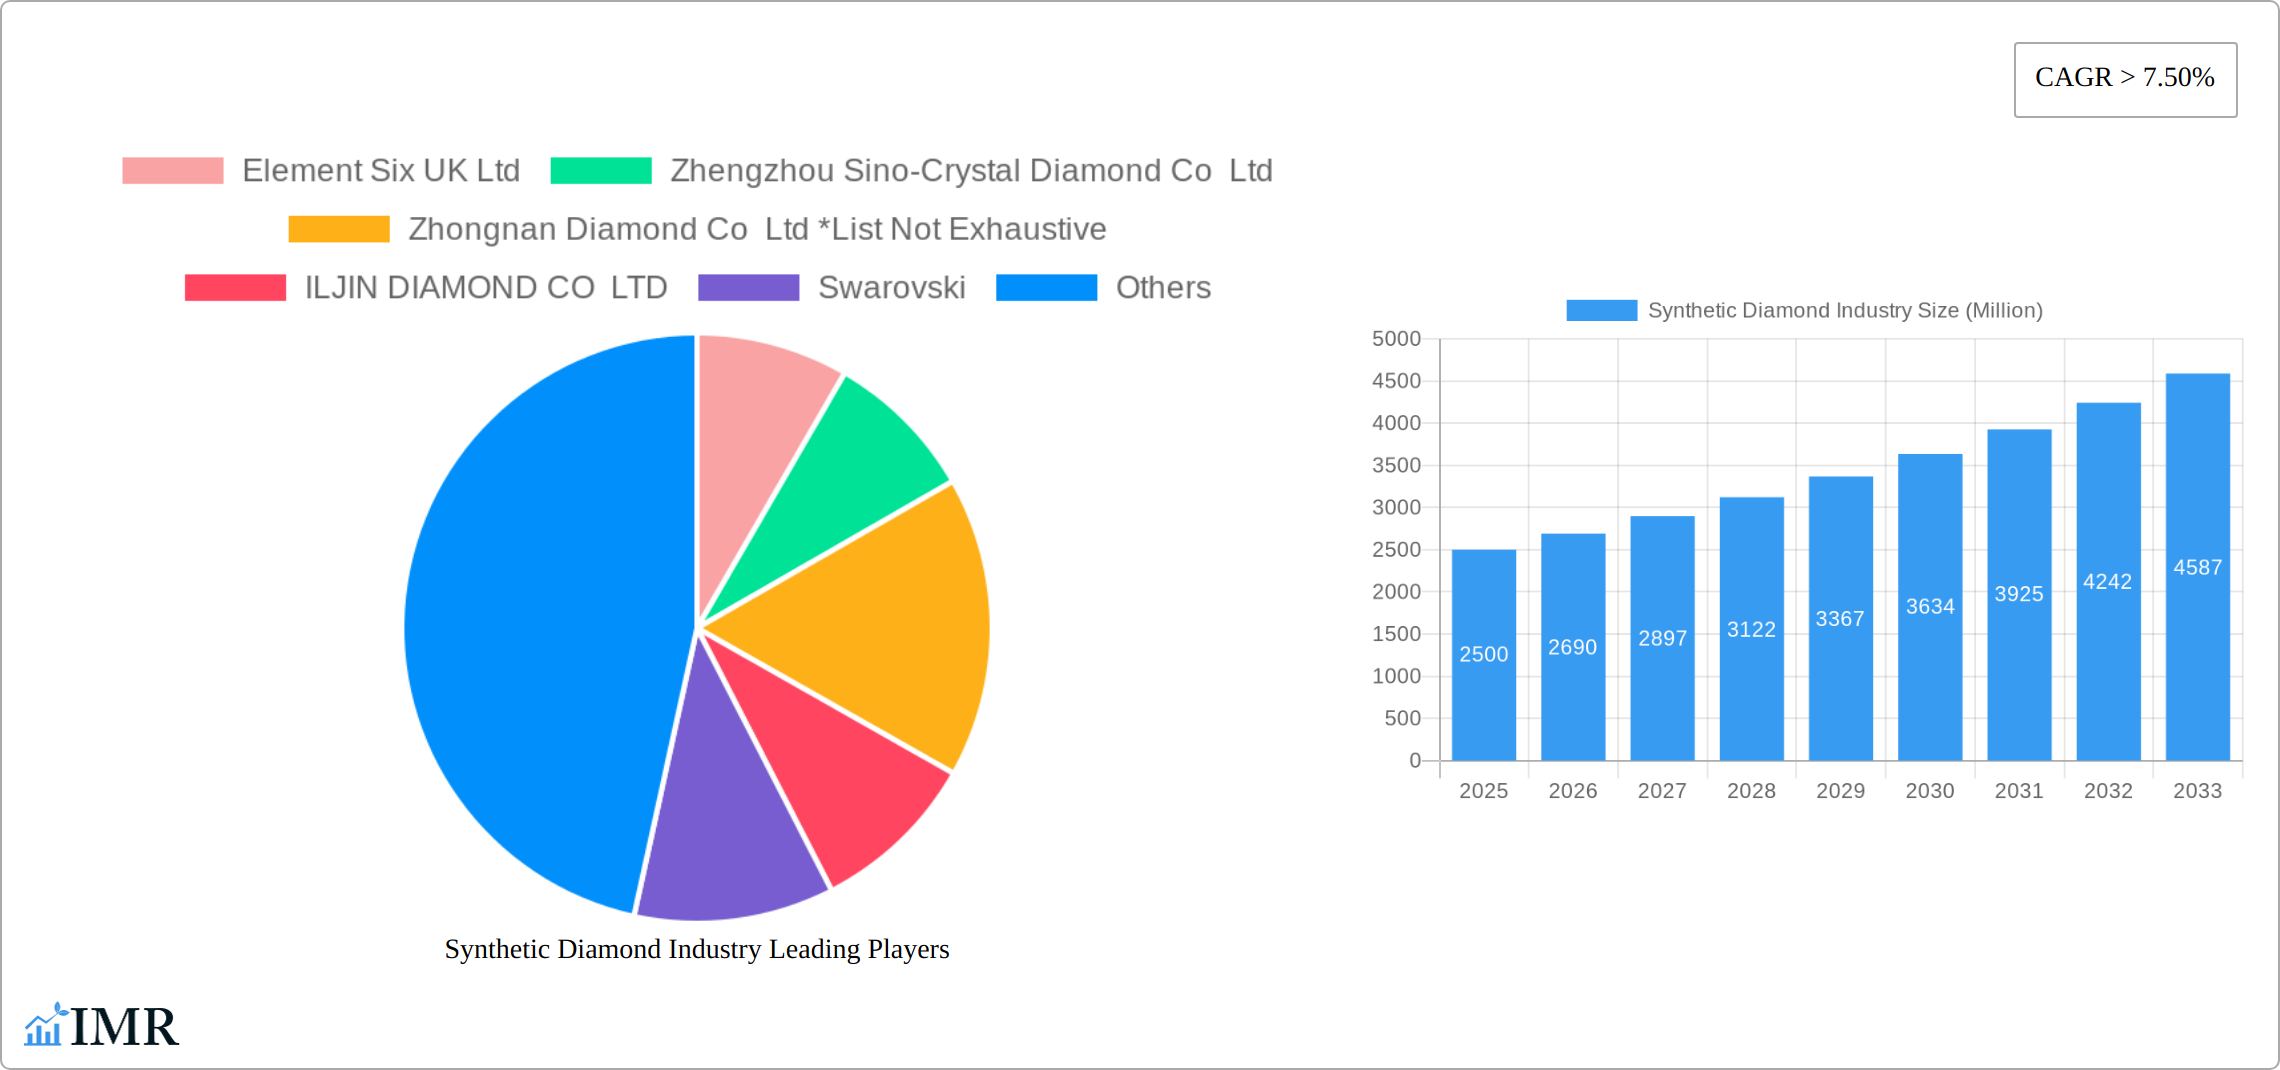
The global synthetic diamond market is experiencing robust growth, projected to maintain a Compound Annual Growth Rate (CAGR) exceeding 7.5% from 2025 to 2033. This expansion is driven by increasing demand across diverse sectors, including jewelry, industrial applications (cutting, grinding, polishing), and electronics (heat sinks, power devices). The rising popularity of lab-grown diamonds as ethical and sustainable alternatives to mined diamonds is a significant factor boosting market size, particularly within the polished diamond segment. Technological advancements in High Pressure High Temperature (HPHT) and Chemical Vapor Deposition (CVD) manufacturing processes are leading to improved quality, larger sizes, and reduced production costs, further fueling market growth. While the rough diamond segment holds a considerable share, the polished segment is experiencing faster growth, driven by consumer preference for ready-to-use gems. Key players like Element Six, Swarovski, and several Asian manufacturers are actively investing in R&D and expanding production capacities to capitalize on the burgeoning market. Regional analysis indicates strong growth across North America, Europe, and particularly in the Asia-Pacific region, driven by China and India's rapidly expanding middle classes and their increasing purchasing power.
Despite the positive outlook, certain restraints exist. Fluctuations in raw material prices, intense competition among established and emerging players, and potential technological disruptions could impact market trajectory. However, the overall trend indicates a long-term positive outlook. The market's diversification across various applications and geographical regions mitigates some of these risks. Furthermore, continuous innovation in synthetic diamond production techniques and the growing consumer awareness surrounding sustainability are likely to offset the negative impacts and sustain high growth projections over the forecast period. A comprehensive analysis suggests that this market will continue to be one of the fastest-growing segments in the gemstone industry in the coming decade.
Synthetic Diamond Industry Market Report: 2019-2033
This comprehensive report provides an in-depth analysis of the synthetic diamond market, encompassing market dynamics, growth trends, regional analysis, product landscape, key players, and future outlook. The study period covers 2019-2033, with a base year of 2025 and a forecast period of 2025-2033. This report is invaluable for industry professionals, investors, and strategic decision-makers seeking a clear understanding of this rapidly evolving market. The report segments the market by Type (Polished, Rough), and Manufacturing Process (HPHT, CVD) allowing for a granular view of market dynamics within the parent market of industrial diamonds and the child market of gem-quality diamonds.
Synthetic Diamond Industry Market Dynamics & Structure
The synthetic diamond market is characterized by increasing consolidation, driven by technological advancements and strategic acquisitions. Market concentration is moderate, with several key players holding significant shares, while numerous smaller companies cater to niche segments. Technological innovation, particularly in CVD manufacturing, is a primary growth driver, enhancing efficiency and expanding applications. Regulatory frameworks vary across regions, impacting production costs and market access. Competitive pressure from natural diamonds remains, though synthetic diamonds offer advantages in cost and consistent quality. End-user demographics are diversifying, with increased demand from diverse industries such as electronics, abrasives, and jewelry. M&A activity has been moderate in recent years, with a focus on consolidating manufacturing capabilities and expanding into new applications. The market size in 2025 is estimated at $XX Billion.
- Market Concentration: Moderate, with top 5 players holding approximately 60% market share.
- Technological Innovation: CVD technology is rapidly improving efficiency and lowering costs.
- Regulatory Frameworks: Vary by region, affecting production and import/export.
- Competitive Substitutes: Natural diamonds, other advanced materials.
- M&A Activity: An average of xx deals per year over the historical period.
- Innovation Barriers: High initial capital investment for CVD equipment.
Synthetic Diamond Industry Growth Trends & Insights
The synthetic diamond market has experienced significant growth over the historical period (2019-2024), driven by technological advancements, cost reductions, and expanding applications. The market size is projected to reach $XX Billion by 2033, exhibiting a Compound Annual Growth Rate (CAGR) of xx% during the forecast period (2025-2033). Adoption rates are increasing across various sectors, particularly in electronics and industrial applications. Technological disruptions, primarily the advancement of CVD technology, are significantly impacting production efficiency and quality. Consumer behavior is shifting towards greater acceptance of synthetic diamonds, fueled by increasing awareness of their ethical and environmental advantages. Market penetration is increasing across all segments, with the polished diamond segment experiencing the highest growth rate. The overall market demonstrates robust growth potential due to the increasing demand for advanced materials and the growing popularity of laboratory-grown diamonds in the jewelry industry. Demand for large, high-quality synthetic diamonds continues to be a challenge, driving further research and development efforts.

Dominant Regions, Countries, or Segments in Synthetic Diamond Industry
China and other East Asian countries are currently dominating the synthetic diamond market, driven by strong manufacturing capacity, supportive government policies, and a large domestic market. The polished diamond segment currently holds the largest market share, followed by the rough diamond segment. HPHT remains a significant manufacturing process, although CVD is rapidly gaining traction due to its scalability and ability to produce higher-quality diamonds.
- Key Drivers:
- China: Large manufacturing base, significant government investment in advanced materials.
- Other East Asian Countries: Strong export-oriented economies, established supply chains.
- Polished Diamonds: High demand from jewelry and other luxury goods markets.
- CVD Technology: Superior quality and consistency compared to HPHT.
- Dominance Factors: Cost-effectiveness of manufacturing in East Asia, strong downstream industrial demand.
- Growth Potential: Strong growth potential in regions with developing electronics and industrial sectors.
Synthetic Diamond Industry Product Landscape
Synthetic diamonds offer superior properties compared to natural diamonds, including greater consistency, enhanced purity, and tailored characteristics for specific applications. Innovations focus on increasing diamond size, improving color and clarity, and developing specialized functionalities for electronic devices, cutting tools, and other high-performance applications. Technological advancements include the precise control of diamond morphology and doping, enabling the creation of diamonds with customized properties. The unique selling propositions include cost-effectiveness, ethical sourcing, and customizable performance characteristics.
Key Drivers, Barriers & Challenges in Synthetic Diamond Industry
Key Drivers:
- Technological advancements (CVD process improvements).
- Rising demand from electronics and industrial sectors.
- Growing consumer acceptance of synthetic diamonds in jewelry.
Key Challenges and Restraints:
- High initial capital investment for CVD equipment.
- Maintaining consistent product quality at scale.
- Competition from natural diamonds and other advanced materials. This competitive pressure reduces overall margins by approximately xx%.
Emerging Opportunities in Synthetic Diamond Industry
- Expansion into new applications (quantum computing, medical devices).
- Development of novel diamond-based composites and coatings.
- Growth of the consumer market for synthetic diamond jewelry.
Growth Accelerators in the Synthetic Diamond Industry
Technological breakthroughs in CVD synthesis are expected to significantly accelerate market growth, driving both cost reduction and improved product performance. Strategic partnerships between diamond manufacturers and technology companies will expand applications and market penetration. Expansion into new geographic markets, particularly in developing economies, presents significant growth opportunities. Further investment in R&D focused on sustainable and environmentally friendly production processes will enhance the attractiveness of the industry.
Key Players Shaping the Synthetic Diamond Industry Market
- Element Six UK Ltd
- Zhengzhou Sino-Crystal Diamond Co Ltd
- Zhongnan Diamond Co Ltd
- ILJIN DIAMOND CO LTD
- Swarovski
- New Diamond Technology
- Pure Grown Diamonds (PGD)
- Applied Diamond Inc
- Henan Huanghe Whirlwind Co Ltd
- Sumitomo Electric Industries Ltd
- Adamas One Corp
Notable Milestones in Synthetic Diamond Industry Sector
- July 2021: Element Six UK LTD partnered with the University of Warwick to develop next-generation synthetic diamond technologies.
- February 2022: Element Six UK Ltd collaborated with II-VI Inc. to produce high-quality single-crystal diamonds.
In-Depth Synthetic Diamond Industry Market Outlook
The synthetic diamond market is poised for sustained growth, driven by technological innovation, increasing demand from diverse sectors, and growing consumer acceptance. Strategic partnerships and expansion into new applications will further enhance market potential. Companies focusing on R&D, process optimization, and sustainable practices will be best positioned to capitalize on the opportunities presented by this dynamic and rapidly evolving market. The market's future trajectory hinges on the continued advancement of CVD technology and the successful integration of synthetic diamonds into mainstream applications, leading to significant market expansion in the coming years.
Synthetic Diamond Industry Segmentation
-
1. Type
-
1.1. Polished
- 1.1.1. Jewelry
- 1.1.2. Electronics
- 1.1.3. Healthcare
- 1.1.4. Other Polished Types
-
1.2. Rough
- 1.2.1. Construction
- 1.2.2. Mining
- 1.2.3. Oil and Gas
- 1.2.4. Other Rough Types
-
1.1. Polished
-
2. Manufacturing Process
- 2.1. High Pressure, High Temperature (HPHT)
- 2.2. Chemical Vapor Deposition (CVD)
Synthetic Diamond Industry Segmentation By Geography
-
1. Asia Pacific
- 1.1. China
- 1.2. India
- 1.3. Japan
- 1.4. ASEAN Countries
- 1.5. Rest of Asia Pacific
-
2. North America
- 2.1. United States
- 2.2. Rest of North America
-
3. Europe
- 3.1. Germany
- 3.2. France
- 3.3. United Kingdom
- 3.4. Italy
- 3.5. Spain
- 3.6. Rest of Europe
-
4. South America
- 4.1. Brazil
- 4.2. Rest of South America
-
5. Middle East and Africa
- 5.1. GCC Countries
- 5.2. South Africa
- 5.3. Rest of Middle East and Africa

Synthetic Diamond Industry REPORT HIGHLIGHTS
| Aspects | Details |
|---|---|
| Study Period | 2019-2033 |
| Base Year | 2024 |
| Estimated Year | 2025 |
| Forecast Period | 2025-2033 |
| Historical Period | 2019-2024 |
| Growth Rate | CAGR of > 7.50% from 2019-2033 |
| Segmentation |
|
Table of Contents
- 1. Introduction
- 1.1. Research Scope
- 1.2. Market Segmentation
- 1.3. Research Methodology
- 1.4. Definitions and Assumptions
- 2. Executive Summary
- 2.1. Introduction
- 3. Market Dynamics
- 3.1. Introduction
- 3.2. Market Drivers
- 3.2.1. Increasing Demand from Electronics and Semiconductors Applications; Growing Demand for Super Abrasives
- 3.3. Market Restrains
- 3.3.1. Complex Manufacturing Process
- 3.4. Market Trends
- 3.4.1. Construction Segment to Dominate the Rough Type
- 4. Market Factor Analysis
- 4.1. Porters Five Forces
- 4.2. Supply/Value Chain
- 4.3. PESTEL analysis
- 4.4. Market Entropy
- 4.5. Patent/Trademark Analysis
- 5. Global Synthetic Diamond Industry Analysis, Insights and Forecast, 2019-2031
- 5.1. Market Analysis, Insights and Forecast - by Type
- 5.1.1. Polished
- 5.1.1.1. Jewelry
- 5.1.1.2. Electronics
- 5.1.1.3. Healthcare
- 5.1.1.4. Other Polished Types
- 5.1.2. Rough
- 5.1.2.1. Construction
- 5.1.2.2. Mining
- 5.1.2.3. Oil and Gas
- 5.1.2.4. Other Rough Types
- 5.1.1. Polished
- 5.2. Market Analysis, Insights and Forecast - by Manufacturing Process
- 5.2.1. High Pressure, High Temperature (HPHT)
- 5.2.2. Chemical Vapor Deposition (CVD)
- 5.3. Market Analysis, Insights and Forecast - by Region
- 5.3.1. Asia Pacific
- 5.3.2. North America
- 5.3.3. Europe
- 5.3.4. South America
- 5.3.5. Middle East and Africa
- 5.1. Market Analysis, Insights and Forecast - by Type
- 6. Asia Pacific Synthetic Diamond Industry Analysis, Insights and Forecast, 2019-2031
- 6.1. Market Analysis, Insights and Forecast - by Type
- 6.1.1. Polished
- 6.1.1.1. Jewelry
- 6.1.1.2. Electronics
- 6.1.1.3. Healthcare
- 6.1.1.4. Other Polished Types
- 6.1.2. Rough
- 6.1.2.1. Construction
- 6.1.2.2. Mining
- 6.1.2.3. Oil and Gas
- 6.1.2.4. Other Rough Types
- 6.1.1. Polished
- 6.2. Market Analysis, Insights and Forecast - by Manufacturing Process
- 6.2.1. High Pressure, High Temperature (HPHT)
- 6.2.2. Chemical Vapor Deposition (CVD)
- 6.1. Market Analysis, Insights and Forecast - by Type
- 7. North America Synthetic Diamond Industry Analysis, Insights and Forecast, 2019-2031
- 7.1. Market Analysis, Insights and Forecast - by Type
- 7.1.1. Polished
- 7.1.1.1. Jewelry
- 7.1.1.2. Electronics
- 7.1.1.3. Healthcare
- 7.1.1.4. Other Polished Types
- 7.1.2. Rough
- 7.1.2.1. Construction
- 7.1.2.2. Mining
- 7.1.2.3. Oil and Gas
- 7.1.2.4. Other Rough Types
- 7.1.1. Polished
- 7.2. Market Analysis, Insights and Forecast - by Manufacturing Process
- 7.2.1. High Pressure, High Temperature (HPHT)
- 7.2.2. Chemical Vapor Deposition (CVD)
- 7.1. Market Analysis, Insights and Forecast - by Type
- 8. Europe Synthetic Diamond Industry Analysis, Insights and Forecast, 2019-2031
- 8.1. Market Analysis, Insights and Forecast - by Type
- 8.1.1. Polished
- 8.1.1.1. Jewelry
- 8.1.1.2. Electronics
- 8.1.1.3. Healthcare
- 8.1.1.4. Other Polished Types
- 8.1.2. Rough
- 8.1.2.1. Construction
- 8.1.2.2. Mining
- 8.1.2.3. Oil and Gas
- 8.1.2.4. Other Rough Types
- 8.1.1. Polished
- 8.2. Market Analysis, Insights and Forecast - by Manufacturing Process
- 8.2.1. High Pressure, High Temperature (HPHT)
- 8.2.2. Chemical Vapor Deposition (CVD)
- 8.1. Market Analysis, Insights and Forecast - by Type
- 9. South America Synthetic Diamond Industry Analysis, Insights and Forecast, 2019-2031
- 9.1. Market Analysis, Insights and Forecast - by Type
- 9.1.1. Polished
- 9.1.1.1. Jewelry
- 9.1.1.2. Electronics
- 9.1.1.3. Healthcare
- 9.1.1.4. Other Polished Types
- 9.1.2. Rough
- 9.1.2.1. Construction
- 9.1.2.2. Mining
- 9.1.2.3. Oil and Gas
- 9.1.2.4. Other Rough Types
- 9.1.1. Polished
- 9.2. Market Analysis, Insights and Forecast - by Manufacturing Process
- 9.2.1. High Pressure, High Temperature (HPHT)
- 9.2.2. Chemical Vapor Deposition (CVD)
- 9.1. Market Analysis, Insights and Forecast - by Type
- 10. Middle East and Africa Synthetic Diamond Industry Analysis, Insights and Forecast, 2019-2031
- 10.1. Market Analysis, Insights and Forecast - by Type
- 10.1.1. Polished
- 10.1.1.1. Jewelry
- 10.1.1.2. Electronics
- 10.1.1.3. Healthcare
- 10.1.1.4. Other Polished Types
- 10.1.2. Rough
- 10.1.2.1. Construction
- 10.1.2.2. Mining
- 10.1.2.3. Oil and Gas
- 10.1.2.4. Other Rough Types
- 10.1.1. Polished
- 10.2. Market Analysis, Insights and Forecast - by Manufacturing Process
- 10.2.1. High Pressure, High Temperature (HPHT)
- 10.2.2. Chemical Vapor Deposition (CVD)
- 10.1. Market Analysis, Insights and Forecast - by Type
- 11. North America Synthetic Diamond Industry Analysis, Insights and Forecast, 2019-2031
- 11.1. Market Analysis, Insights and Forecast - By Country/Sub-region
- 11.1.1 United States
- 11.1.2 Canada
- 11.1.3 Mexico
- 12. Europe Synthetic Diamond Industry Analysis, Insights and Forecast, 2019-2031
- 12.1. Market Analysis, Insights and Forecast - By Country/Sub-region
- 12.1.1 Germany
- 12.1.2 United Kingdom
- 12.1.3 France
- 12.1.4 Spain
- 12.1.5 Italy
- 12.1.6 Spain
- 12.1.7 Belgium
- 12.1.8 Netherland
- 12.1.9 Nordics
- 12.1.10 Rest of Europe
- 13. Asia Pacific Synthetic Diamond Industry Analysis, Insights and Forecast, 2019-2031
- 13.1. Market Analysis, Insights and Forecast - By Country/Sub-region
- 13.1.1 China
- 13.1.2 Japan
- 13.1.3 India
- 13.1.4 South Korea
- 13.1.5 Southeast Asia
- 13.1.6 Australia
- 13.1.7 Indonesia
- 13.1.8 Phillipes
- 13.1.9 Singapore
- 13.1.10 Thailandc
- 13.1.11 Rest of Asia Pacific
- 14. South America Synthetic Diamond Industry Analysis, Insights and Forecast, 2019-2031
- 14.1. Market Analysis, Insights and Forecast - By Country/Sub-region
- 14.1.1 Brazil
- 14.1.2 Argentina
- 14.1.3 Peru
- 14.1.4 Chile
- 14.1.5 Colombia
- 14.1.6 Ecuador
- 14.1.7 Venezuela
- 14.1.8 Rest of South America
- 15. North America Synthetic Diamond Industry Analysis, Insights and Forecast, 2019-2031
- 15.1. Market Analysis, Insights and Forecast - By Country/Sub-region
- 15.1.1 United States
- 15.1.2 Canada
- 15.1.3 Mexico
- 16. MEA Synthetic Diamond Industry Analysis, Insights and Forecast, 2019-2031
- 16.1. Market Analysis, Insights and Forecast - By Country/Sub-region
- 16.1.1 United Arab Emirates
- 16.1.2 Saudi Arabia
- 16.1.3 South Africa
- 16.1.4 Rest of Middle East and Africa
- 17. Competitive Analysis
- 17.1. Global Market Share Analysis 2024
- 17.2. Company Profiles
- 17.2.1 Element Six UK Ltd
- 17.2.1.1. Overview
- 17.2.1.2. Products
- 17.2.1.3. SWOT Analysis
- 17.2.1.4. Recent Developments
- 17.2.1.5. Financials (Based on Availability)
- 17.2.2 Zhengzhou Sino-Crystal Diamond Co Ltd
- 17.2.2.1. Overview
- 17.2.2.2. Products
- 17.2.2.3. SWOT Analysis
- 17.2.2.4. Recent Developments
- 17.2.2.5. Financials (Based on Availability)
- 17.2.3 Zhongnan Diamond Co Ltd *List Not Exhaustive
- 17.2.3.1. Overview
- 17.2.3.2. Products
- 17.2.3.3. SWOT Analysis
- 17.2.3.4. Recent Developments
- 17.2.3.5. Financials (Based on Availability)
- 17.2.4 ILJIN DIAMOND CO LTD
- 17.2.4.1. Overview
- 17.2.4.2. Products
- 17.2.4.3. SWOT Analysis
- 17.2.4.4. Recent Developments
- 17.2.4.5. Financials (Based on Availability)
- 17.2.5 Swarovski
- 17.2.5.1. Overview
- 17.2.5.2. Products
- 17.2.5.3. SWOT Analysis
- 17.2.5.4. Recent Developments
- 17.2.5.5. Financials (Based on Availability)
- 17.2.6 New Diamond Technology
- 17.2.6.1. Overview
- 17.2.6.2. Products
- 17.2.6.3. SWOT Analysis
- 17.2.6.4. Recent Developments
- 17.2.6.5. Financials (Based on Availability)
- 17.2.7 Pure Grown Diamonds (PGD)
- 17.2.7.1. Overview
- 17.2.7.2. Products
- 17.2.7.3. SWOT Analysis
- 17.2.7.4. Recent Developments
- 17.2.7.5. Financials (Based on Availability)
- 17.2.8 Applied Diamond Inc
- 17.2.8.1. Overview
- 17.2.8.2. Products
- 17.2.8.3. SWOT Analysis
- 17.2.8.4. Recent Developments
- 17.2.8.5. Financials (Based on Availability)
- 17.2.9 Henan Huanghe Whirlwind Co Ltd
- 17.2.9.1. Overview
- 17.2.9.2. Products
- 17.2.9.3. SWOT Analysis
- 17.2.9.4. Recent Developments
- 17.2.9.5. Financials (Based on Availability)
- 17.2.10 Sumitomo Electric Industries Ltd
- 17.2.10.1. Overview
- 17.2.10.2. Products
- 17.2.10.3. SWOT Analysis
- 17.2.10.4. Recent Developments
- 17.2.10.5. Financials (Based on Availability)
- 17.2.11 Adamas One Corp
- 17.2.11.1. Overview
- 17.2.11.2. Products
- 17.2.11.3. SWOT Analysis
- 17.2.11.4. Recent Developments
- 17.2.11.5. Financials (Based on Availability)
- 17.2.1 Element Six UK Ltd
List of Figures
- Figure 1: Global Synthetic Diamond Industry Revenue Breakdown (Million, %) by Region 2024 & 2032
- Figure 2: North America Synthetic Diamond Industry Revenue (Million), by Country 2024 & 2032
- Figure 3: North America Synthetic Diamond Industry Revenue Share (%), by Country 2024 & 2032
- Figure 4: Europe Synthetic Diamond Industry Revenue (Million), by Country 2024 & 2032
- Figure 5: Europe Synthetic Diamond Industry Revenue Share (%), by Country 2024 & 2032
- Figure 6: Asia Pacific Synthetic Diamond Industry Revenue (Million), by Country 2024 & 2032
- Figure 7: Asia Pacific Synthetic Diamond Industry Revenue Share (%), by Country 2024 & 2032
- Figure 8: South America Synthetic Diamond Industry Revenue (Million), by Country 2024 & 2032
- Figure 9: South America Synthetic Diamond Industry Revenue Share (%), by Country 2024 & 2032
- Figure 10: North America Synthetic Diamond Industry Revenue (Million), by Country 2024 & 2032
- Figure 11: North America Synthetic Diamond Industry Revenue Share (%), by Country 2024 & 2032
- Figure 12: MEA Synthetic Diamond Industry Revenue (Million), by Country 2024 & 2032
- Figure 13: MEA Synthetic Diamond Industry Revenue Share (%), by Country 2024 & 2032
- Figure 14: Asia Pacific Synthetic Diamond Industry Revenue (Million), by Type 2024 & 2032
- Figure 15: Asia Pacific Synthetic Diamond Industry Revenue Share (%), by Type 2024 & 2032
- Figure 16: Asia Pacific Synthetic Diamond Industry Revenue (Million), by Manufacturing Process 2024 & 2032
- Figure 17: Asia Pacific Synthetic Diamond Industry Revenue Share (%), by Manufacturing Process 2024 & 2032
- Figure 18: Asia Pacific Synthetic Diamond Industry Revenue (Million), by Country 2024 & 2032
- Figure 19: Asia Pacific Synthetic Diamond Industry Revenue Share (%), by Country 2024 & 2032
- Figure 20: North America Synthetic Diamond Industry Revenue (Million), by Type 2024 & 2032
- Figure 21: North America Synthetic Diamond Industry Revenue Share (%), by Type 2024 & 2032
- Figure 22: North America Synthetic Diamond Industry Revenue (Million), by Manufacturing Process 2024 & 2032
- Figure 23: North America Synthetic Diamond Industry Revenue Share (%), by Manufacturing Process 2024 & 2032
- Figure 24: North America Synthetic Diamond Industry Revenue (Million), by Country 2024 & 2032
- Figure 25: North America Synthetic Diamond Industry Revenue Share (%), by Country 2024 & 2032
- Figure 26: Europe Synthetic Diamond Industry Revenue (Million), by Type 2024 & 2032
- Figure 27: Europe Synthetic Diamond Industry Revenue Share (%), by Type 2024 & 2032
- Figure 28: Europe Synthetic Diamond Industry Revenue (Million), by Manufacturing Process 2024 & 2032
- Figure 29: Europe Synthetic Diamond Industry Revenue Share (%), by Manufacturing Process 2024 & 2032
- Figure 30: Europe Synthetic Diamond Industry Revenue (Million), by Country 2024 & 2032
- Figure 31: Europe Synthetic Diamond Industry Revenue Share (%), by Country 2024 & 2032
- Figure 32: South America Synthetic Diamond Industry Revenue (Million), by Type 2024 & 2032
- Figure 33: South America Synthetic Diamond Industry Revenue Share (%), by Type 2024 & 2032
- Figure 34: South America Synthetic Diamond Industry Revenue (Million), by Manufacturing Process 2024 & 2032
- Figure 35: South America Synthetic Diamond Industry Revenue Share (%), by Manufacturing Process 2024 & 2032
- Figure 36: South America Synthetic Diamond Industry Revenue (Million), by Country 2024 & 2032
- Figure 37: South America Synthetic Diamond Industry Revenue Share (%), by Country 2024 & 2032
- Figure 38: Middle East and Africa Synthetic Diamond Industry Revenue (Million), by Type 2024 & 2032
- Figure 39: Middle East and Africa Synthetic Diamond Industry Revenue Share (%), by Type 2024 & 2032
- Figure 40: Middle East and Africa Synthetic Diamond Industry Revenue (Million), by Manufacturing Process 2024 & 2032
- Figure 41: Middle East and Africa Synthetic Diamond Industry Revenue Share (%), by Manufacturing Process 2024 & 2032
- Figure 42: Middle East and Africa Synthetic Diamond Industry Revenue (Million), by Country 2024 & 2032
- Figure 43: Middle East and Africa Synthetic Diamond Industry Revenue Share (%), by Country 2024 & 2032
List of Tables
- Table 1: Global Synthetic Diamond Industry Revenue Million Forecast, by Region 2019 & 2032
- Table 2: Global Synthetic Diamond Industry Revenue Million Forecast, by Type 2019 & 2032
- Table 3: Global Synthetic Diamond Industry Revenue Million Forecast, by Manufacturing Process 2019 & 2032
- Table 4: Global Synthetic Diamond Industry Revenue Million Forecast, by Region 2019 & 2032
- Table 5: Global Synthetic Diamond Industry Revenue Million Forecast, by Country 2019 & 2032
- Table 6: United States Synthetic Diamond Industry Revenue (Million) Forecast, by Application 2019 & 2032
- Table 7: Canada Synthetic Diamond Industry Revenue (Million) Forecast, by Application 2019 & 2032
- Table 8: Mexico Synthetic Diamond Industry Revenue (Million) Forecast, by Application 2019 & 2032
- Table 9: Global Synthetic Diamond Industry Revenue Million Forecast, by Country 2019 & 2032
- Table 10: Germany Synthetic Diamond Industry Revenue (Million) Forecast, by Application 2019 & 2032
- Table 11: United Kingdom Synthetic Diamond Industry Revenue (Million) Forecast, by Application 2019 & 2032
- Table 12: France Synthetic Diamond Industry Revenue (Million) Forecast, by Application 2019 & 2032
- Table 13: Spain Synthetic Diamond Industry Revenue (Million) Forecast, by Application 2019 & 2032
- Table 14: Italy Synthetic Diamond Industry Revenue (Million) Forecast, by Application 2019 & 2032
- Table 15: Spain Synthetic Diamond Industry Revenue (Million) Forecast, by Application 2019 & 2032
- Table 16: Belgium Synthetic Diamond Industry Revenue (Million) Forecast, by Application 2019 & 2032
- Table 17: Netherland Synthetic Diamond Industry Revenue (Million) Forecast, by Application 2019 & 2032
- Table 18: Nordics Synthetic Diamond Industry Revenue (Million) Forecast, by Application 2019 & 2032
- Table 19: Rest of Europe Synthetic Diamond Industry Revenue (Million) Forecast, by Application 2019 & 2032
- Table 20: Global Synthetic Diamond Industry Revenue Million Forecast, by Country 2019 & 2032
- Table 21: China Synthetic Diamond Industry Revenue (Million) Forecast, by Application 2019 & 2032
- Table 22: Japan Synthetic Diamond Industry Revenue (Million) Forecast, by Application 2019 & 2032
- Table 23: India Synthetic Diamond Industry Revenue (Million) Forecast, by Application 2019 & 2032
- Table 24: South Korea Synthetic Diamond Industry Revenue (Million) Forecast, by Application 2019 & 2032
- Table 25: Southeast Asia Synthetic Diamond Industry Revenue (Million) Forecast, by Application 2019 & 2032
- Table 26: Australia Synthetic Diamond Industry Revenue (Million) Forecast, by Application 2019 & 2032
- Table 27: Indonesia Synthetic Diamond Industry Revenue (Million) Forecast, by Application 2019 & 2032
- Table 28: Phillipes Synthetic Diamond Industry Revenue (Million) Forecast, by Application 2019 & 2032
- Table 29: Singapore Synthetic Diamond Industry Revenue (Million) Forecast, by Application 2019 & 2032
- Table 30: Thailandc Synthetic Diamond Industry Revenue (Million) Forecast, by Application 2019 & 2032
- Table 31: Rest of Asia Pacific Synthetic Diamond Industry Revenue (Million) Forecast, by Application 2019 & 2032
- Table 32: Global Synthetic Diamond Industry Revenue Million Forecast, by Country 2019 & 2032
- Table 33: Brazil Synthetic Diamond Industry Revenue (Million) Forecast, by Application 2019 & 2032
- Table 34: Argentina Synthetic Diamond Industry Revenue (Million) Forecast, by Application 2019 & 2032
- Table 35: Peru Synthetic Diamond Industry Revenue (Million) Forecast, by Application 2019 & 2032
- Table 36: Chile Synthetic Diamond Industry Revenue (Million) Forecast, by Application 2019 & 2032
- Table 37: Colombia Synthetic Diamond Industry Revenue (Million) Forecast, by Application 2019 & 2032
- Table 38: Ecuador Synthetic Diamond Industry Revenue (Million) Forecast, by Application 2019 & 2032
- Table 39: Venezuela Synthetic Diamond Industry Revenue (Million) Forecast, by Application 2019 & 2032
- Table 40: Rest of South America Synthetic Diamond Industry Revenue (Million) Forecast, by Application 2019 & 2032
- Table 41: Global Synthetic Diamond Industry Revenue Million Forecast, by Country 2019 & 2032
- Table 42: United States Synthetic Diamond Industry Revenue (Million) Forecast, by Application 2019 & 2032
- Table 43: Canada Synthetic Diamond Industry Revenue (Million) Forecast, by Application 2019 & 2032
- Table 44: Mexico Synthetic Diamond Industry Revenue (Million) Forecast, by Application 2019 & 2032
- Table 45: Global Synthetic Diamond Industry Revenue Million Forecast, by Country 2019 & 2032
- Table 46: United Arab Emirates Synthetic Diamond Industry Revenue (Million) Forecast, by Application 2019 & 2032
- Table 47: Saudi Arabia Synthetic Diamond Industry Revenue (Million) Forecast, by Application 2019 & 2032
- Table 48: South Africa Synthetic Diamond Industry Revenue (Million) Forecast, by Application 2019 & 2032
- Table 49: Rest of Middle East and Africa Synthetic Diamond Industry Revenue (Million) Forecast, by Application 2019 & 2032
- Table 50: Global Synthetic Diamond Industry Revenue Million Forecast, by Type 2019 & 2032
- Table 51: Global Synthetic Diamond Industry Revenue Million Forecast, by Manufacturing Process 2019 & 2032
- Table 52: Global Synthetic Diamond Industry Revenue Million Forecast, by Country 2019 & 2032
- Table 53: China Synthetic Diamond Industry Revenue (Million) Forecast, by Application 2019 & 2032
- Table 54: India Synthetic Diamond Industry Revenue (Million) Forecast, by Application 2019 & 2032
- Table 55: Japan Synthetic Diamond Industry Revenue (Million) Forecast, by Application 2019 & 2032
- Table 56: ASEAN Countries Synthetic Diamond Industry Revenue (Million) Forecast, by Application 2019 & 2032
- Table 57: Rest of Asia Pacific Synthetic Diamond Industry Revenue (Million) Forecast, by Application 2019 & 2032
- Table 58: Global Synthetic Diamond Industry Revenue Million Forecast, by Type 2019 & 2032
- Table 59: Global Synthetic Diamond Industry Revenue Million Forecast, by Manufacturing Process 2019 & 2032
- Table 60: Global Synthetic Diamond Industry Revenue Million Forecast, by Country 2019 & 2032
- Table 61: United States Synthetic Diamond Industry Revenue (Million) Forecast, by Application 2019 & 2032
- Table 62: Rest of North America Synthetic Diamond Industry Revenue (Million) Forecast, by Application 2019 & 2032
- Table 63: Global Synthetic Diamond Industry Revenue Million Forecast, by Type 2019 & 2032
- Table 64: Global Synthetic Diamond Industry Revenue Million Forecast, by Manufacturing Process 2019 & 2032
- Table 65: Global Synthetic Diamond Industry Revenue Million Forecast, by Country 2019 & 2032
- Table 66: Germany Synthetic Diamond Industry Revenue (Million) Forecast, by Application 2019 & 2032
- Table 67: France Synthetic Diamond Industry Revenue (Million) Forecast, by Application 2019 & 2032
- Table 68: United Kingdom Synthetic Diamond Industry Revenue (Million) Forecast, by Application 2019 & 2032
- Table 69: Italy Synthetic Diamond Industry Revenue (Million) Forecast, by Application 2019 & 2032
- Table 70: Spain Synthetic Diamond Industry Revenue (Million) Forecast, by Application 2019 & 2032
- Table 71: Rest of Europe Synthetic Diamond Industry Revenue (Million) Forecast, by Application 2019 & 2032
- Table 72: Global Synthetic Diamond Industry Revenue Million Forecast, by Type 2019 & 2032
- Table 73: Global Synthetic Diamond Industry Revenue Million Forecast, by Manufacturing Process 2019 & 2032
- Table 74: Global Synthetic Diamond Industry Revenue Million Forecast, by Country 2019 & 2032
- Table 75: Brazil Synthetic Diamond Industry Revenue (Million) Forecast, by Application 2019 & 2032
- Table 76: Rest of South America Synthetic Diamond Industry Revenue (Million) Forecast, by Application 2019 & 2032
- Table 77: Global Synthetic Diamond Industry Revenue Million Forecast, by Type 2019 & 2032
- Table 78: Global Synthetic Diamond Industry Revenue Million Forecast, by Manufacturing Process 2019 & 2032
- Table 79: Global Synthetic Diamond Industry Revenue Million Forecast, by Country 2019 & 2032
- Table 80: GCC Countries Synthetic Diamond Industry Revenue (Million) Forecast, by Application 2019 & 2032
- Table 81: South Africa Synthetic Diamond Industry Revenue (Million) Forecast, by Application 2019 & 2032
- Table 82: Rest of Middle East and Africa Synthetic Diamond Industry Revenue (Million) Forecast, by Application 2019 & 2032
Frequently Asked Questions
1. What is the projected Compound Annual Growth Rate (CAGR) of the Synthetic Diamond Industry?
The projected CAGR is approximately > 7.50%.
2. Which companies are prominent players in the Synthetic Diamond Industry?
Key companies in the market include Element Six UK Ltd, Zhengzhou Sino-Crystal Diamond Co Ltd, Zhongnan Diamond Co Ltd *List Not Exhaustive, ILJIN DIAMOND CO LTD, Swarovski, New Diamond Technology, Pure Grown Diamonds (PGD), Applied Diamond Inc, Henan Huanghe Whirlwind Co Ltd, Sumitomo Electric Industries Ltd, Adamas One Corp.
3. What are the main segments of the Synthetic Diamond Industry?
The market segments include Type, Manufacturing Process.
4. Can you provide details about the market size?
The market size is estimated to be USD XX Million as of 2022.
5. What are some drivers contributing to market growth?
Increasing Demand from Electronics and Semiconductors Applications; Growing Demand for Super Abrasives.
6. What are the notable trends driving market growth?
Construction Segment to Dominate the Rough Type.
7. Are there any restraints impacting market growth?
Complex Manufacturing Process.
8. Can you provide examples of recent developments in the market?
In February 2022, Element Six UK Ltd collaborated with II-VI Inc. Through this collaboration, II-VI licenses Element Six's intellectual property and necessary equipment would produce high-quality single-crystal diamonds to expand its core competency in diamond technology.
9. What pricing options are available for accessing the report?
Pricing options include single-user, multi-user, and enterprise licenses priced at USD 4750, USD 5250, and USD 8750 respectively.
10. Is the market size provided in terms of value or volume?
The market size is provided in terms of value, measured in Million.
11. Are there any specific market keywords associated with the report?
Yes, the market keyword associated with the report is "Synthetic Diamond Industry," which aids in identifying and referencing the specific market segment covered.
12. How do I determine which pricing option suits my needs best?
The pricing options vary based on user requirements and access needs. Individual users may opt for single-user licenses, while businesses requiring broader access may choose multi-user or enterprise licenses for cost-effective access to the report.
13. Are there any additional resources or data provided in the Synthetic Diamond Industry report?
While the report offers comprehensive insights, it's advisable to review the specific contents or supplementary materials provided to ascertain if additional resources or data are available.
14. How can I stay updated on further developments or reports in the Synthetic Diamond Industry?
To stay informed about further developments, trends, and reports in the Synthetic Diamond Industry, consider subscribing to industry newsletters, following relevant companies and organizations, or regularly checking reputable industry news sources and publications.
Methodology
Step 1 - Identification of Relevant Samples Size from Population Database


Step 2 - Approaches for Defining Global Market Size (Value, Volume* & Price*)

Note*: In applicable scenarios
Step 3 - Data Sources
Primary Research
- Web Analytics
- Survey Reports
- Research Institute
- Latest Research Reports
- Opinion Leaders
Secondary Research
- Annual Reports
- White Paper
- Latest Press Release
- Industry Association
- Paid Database
- Investor Presentations

Step 4 - Data Triangulation
Involves using different sources of information in order to increase the validity of a study
These sources are likely to be stakeholders in a program - participants, other researchers, program staff, other community members, and so on.
Then we put all data in single framework & apply various statistical tools to find out the dynamic on the market.
During the analysis stage, feedback from the stakeholder groups would be compared to determine areas of agreement as well as areas of divergence
