

Key Insights
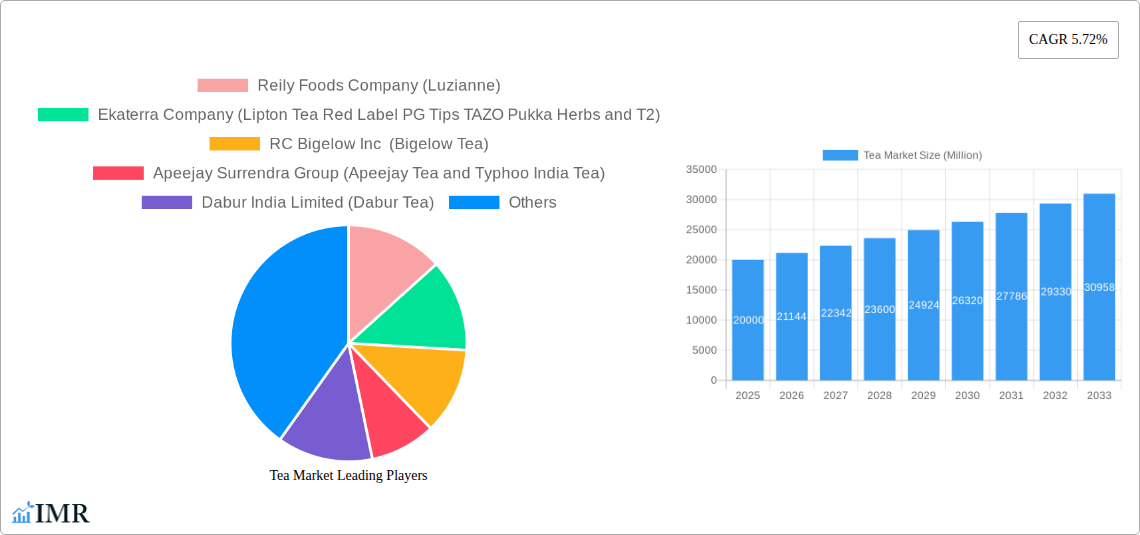
The global tea market, valued at approximately $XX million in 2025, is projected to experience robust growth, exhibiting a Compound Annual Growth Rate (CAGR) of 5.72% from 2025 to 2033. This expansion is fueled by several key drivers. The rising health consciousness among consumers is boosting demand for tea, particularly green and herbal varieties, perceived as healthier alternatives to sugary drinks. Furthermore, the increasing popularity of tea-based beverages in cafes and restaurants, along with innovative product launches like ready-to-drink teas and functional teas infused with vitamins and antioxidants, are significantly contributing to market growth. The diverse range of tea types—black, green, herbal, and others— caters to evolving consumer preferences and provides ample opportunity for market segmentation and expansion. Geographical distribution reveals strong regional variations, with Asia Pacific expected to retain its dominant position, driven by high tea consumption in countries like China and India. However, North America and Europe also represent significant markets with evolving trends in premium tea consumption and specialized retail channels. Challenges include fluctuating tea prices due to climatic conditions and the competition from other beverage categories. Nevertheless, the ongoing exploration of new flavors, formats, and functional benefits suggests that the tea market's growth trajectory is set to remain positive in the foreseeable future.
The segmentation of the tea market reveals interesting dynamics. Leaf tea and CTC tea (Crush, Tear, Curl) continue to dominate the form segment, while black tea maintains a substantial lead in the product type segment, though green and herbal teas are gaining considerable traction. Distribution channels are also diverse, with supermarkets/hypermarkets holding a strong market share, yet specialist retailers are experiencing growth as consumers seek higher quality and specialty teas. Key players like Unilever (Lipton), Tata Group (Tata Tea), and Associated British Foods (Twinings) dominate the market landscape, exhibiting both established brand recognition and an ongoing focus on innovation and market penetration. Their strategies encompass various product offerings, distribution networks, and marketing approaches to maintain competitiveness and capitalize on emerging trends within the market. The intense competition among established players, however, alongside the entry of new and niche players, necessitates continuous innovation and adaptation to maintain market share.
Tea Market: A Comprehensive Market Report (2019-2033)
This in-depth report provides a comprehensive analysis of the global tea market, encompassing market dynamics, growth trends, regional performance, product landscape, and key players. The study period spans from 2019 to 2033, with 2025 serving as the base and estimated year. The report utilizes a robust methodology to provide valuable insights for industry professionals, investors, and strategic decision-makers. This report is crucial for understanding the complexities and future potential within the parent tea market and its various child segments.
Tea Market Dynamics & Structure
The global tea market is characterized by a moderately concentrated structure with several key players holding significant market share. Technological advancements in tea processing, packaging, and distribution are driving innovation, while evolving consumer preferences and health consciousness are shaping product development. Stringent regulatory frameworks concerning food safety and labeling impact the market, particularly within specific regions. The rise of herbal and functional teas presents compelling substitutes to traditional black and green teas, influencing market competition. End-user demographics reveal a growing preference for convenience and premiumization across diverse age groups. Furthermore, significant M&A activity, as exemplified by the recent acquisition of Ekaterra by CVC Capital Partners, is reshaping the competitive landscape.
- Market Concentration: xx% held by top 5 players (2024).
- Technological Innovation: Focus on sustainable farming practices, innovative packaging, and functional tea blends.
- Regulatory Framework: Varies significantly across regions, impacting labeling, additives, and safety standards.
- Competitive Substitutes: Herbal infusions, coffee, and other functional beverages pose competition.
- End-User Demographics: Growing demand for premium, organic, and functional teas across various age groups.
- M&A Activity: xx deals valued at USD xx billion in the last 5 years (2019-2024).
Tea Market Growth Trends & Insights
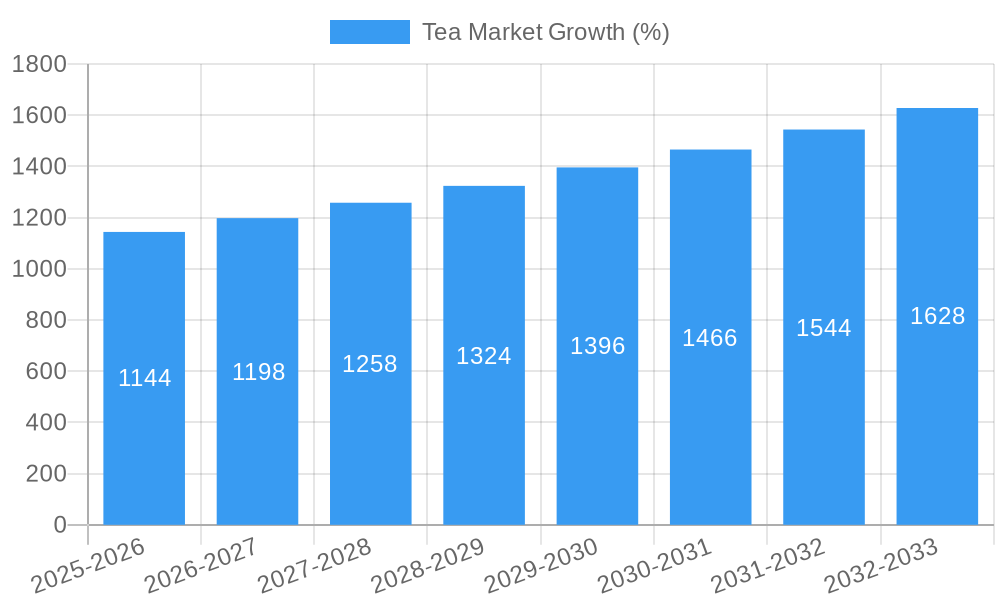
The global tea market exhibits a steady growth trajectory driven by factors such as increasing health awareness, diverse product offerings, and expanding distribution channels. The market experienced a CAGR of xx% during the historical period (2019-2024), projected to reach xx Million units by 2025 and continue growing at a CAGR of xx% during the forecast period (2025-2033). This growth is fueled by rising adoption rates of premium tea varieties, particularly within developing economies. Technological disruptions, including e-commerce platforms and improved processing techniques, are impacting market penetration and streamlining supply chains. Consumer behavior shifts towards healthier lifestyle choices and increasing disposable incomes are pivotal drivers. The market is witnessing a transition from traditional loose-leaf tea to convenient ready-to-drink and tea bags.
Dominant Regions, Countries, or Segments in Tea Market
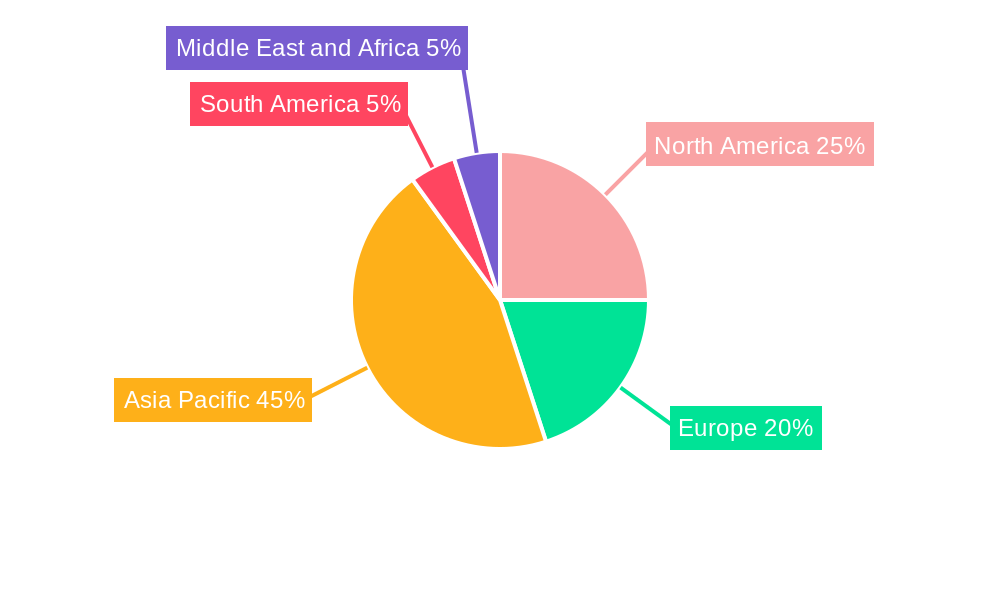
Asia dominates the global tea market, particularly India and China, due to their extensive tea cultivation and strong domestic consumption. Within product types, black tea holds the largest market share globally, followed by green tea and herbal teas. Supermarkets/hypermarkets represent the most prominent distribution channel, while specialist retailers cater to niche consumer segments. Growth is particularly strong in emerging markets with expanding middle classes and rising health consciousness.
- Key Drivers: Favorable economic policies in key markets, investment in infrastructure improving access to tea, and growing health awareness.
- Dominance Factors: Established tea cultivation practices in key regions, large consumer base, and extensive distribution networks.
- Market Share: Asia holds xx% of the global tea market (2024), with India and China accounting for xx% and xx% respectively.
- Growth Potential: Africa and South America present significant untapped growth potential.
Tea Market Product Landscape
The tea market showcases a wide array of products, from traditional black and green teas to innovative herbal blends and functional beverages. Product innovation is driven by health trends, with the introduction of functional teas enriched with vitamins, antioxidants, and other health-promoting ingredients. This includes the rise of organic and sustainably sourced teas catering to eco-conscious consumers. Performance metrics focus on flavor profiles, aroma, health benefits, and convenience aspects. Unique selling propositions emphasize premium quality, unique flavor combinations, and health-oriented benefits.
Key Drivers, Barriers & Challenges in Tea Market
Key Drivers:
- Growing health consciousness driving demand for functional teas.
- Expanding middle class in emerging markets increasing disposable income.
- Rising popularity of ready-to-drink teas and convenient packaging formats.
Challenges and Restraints:
- Fluctuations in raw material prices due to climate change and weather patterns.
- Intense competition amongst established brands and emerging players.
- Stringent regulatory requirements impacting product development and distribution.
- Supply chain disruptions due to geopolitical factors and logistical challenges.
Emerging Opportunities in Tea Market
- Premiumization: High-quality, organic, and specialty teas are gaining popularity.
- Functional Teas: Teas infused with health-boosting ingredients are seeing increased demand.
- Ready-to-Drink (RTD) Tea: Convenience remains a key driver of growth in this sector.
- E-commerce Growth: Online platforms are expanding access and reach for tea brands.
Growth Accelerators in the Tea Market Industry
Technological advancements in tea processing and packaging, coupled with strategic partnerships and market expansion into untapped territories, are key growth drivers. Innovative marketing strategies targeting health-conscious consumers, alongside sustainable sourcing initiatives and improved supply chain management, are poised to propel long-term market expansion. Furthermore, investments in research and development focused on enhancing product quality and exploring novel tea varieties will contribute to sustained growth.
Key Players Shaping the Tea Market Market
- Reily Foods Company (Luzianne)
- Ekaterra Company (Lipton Tea, Red Label, PG Tips, TAZO, Pukka Herbs and T2)
- RC Bigelow Inc (Bigelow Tea)
- Apeejay Surrendra Group (Apeejay Tea and Typhoo India Tea)
- Dabur India Limited (Dabur Tea)
- Yogi Tea (Yogi Tea)
- Bettys & Taylors of Harrogate Limited (Taylors of Harrogate, Bettys and Yorkshire Tea)
- Associated British Foods PLC (Twinings)
- Clipper Tea Company (Clipper Tea)
- Hain Celestial Group (Celestial Seasonings)
- Tata Group (Tata Tea, Tetley, Good Earth, Teapigs, Vitax and Joekels)
Notable Milestones in Tea Market Sector
- November 2022: Dabur India Limited launched Dabur Vedic Tea, a premium black tea infused with Ayurvedic herbs.
- November 2022: Tata Consumer Products expanded its green tea portfolio with the launch of Tetley Green Tea with Tulsi flavor.
- July 2022: CVC Capital Partners Fund VIII acquired Ekaterra, Unilever's tea business, for USD 4.83 billion.
In-Depth Tea Market Market Outlook
The future of the tea market appears bright, with continued growth driven by health and wellness trends, product diversification, and expansion into new markets. Strategic partnerships, investments in sustainable practices, and technological innovations will play a crucial role in shaping the market's trajectory. The focus on premiumization, functional teas, and convenient formats will continue to drive consumer demand and market expansion. The report highlights opportunities for both established players and new entrants to capitalize on emerging market trends and achieve significant growth.
Tea Market Segmentation
-
1. Form
- 1.1. Leaf Tea
- 1.2. CTC Tea
- 1.3. Other Forms
-
2. Product Type
- 2.1. Black Tea
- 2.2. Green Tea
- 2.3. Herbal Tea
- 2.4. Other Product Types
-
3. Distribution Channel
- 3.1. Supermarkets/Hypermarkets
- 3.2. Specialist Retailers
- 3.3. Convenience Stores
- 3.4. Other Distribution Channels
Tea Market Segmentation By Geography
-
1. North America
- 1.1. United States
- 1.2. Canada
- 1.3. Mexico
- 1.4. Rest of North America
-
2. Europe
- 2.1. United Kingdom
- 2.2. Germany
- 2.3. France
- 2.4. Spain
- 2.5. Italy
- 2.6. Russia
- 2.7. Rest of Europe
-
3. Asia Pacific
- 3.1. China
- 3.2. Japan
- 3.3. India
- 3.4. Australia
- 3.5. Rest of Asia Pacific
-
4. South America
- 4.1. Brazil
- 4.2. Argentina
- 4.3. Rest of South America
-
5. Middle East and Africa
- 5.1. South Africa
- 5.2. United Arab Emirates
- 5.3. Rest of Middle East and Africa
Tea Market REPORT HIGHLIGHTS
| Aspects | Details |
|---|---|
| Study Period | 2019-2033 |
| Base Year | 2024 |
| Estimated Year | 2025 |
| Forecast Period | 2025-2033 |
| Historical Period | 2019-2024 |
| Growth Rate | CAGR of 5.72% from 2019-2033 |
| Segmentation |
|
Table of Contents
- 1. Introduction
- 1.1. Research Scope
- 1.2. Market Segmentation
- 1.3. Research Methodology
- 1.4. Definitions and Assumptions
- 2. Executive Summary
- 2.1. Introduction
- 3. Market Dynamics
- 3.1. Introduction
- 3.2. Market Drivers
- 3.2.1. Increasing Demand for Herbal Teas; Increasing Consumer Awareness about Health Benefits of Tea
- 3.3. Market Restrains
- 3.3.1. High Cost of Production of Green Tea
- 3.4. Market Trends
- 3.4.1. Health Benefits of Tea is Propelling the Market Growth
- 4. Market Factor Analysis
- 4.1. Porters Five Forces
- 4.2. Supply/Value Chain
- 4.3. PESTEL analysis
- 4.4. Market Entropy
- 4.5. Patent/Trademark Analysis
- 5. Global Tea Market Analysis, Insights and Forecast, 2019-2031
- 5.1. Market Analysis, Insights and Forecast - by Form
- 5.1.1. Leaf Tea
- 5.1.2. CTC Tea
- 5.1.3. Other Forms
- 5.2. Market Analysis, Insights and Forecast - by Product Type
- 5.2.1. Black Tea
- 5.2.2. Green Tea
- 5.2.3. Herbal Tea
- 5.2.4. Other Product Types
- 5.3. Market Analysis, Insights and Forecast - by Distribution Channel
- 5.3.1. Supermarkets/Hypermarkets
- 5.3.2. Specialist Retailers
- 5.3.3. Convenience Stores
- 5.3.4. Other Distribution Channels
- 5.4. Market Analysis, Insights and Forecast - by Region
- 5.4.1. North America
- 5.4.2. Europe
- 5.4.3. Asia Pacific
- 5.4.4. South America
- 5.4.5. Middle East and Africa
- 5.1. Market Analysis, Insights and Forecast - by Form
- 6. North America Tea Market Analysis, Insights and Forecast, 2019-2031
- 6.1. Market Analysis, Insights and Forecast - by Form
- 6.1.1. Leaf Tea
- 6.1.2. CTC Tea
- 6.1.3. Other Forms
- 6.2. Market Analysis, Insights and Forecast - by Product Type
- 6.2.1. Black Tea
- 6.2.2. Green Tea
- 6.2.3. Herbal Tea
- 6.2.4. Other Product Types
- 6.3. Market Analysis, Insights and Forecast - by Distribution Channel
- 6.3.1. Supermarkets/Hypermarkets
- 6.3.2. Specialist Retailers
- 6.3.3. Convenience Stores
- 6.3.4. Other Distribution Channels
- 6.1. Market Analysis, Insights and Forecast - by Form
- 7. Europe Tea Market Analysis, Insights and Forecast, 2019-2031
- 7.1. Market Analysis, Insights and Forecast - by Form
- 7.1.1. Leaf Tea
- 7.1.2. CTC Tea
- 7.1.3. Other Forms
- 7.2. Market Analysis, Insights and Forecast - by Product Type
- 7.2.1. Black Tea
- 7.2.2. Green Tea
- 7.2.3. Herbal Tea
- 7.2.4. Other Product Types
- 7.3. Market Analysis, Insights and Forecast - by Distribution Channel
- 7.3.1. Supermarkets/Hypermarkets
- 7.3.2. Specialist Retailers
- 7.3.3. Convenience Stores
- 7.3.4. Other Distribution Channels
- 7.1. Market Analysis, Insights and Forecast - by Form
- 8. Asia Pacific Tea Market Analysis, Insights and Forecast, 2019-2031
- 8.1. Market Analysis, Insights and Forecast - by Form
- 8.1.1. Leaf Tea
- 8.1.2. CTC Tea
- 8.1.3. Other Forms
- 8.2. Market Analysis, Insights and Forecast - by Product Type
- 8.2.1. Black Tea
- 8.2.2. Green Tea
- 8.2.3. Herbal Tea
- 8.2.4. Other Product Types
- 8.3. Market Analysis, Insights and Forecast - by Distribution Channel
- 8.3.1. Supermarkets/Hypermarkets
- 8.3.2. Specialist Retailers
- 8.3.3. Convenience Stores
- 8.3.4. Other Distribution Channels
- 8.1. Market Analysis, Insights and Forecast - by Form
- 9. South America Tea Market Analysis, Insights and Forecast, 2019-2031
- 9.1. Market Analysis, Insights and Forecast - by Form
- 9.1.1. Leaf Tea
- 9.1.2. CTC Tea
- 9.1.3. Other Forms
- 9.2. Market Analysis, Insights and Forecast - by Product Type
- 9.2.1. Black Tea
- 9.2.2. Green Tea
- 9.2.3. Herbal Tea
- 9.2.4. Other Product Types
- 9.3. Market Analysis, Insights and Forecast - by Distribution Channel
- 9.3.1. Supermarkets/Hypermarkets
- 9.3.2. Specialist Retailers
- 9.3.3. Convenience Stores
- 9.3.4. Other Distribution Channels
- 9.1. Market Analysis, Insights and Forecast - by Form
- 10. Middle East and Africa Tea Market Analysis, Insights and Forecast, 2019-2031
- 10.1. Market Analysis, Insights and Forecast - by Form
- 10.1.1. Leaf Tea
- 10.1.2. CTC Tea
- 10.1.3. Other Forms
- 10.2. Market Analysis, Insights and Forecast - by Product Type
- 10.2.1. Black Tea
- 10.2.2. Green Tea
- 10.2.3. Herbal Tea
- 10.2.4. Other Product Types
- 10.3. Market Analysis, Insights and Forecast - by Distribution Channel
- 10.3.1. Supermarkets/Hypermarkets
- 10.3.2. Specialist Retailers
- 10.3.3. Convenience Stores
- 10.3.4. Other Distribution Channels
- 10.1. Market Analysis, Insights and Forecast - by Form
- 11. North America Tea Market Analysis, Insights and Forecast, 2019-2031
- 11.1. Market Analysis, Insights and Forecast - By Country/Sub-region
- 11.1.1 United States
- 11.1.2 Canada
- 11.1.3 Mexico
- 11.1.4 Rest of North America
- 12. Europe Tea Market Analysis, Insights and Forecast, 2019-2031
- 12.1. Market Analysis, Insights and Forecast - By Country/Sub-region
- 12.1.1 United Kingdom
- 12.1.2 Germany
- 12.1.3 France
- 12.1.4 Spain
- 12.1.5 Italy
- 12.1.6 Russia
- 12.1.7 Rest of Europe
- 13. Asia Pacific Tea Market Analysis, Insights and Forecast, 2019-2031
- 13.1. Market Analysis, Insights and Forecast - By Country/Sub-region
- 13.1.1 China
- 13.1.2 Japan
- 13.1.3 India
- 13.1.4 Australia
- 13.1.5 Rest of Asia Pacific
- 14. South America Tea Market Analysis, Insights and Forecast, 2019-2031
- 14.1. Market Analysis, Insights and Forecast - By Country/Sub-region
- 14.1.1 Brazil
- 14.1.2 Argentina
- 14.1.3 Rest of South America
- 15. Middle East and Africa Tea Market Analysis, Insights and Forecast, 2019-2031
- 15.1. Market Analysis, Insights and Forecast - By Country/Sub-region
- 15.1.1 South Africa
- 15.1.2 United Arab Emirates
- 15.1.3 Rest of Middle East and Africa
- 16. Competitive Analysis
- 16.1. Global Market Share Analysis 2024
- 16.2. Company Profiles
- 16.2.1 Reily Foods Company (Luzianne)
- 16.2.1.1. Overview
- 16.2.1.2. Products
- 16.2.1.3. SWOT Analysis
- 16.2.1.4. Recent Developments
- 16.2.1.5. Financials (Based on Availability)
- 16.2.2 Ekaterra Company (Lipton Tea Red Label PG Tips TAZO Pukka Herbs and T2)
- 16.2.2.1. Overview
- 16.2.2.2. Products
- 16.2.2.3. SWOT Analysis
- 16.2.2.4. Recent Developments
- 16.2.2.5. Financials (Based on Availability)
- 16.2.3 RC Bigelow Inc (Bigelow Tea)
- 16.2.3.1. Overview
- 16.2.3.2. Products
- 16.2.3.3. SWOT Analysis
- 16.2.3.4. Recent Developments
- 16.2.3.5. Financials (Based on Availability)
- 16.2.4 Apeejay Surrendra Group (Apeejay Tea and Typhoo India Tea)
- 16.2.4.1. Overview
- 16.2.4.2. Products
- 16.2.4.3. SWOT Analysis
- 16.2.4.4. Recent Developments
- 16.2.4.5. Financials (Based on Availability)
- 16.2.5 Dabur India Limited (Dabur Tea)
- 16.2.5.1. Overview
- 16.2.5.2. Products
- 16.2.5.3. SWOT Analysis
- 16.2.5.4. Recent Developments
- 16.2.5.5. Financials (Based on Availability)
- 16.2.6 Yogi Tea (Yogi Tea)
- 16.2.6.1. Overview
- 16.2.6.2. Products
- 16.2.6.3. SWOT Analysis
- 16.2.6.4. Recent Developments
- 16.2.6.5. Financials (Based on Availability)
- 16.2.7 Bettys & Taylors of Harrogate Limited (Taylors of Harrogate Bettys and Yorkshire Tea)
- 16.2.7.1. Overview
- 16.2.7.2. Products
- 16.2.7.3. SWOT Analysis
- 16.2.7.4. Recent Developments
- 16.2.7.5. Financials (Based on Availability)
- 16.2.8 Associated British Foods PLC (Twinings)
- 16.2.8.1. Overview
- 16.2.8.2. Products
- 16.2.8.3. SWOT Analysis
- 16.2.8.4. Recent Developments
- 16.2.8.5. Financials (Based on Availability)
- 16.2.9 Clipper Tea Company (Clipper Tea)
- 16.2.9.1. Overview
- 16.2.9.2. Products
- 16.2.9.3. SWOT Analysis
- 16.2.9.4. Recent Developments
- 16.2.9.5. Financials (Based on Availability)
- 16.2.10 Hain Celestial Group (Celestial Seasonings)
- 16.2.10.1. Overview
- 16.2.10.2. Products
- 16.2.10.3. SWOT Analysis
- 16.2.10.4. Recent Developments
- 16.2.10.5. Financials (Based on Availability)
- 16.2.11 Tata Group (Tata Tea Tetley Good Earth Teapigs Vitax and Joekels)
- 16.2.11.1. Overview
- 16.2.11.2. Products
- 16.2.11.3. SWOT Analysis
- 16.2.11.4. Recent Developments
- 16.2.11.5. Financials (Based on Availability)
- 16.2.1 Reily Foods Company (Luzianne)
List of Figures
- Figure 1: Global Tea Market Revenue Breakdown (Million, %) by Region 2024 & 2032
- Figure 2: Global Tea Market Volume Breakdown (K Tons, %) by Region 2024 & 2032
- Figure 3: North America Tea Market Revenue (Million), by Country 2024 & 2032
- Figure 4: North America Tea Market Volume (K Tons), by Country 2024 & 2032
- Figure 5: North America Tea Market Revenue Share (%), by Country 2024 & 2032
- Figure 6: North America Tea Market Volume Share (%), by Country 2024 & 2032
- Figure 7: Europe Tea Market Revenue (Million), by Country 2024 & 2032
- Figure 8: Europe Tea Market Volume (K Tons), by Country 2024 & 2032
- Figure 9: Europe Tea Market Revenue Share (%), by Country 2024 & 2032
- Figure 10: Europe Tea Market Volume Share (%), by Country 2024 & 2032
- Figure 11: Asia Pacific Tea Market Revenue (Million), by Country 2024 & 2032
- Figure 12: Asia Pacific Tea Market Volume (K Tons), by Country 2024 & 2032
- Figure 13: Asia Pacific Tea Market Revenue Share (%), by Country 2024 & 2032
- Figure 14: Asia Pacific Tea Market Volume Share (%), by Country 2024 & 2032
- Figure 15: South America Tea Market Revenue (Million), by Country 2024 & 2032
- Figure 16: South America Tea Market Volume (K Tons), by Country 2024 & 2032
- Figure 17: South America Tea Market Revenue Share (%), by Country 2024 & 2032
- Figure 18: South America Tea Market Volume Share (%), by Country 2024 & 2032
- Figure 19: Middle East and Africa Tea Market Revenue (Million), by Country 2024 & 2032
- Figure 20: Middle East and Africa Tea Market Volume (K Tons), by Country 2024 & 2032
- Figure 21: Middle East and Africa Tea Market Revenue Share (%), by Country 2024 & 2032
- Figure 22: Middle East and Africa Tea Market Volume Share (%), by Country 2024 & 2032
- Figure 23: North America Tea Market Revenue (Million), by Form 2024 & 2032
- Figure 24: North America Tea Market Volume (K Tons), by Form 2024 & 2032
- Figure 25: North America Tea Market Revenue Share (%), by Form 2024 & 2032
- Figure 26: North America Tea Market Volume Share (%), by Form 2024 & 2032
- Figure 27: North America Tea Market Revenue (Million), by Product Type 2024 & 2032
- Figure 28: North America Tea Market Volume (K Tons), by Product Type 2024 & 2032
- Figure 29: North America Tea Market Revenue Share (%), by Product Type 2024 & 2032
- Figure 30: North America Tea Market Volume Share (%), by Product Type 2024 & 2032
- Figure 31: North America Tea Market Revenue (Million), by Distribution Channel 2024 & 2032
- Figure 32: North America Tea Market Volume (K Tons), by Distribution Channel 2024 & 2032
- Figure 33: North America Tea Market Revenue Share (%), by Distribution Channel 2024 & 2032
- Figure 34: North America Tea Market Volume Share (%), by Distribution Channel 2024 & 2032
- Figure 35: North America Tea Market Revenue (Million), by Country 2024 & 2032
- Figure 36: North America Tea Market Volume (K Tons), by Country 2024 & 2032
- Figure 37: North America Tea Market Revenue Share (%), by Country 2024 & 2032
- Figure 38: North America Tea Market Volume Share (%), by Country 2024 & 2032
- Figure 39: Europe Tea Market Revenue (Million), by Form 2024 & 2032
- Figure 40: Europe Tea Market Volume (K Tons), by Form 2024 & 2032
- Figure 41: Europe Tea Market Revenue Share (%), by Form 2024 & 2032
- Figure 42: Europe Tea Market Volume Share (%), by Form 2024 & 2032
- Figure 43: Europe Tea Market Revenue (Million), by Product Type 2024 & 2032
- Figure 44: Europe Tea Market Volume (K Tons), by Product Type 2024 & 2032
- Figure 45: Europe Tea Market Revenue Share (%), by Product Type 2024 & 2032
- Figure 46: Europe Tea Market Volume Share (%), by Product Type 2024 & 2032
- Figure 47: Europe Tea Market Revenue (Million), by Distribution Channel 2024 & 2032
- Figure 48: Europe Tea Market Volume (K Tons), by Distribution Channel 2024 & 2032
- Figure 49: Europe Tea Market Revenue Share (%), by Distribution Channel 2024 & 2032
- Figure 50: Europe Tea Market Volume Share (%), by Distribution Channel 2024 & 2032
- Figure 51: Europe Tea Market Revenue (Million), by Country 2024 & 2032
- Figure 52: Europe Tea Market Volume (K Tons), by Country 2024 & 2032
- Figure 53: Europe Tea Market Revenue Share (%), by Country 2024 & 2032
- Figure 54: Europe Tea Market Volume Share (%), by Country 2024 & 2032
- Figure 55: Asia Pacific Tea Market Revenue (Million), by Form 2024 & 2032
- Figure 56: Asia Pacific Tea Market Volume (K Tons), by Form 2024 & 2032
- Figure 57: Asia Pacific Tea Market Revenue Share (%), by Form 2024 & 2032
- Figure 58: Asia Pacific Tea Market Volume Share (%), by Form 2024 & 2032
- Figure 59: Asia Pacific Tea Market Revenue (Million), by Product Type 2024 & 2032
- Figure 60: Asia Pacific Tea Market Volume (K Tons), by Product Type 2024 & 2032
- Figure 61: Asia Pacific Tea Market Revenue Share (%), by Product Type 2024 & 2032
- Figure 62: Asia Pacific Tea Market Volume Share (%), by Product Type 2024 & 2032
- Figure 63: Asia Pacific Tea Market Revenue (Million), by Distribution Channel 2024 & 2032
- Figure 64: Asia Pacific Tea Market Volume (K Tons), by Distribution Channel 2024 & 2032
- Figure 65: Asia Pacific Tea Market Revenue Share (%), by Distribution Channel 2024 & 2032
- Figure 66: Asia Pacific Tea Market Volume Share (%), by Distribution Channel 2024 & 2032
- Figure 67: Asia Pacific Tea Market Revenue (Million), by Country 2024 & 2032
- Figure 68: Asia Pacific Tea Market Volume (K Tons), by Country 2024 & 2032
- Figure 69: Asia Pacific Tea Market Revenue Share (%), by Country 2024 & 2032
- Figure 70: Asia Pacific Tea Market Volume Share (%), by Country 2024 & 2032
- Figure 71: South America Tea Market Revenue (Million), by Form 2024 & 2032
- Figure 72: South America Tea Market Volume (K Tons), by Form 2024 & 2032
- Figure 73: South America Tea Market Revenue Share (%), by Form 2024 & 2032
- Figure 74: South America Tea Market Volume Share (%), by Form 2024 & 2032
- Figure 75: South America Tea Market Revenue (Million), by Product Type 2024 & 2032
- Figure 76: South America Tea Market Volume (K Tons), by Product Type 2024 & 2032
- Figure 77: South America Tea Market Revenue Share (%), by Product Type 2024 & 2032
- Figure 78: South America Tea Market Volume Share (%), by Product Type 2024 & 2032
- Figure 79: South America Tea Market Revenue (Million), by Distribution Channel 2024 & 2032
- Figure 80: South America Tea Market Volume (K Tons), by Distribution Channel 2024 & 2032
- Figure 81: South America Tea Market Revenue Share (%), by Distribution Channel 2024 & 2032
- Figure 82: South America Tea Market Volume Share (%), by Distribution Channel 2024 & 2032
- Figure 83: South America Tea Market Revenue (Million), by Country 2024 & 2032
- Figure 84: South America Tea Market Volume (K Tons), by Country 2024 & 2032
- Figure 85: South America Tea Market Revenue Share (%), by Country 2024 & 2032
- Figure 86: South America Tea Market Volume Share (%), by Country 2024 & 2032
- Figure 87: Middle East and Africa Tea Market Revenue (Million), by Form 2024 & 2032
- Figure 88: Middle East and Africa Tea Market Volume (K Tons), by Form 2024 & 2032
- Figure 89: Middle East and Africa Tea Market Revenue Share (%), by Form 2024 & 2032
- Figure 90: Middle East and Africa Tea Market Volume Share (%), by Form 2024 & 2032
- Figure 91: Middle East and Africa Tea Market Revenue (Million), by Product Type 2024 & 2032
- Figure 92: Middle East and Africa Tea Market Volume (K Tons), by Product Type 2024 & 2032
- Figure 93: Middle East and Africa Tea Market Revenue Share (%), by Product Type 2024 & 2032
- Figure 94: Middle East and Africa Tea Market Volume Share (%), by Product Type 2024 & 2032
- Figure 95: Middle East and Africa Tea Market Revenue (Million), by Distribution Channel 2024 & 2032
- Figure 96: Middle East and Africa Tea Market Volume (K Tons), by Distribution Channel 2024 & 2032
- Figure 97: Middle East and Africa Tea Market Revenue Share (%), by Distribution Channel 2024 & 2032
- Figure 98: Middle East and Africa Tea Market Volume Share (%), by Distribution Channel 2024 & 2032
- Figure 99: Middle East and Africa Tea Market Revenue (Million), by Country 2024 & 2032
- Figure 100: Middle East and Africa Tea Market Volume (K Tons), by Country 2024 & 2032
- Figure 101: Middle East and Africa Tea Market Revenue Share (%), by Country 2024 & 2032
- Figure 102: Middle East and Africa Tea Market Volume Share (%), by Country 2024 & 2032
List of Tables
- Table 1: Global Tea Market Revenue Million Forecast, by Region 2019 & 2032
- Table 2: Global Tea Market Volume K Tons Forecast, by Region 2019 & 2032
- Table 3: Global Tea Market Revenue Million Forecast, by Form 2019 & 2032
- Table 4: Global Tea Market Volume K Tons Forecast, by Form 2019 & 2032
- Table 5: Global Tea Market Revenue Million Forecast, by Product Type 2019 & 2032
- Table 6: Global Tea Market Volume K Tons Forecast, by Product Type 2019 & 2032
- Table 7: Global Tea Market Revenue Million Forecast, by Distribution Channel 2019 & 2032
- Table 8: Global Tea Market Volume K Tons Forecast, by Distribution Channel 2019 & 2032
- Table 9: Global Tea Market Revenue Million Forecast, by Region 2019 & 2032
- Table 10: Global Tea Market Volume K Tons Forecast, by Region 2019 & 2032
- Table 11: Global Tea Market Revenue Million Forecast, by Country 2019 & 2032
- Table 12: Global Tea Market Volume K Tons Forecast, by Country 2019 & 2032
- Table 13: United States Tea Market Revenue (Million) Forecast, by Application 2019 & 2032
- Table 14: United States Tea Market Volume (K Tons) Forecast, by Application 2019 & 2032
- Table 15: Canada Tea Market Revenue (Million) Forecast, by Application 2019 & 2032
- Table 16: Canada Tea Market Volume (K Tons) Forecast, by Application 2019 & 2032
- Table 17: Mexico Tea Market Revenue (Million) Forecast, by Application 2019 & 2032
- Table 18: Mexico Tea Market Volume (K Tons) Forecast, by Application 2019 & 2032
- Table 19: Rest of North America Tea Market Revenue (Million) Forecast, by Application 2019 & 2032
- Table 20: Rest of North America Tea Market Volume (K Tons) Forecast, by Application 2019 & 2032
- Table 21: Global Tea Market Revenue Million Forecast, by Country 2019 & 2032
- Table 22: Global Tea Market Volume K Tons Forecast, by Country 2019 & 2032
- Table 23: United Kingdom Tea Market Revenue (Million) Forecast, by Application 2019 & 2032
- Table 24: United Kingdom Tea Market Volume (K Tons) Forecast, by Application 2019 & 2032
- Table 25: Germany Tea Market Revenue (Million) Forecast, by Application 2019 & 2032
- Table 26: Germany Tea Market Volume (K Tons) Forecast, by Application 2019 & 2032
- Table 27: France Tea Market Revenue (Million) Forecast, by Application 2019 & 2032
- Table 28: France Tea Market Volume (K Tons) Forecast, by Application 2019 & 2032
- Table 29: Spain Tea Market Revenue (Million) Forecast, by Application 2019 & 2032
- Table 30: Spain Tea Market Volume (K Tons) Forecast, by Application 2019 & 2032
- Table 31: Italy Tea Market Revenue (Million) Forecast, by Application 2019 & 2032
- Table 32: Italy Tea Market Volume (K Tons) Forecast, by Application 2019 & 2032
- Table 33: Russia Tea Market Revenue (Million) Forecast, by Application 2019 & 2032
- Table 34: Russia Tea Market Volume (K Tons) Forecast, by Application 2019 & 2032
- Table 35: Rest of Europe Tea Market Revenue (Million) Forecast, by Application 2019 & 2032
- Table 36: Rest of Europe Tea Market Volume (K Tons) Forecast, by Application 2019 & 2032
- Table 37: Global Tea Market Revenue Million Forecast, by Country 2019 & 2032
- Table 38: Global Tea Market Volume K Tons Forecast, by Country 2019 & 2032
- Table 39: China Tea Market Revenue (Million) Forecast, by Application 2019 & 2032
- Table 40: China Tea Market Volume (K Tons) Forecast, by Application 2019 & 2032
- Table 41: Japan Tea Market Revenue (Million) Forecast, by Application 2019 & 2032
- Table 42: Japan Tea Market Volume (K Tons) Forecast, by Application 2019 & 2032
- Table 43: India Tea Market Revenue (Million) Forecast, by Application 2019 & 2032
- Table 44: India Tea Market Volume (K Tons) Forecast, by Application 2019 & 2032
- Table 45: Australia Tea Market Revenue (Million) Forecast, by Application 2019 & 2032
- Table 46: Australia Tea Market Volume (K Tons) Forecast, by Application 2019 & 2032
- Table 47: Rest of Asia Pacific Tea Market Revenue (Million) Forecast, by Application 2019 & 2032
- Table 48: Rest of Asia Pacific Tea Market Volume (K Tons) Forecast, by Application 2019 & 2032
- Table 49: Global Tea Market Revenue Million Forecast, by Country 2019 & 2032
- Table 50: Global Tea Market Volume K Tons Forecast, by Country 2019 & 2032
- Table 51: Brazil Tea Market Revenue (Million) Forecast, by Application 2019 & 2032
- Table 52: Brazil Tea Market Volume (K Tons) Forecast, by Application 2019 & 2032
- Table 53: Argentina Tea Market Revenue (Million) Forecast, by Application 2019 & 2032
- Table 54: Argentina Tea Market Volume (K Tons) Forecast, by Application 2019 & 2032
- Table 55: Rest of South America Tea Market Revenue (Million) Forecast, by Application 2019 & 2032
- Table 56: Rest of South America Tea Market Volume (K Tons) Forecast, by Application 2019 & 2032
- Table 57: Global Tea Market Revenue Million Forecast, by Country 2019 & 2032
- Table 58: Global Tea Market Volume K Tons Forecast, by Country 2019 & 2032
- Table 59: South Africa Tea Market Revenue (Million) Forecast, by Application 2019 & 2032
- Table 60: South Africa Tea Market Volume (K Tons) Forecast, by Application 2019 & 2032
- Table 61: United Arab Emirates Tea Market Revenue (Million) Forecast, by Application 2019 & 2032
- Table 62: United Arab Emirates Tea Market Volume (K Tons) Forecast, by Application 2019 & 2032
- Table 63: Rest of Middle East and Africa Tea Market Revenue (Million) Forecast, by Application 2019 & 2032
- Table 64: Rest of Middle East and Africa Tea Market Volume (K Tons) Forecast, by Application 2019 & 2032
- Table 65: Global Tea Market Revenue Million Forecast, by Form 2019 & 2032
- Table 66: Global Tea Market Volume K Tons Forecast, by Form 2019 & 2032
- Table 67: Global Tea Market Revenue Million Forecast, by Product Type 2019 & 2032
- Table 68: Global Tea Market Volume K Tons Forecast, by Product Type 2019 & 2032
- Table 69: Global Tea Market Revenue Million Forecast, by Distribution Channel 2019 & 2032
- Table 70: Global Tea Market Volume K Tons Forecast, by Distribution Channel 2019 & 2032
- Table 71: Global Tea Market Revenue Million Forecast, by Country 2019 & 2032
- Table 72: Global Tea Market Volume K Tons Forecast, by Country 2019 & 2032
- Table 73: United States Tea Market Revenue (Million) Forecast, by Application 2019 & 2032
- Table 74: United States Tea Market Volume (K Tons) Forecast, by Application 2019 & 2032
- Table 75: Canada Tea Market Revenue (Million) Forecast, by Application 2019 & 2032
- Table 76: Canada Tea Market Volume (K Tons) Forecast, by Application 2019 & 2032
- Table 77: Mexico Tea Market Revenue (Million) Forecast, by Application 2019 & 2032
- Table 78: Mexico Tea Market Volume (K Tons) Forecast, by Application 2019 & 2032
- Table 79: Rest of North America Tea Market Revenue (Million) Forecast, by Application 2019 & 2032
- Table 80: Rest of North America Tea Market Volume (K Tons) Forecast, by Application 2019 & 2032
- Table 81: Global Tea Market Revenue Million Forecast, by Form 2019 & 2032
- Table 82: Global Tea Market Volume K Tons Forecast, by Form 2019 & 2032
- Table 83: Global Tea Market Revenue Million Forecast, by Product Type 2019 & 2032
- Table 84: Global Tea Market Volume K Tons Forecast, by Product Type 2019 & 2032
- Table 85: Global Tea Market Revenue Million Forecast, by Distribution Channel 2019 & 2032
- Table 86: Global Tea Market Volume K Tons Forecast, by Distribution Channel 2019 & 2032
- Table 87: Global Tea Market Revenue Million Forecast, by Country 2019 & 2032
- Table 88: Global Tea Market Volume K Tons Forecast, by Country 2019 & 2032
- Table 89: United Kingdom Tea Market Revenue (Million) Forecast, by Application 2019 & 2032
- Table 90: United Kingdom Tea Market Volume (K Tons) Forecast, by Application 2019 & 2032
- Table 91: Germany Tea Market Revenue (Million) Forecast, by Application 2019 & 2032
- Table 92: Germany Tea Market Volume (K Tons) Forecast, by Application 2019 & 2032
- Table 93: France Tea Market Revenue (Million) Forecast, by Application 2019 & 2032
- Table 94: France Tea Market Volume (K Tons) Forecast, by Application 2019 & 2032
- Table 95: Spain Tea Market Revenue (Million) Forecast, by Application 2019 & 2032
- Table 96: Spain Tea Market Volume (K Tons) Forecast, by Application 2019 & 2032
- Table 97: Italy Tea Market Revenue (Million) Forecast, by Application 2019 & 2032
- Table 98: Italy Tea Market Volume (K Tons) Forecast, by Application 2019 & 2032
- Table 99: Russia Tea Market Revenue (Million) Forecast, by Application 2019 & 2032
- Table 100: Russia Tea Market Volume (K Tons) Forecast, by Application 2019 & 2032
- Table 101: Rest of Europe Tea Market Revenue (Million) Forecast, by Application 2019 & 2032
- Table 102: Rest of Europe Tea Market Volume (K Tons) Forecast, by Application 2019 & 2032
- Table 103: Global Tea Market Revenue Million Forecast, by Form 2019 & 2032
- Table 104: Global Tea Market Volume K Tons Forecast, by Form 2019 & 2032
- Table 105: Global Tea Market Revenue Million Forecast, by Product Type 2019 & 2032
- Table 106: Global Tea Market Volume K Tons Forecast, by Product Type 2019 & 2032
- Table 107: Global Tea Market Revenue Million Forecast, by Distribution Channel 2019 & 2032
- Table 108: Global Tea Market Volume K Tons Forecast, by Distribution Channel 2019 & 2032
- Table 109: Global Tea Market Revenue Million Forecast, by Country 2019 & 2032
- Table 110: Global Tea Market Volume K Tons Forecast, by Country 2019 & 2032
- Table 111: China Tea Market Revenue (Million) Forecast, by Application 2019 & 2032
- Table 112: China Tea Market Volume (K Tons) Forecast, by Application 2019 & 2032
- Table 113: Japan Tea Market Revenue (Million) Forecast, by Application 2019 & 2032
- Table 114: Japan Tea Market Volume (K Tons) Forecast, by Application 2019 & 2032
- Table 115: India Tea Market Revenue (Million) Forecast, by Application 2019 & 2032
- Table 116: India Tea Market Volume (K Tons) Forecast, by Application 2019 & 2032
- Table 117: Australia Tea Market Revenue (Million) Forecast, by Application 2019 & 2032
- Table 118: Australia Tea Market Volume (K Tons) Forecast, by Application 2019 & 2032
- Table 119: Rest of Asia Pacific Tea Market Revenue (Million) Forecast, by Application 2019 & 2032
- Table 120: Rest of Asia Pacific Tea Market Volume (K Tons) Forecast, by Application 2019 & 2032
- Table 121: Global Tea Market Revenue Million Forecast, by Form 2019 & 2032
- Table 122: Global Tea Market Volume K Tons Forecast, by Form 2019 & 2032
- Table 123: Global Tea Market Revenue Million Forecast, by Product Type 2019 & 2032
- Table 124: Global Tea Market Volume K Tons Forecast, by Product Type 2019 & 2032
- Table 125: Global Tea Market Revenue Million Forecast, by Distribution Channel 2019 & 2032
- Table 126: Global Tea Market Volume K Tons Forecast, by Distribution Channel 2019 & 2032
- Table 127: Global Tea Market Revenue Million Forecast, by Country 2019 & 2032
- Table 128: Global Tea Market Volume K Tons Forecast, by Country 2019 & 2032
- Table 129: Brazil Tea Market Revenue (Million) Forecast, by Application 2019 & 2032
- Table 130: Brazil Tea Market Volume (K Tons) Forecast, by Application 2019 & 2032
- Table 131: Argentina Tea Market Revenue (Million) Forecast, by Application 2019 & 2032
- Table 132: Argentina Tea Market Volume (K Tons) Forecast, by Application 2019 & 2032
- Table 133: Rest of South America Tea Market Revenue (Million) Forecast, by Application 2019 & 2032
- Table 134: Rest of South America Tea Market Volume (K Tons) Forecast, by Application 2019 & 2032
- Table 135: Global Tea Market Revenue Million Forecast, by Form 2019 & 2032
- Table 136: Global Tea Market Volume K Tons Forecast, by Form 2019 & 2032
- Table 137: Global Tea Market Revenue Million Forecast, by Product Type 2019 & 2032
- Table 138: Global Tea Market Volume K Tons Forecast, by Product Type 2019 & 2032
- Table 139: Global Tea Market Revenue Million Forecast, by Distribution Channel 2019 & 2032
- Table 140: Global Tea Market Volume K Tons Forecast, by Distribution Channel 2019 & 2032
- Table 141: Global Tea Market Revenue Million Forecast, by Country 2019 & 2032
- Table 142: Global Tea Market Volume K Tons Forecast, by Country 2019 & 2032
- Table 143: South Africa Tea Market Revenue (Million) Forecast, by Application 2019 & 2032
- Table 144: South Africa Tea Market Volume (K Tons) Forecast, by Application 2019 & 2032
- Table 145: United Arab Emirates Tea Market Revenue (Million) Forecast, by Application 2019 & 2032
- Table 146: United Arab Emirates Tea Market Volume (K Tons) Forecast, by Application 2019 & 2032
- Table 147: Rest of Middle East and Africa Tea Market Revenue (Million) Forecast, by Application 2019 & 2032
- Table 148: Rest of Middle East and Africa Tea Market Volume (K Tons) Forecast, by Application 2019 & 2032
Frequently Asked Questions
1. What is the projected Compound Annual Growth Rate (CAGR) of the Tea Market?
The projected CAGR is approximately 5.72%.
2. Which companies are prominent players in the Tea Market?
Key companies in the market include Reily Foods Company (Luzianne), Ekaterra Company (Lipton Tea Red Label PG Tips TAZO Pukka Herbs and T2), RC Bigelow Inc (Bigelow Tea), Apeejay Surrendra Group (Apeejay Tea and Typhoo India Tea), Dabur India Limited (Dabur Tea), Yogi Tea (Yogi Tea), Bettys & Taylors of Harrogate Limited (Taylors of Harrogate Bettys and Yorkshire Tea), Associated British Foods PLC (Twinings), Clipper Tea Company (Clipper Tea), Hain Celestial Group (Celestial Seasonings), Tata Group (Tata Tea Tetley Good Earth Teapigs Vitax and Joekels).
3. What are the main segments of the Tea Market?
The market segments include Form, Product Type, Distribution Channel.
4. Can you provide details about the market size?
The market size is estimated to be USD XX Million as of 2022.
5. What are some drivers contributing to market growth?
Increasing Demand for Herbal Teas; Increasing Consumer Awareness about Health Benefits of Tea.
6. What are the notable trends driving market growth?
Health Benefits of Tea is Propelling the Market Growth.
7. Are there any restraints impacting market growth?
High Cost of Production of Green Tea.
8. Can you provide examples of recent developments in the market?
November 2022: Dabur India Limited launched Dabur Vedic Tea, a premium black tea that contains 30+ ayurvedic herbs that provide health benefits and boosts immunity. The product contains herbs like Tulsi, Ginger, Cardamom, and others.
9. What pricing options are available for accessing the report?
Pricing options include single-user, multi-user, and enterprise licenses priced at USD 4750, USD 5250, and USD 8750 respectively.
10. Is the market size provided in terms of value or volume?
The market size is provided in terms of value, measured in Million and volume, measured in K Tons.
11. Are there any specific market keywords associated with the report?
Yes, the market keyword associated with the report is "Tea Market," which aids in identifying and referencing the specific market segment covered.
12. How do I determine which pricing option suits my needs best?
The pricing options vary based on user requirements and access needs. Individual users may opt for single-user licenses, while businesses requiring broader access may choose multi-user or enterprise licenses for cost-effective access to the report.
13. Are there any additional resources or data provided in the Tea Market report?
While the report offers comprehensive insights, it's advisable to review the specific contents or supplementary materials provided to ascertain if additional resources or data are available.
14. How can I stay updated on further developments or reports in the Tea Market?
To stay informed about further developments, trends, and reports in the Tea Market, consider subscribing to industry newsletters, following relevant companies and organizations, or regularly checking reputable industry news sources and publications.
Methodology
Step 1 - Identification of Relevant Samples Size from Population Database


Step 2 - Approaches for Defining Global Market Size (Value, Volume* & Price*)

Note*: In applicable scenarios
Step 3 - Data Sources
Primary Research
- Web Analytics
- Survey Reports
- Research Institute
- Latest Research Reports
- Opinion Leaders
Secondary Research
- Annual Reports
- White Paper
- Latest Press Release
- Industry Association
- Paid Database
- Investor Presentations

Step 4 - Data Triangulation
Involves using different sources of information in order to increase the validity of a study
These sources are likely to be stakeholders in a program - participants, other researchers, program staff, other community members, and so on.
Then we put all data in single framework & apply various statistical tools to find out the dynamic on the market.
During the analysis stage, feedback from the stakeholder groups would be compared to determine areas of agreement as well as areas of divergence
