

Key Insights
The Tozinameran market, encompassing the mRNA-based COVID-19 vaccine initially developed by BioNTech and Pfizer, experienced explosive growth following its emergency authorization in late 2020. While precise figures for the historical period (2019-2024) aren't provided, the market's initial phase saw unprecedented demand driven by the global pandemic. The subsequent years, however, witnessed a shift from emergency procurement to a more normalized vaccination landscape. Factors like waning pandemic severity, high initial vaccination rates in many countries, and the emergence of new variants influenced the market trajectory. Despite a decline in overall demand, the market continues to be fueled by booster shot campaigns, expanding indications (e.g., adapted vaccines for new variants), and growing demand in underserved regions. The competitive landscape remains robust, with companies like Moderna, Novavax, and others contributing to the overall market size, although BioNTech/Pfizer retains a significant market share due to its early mover advantage and established distribution networks. The long-term outlook for Tozinameran (and mRNA vaccines in general) is projected to involve a transition toward a more stable, albeit smaller, market compared to peak pandemic demand. This stability relies on factors such as consistent booster campaigns and the potential for mRNA vaccines to be effectively utilized against future viral threats.
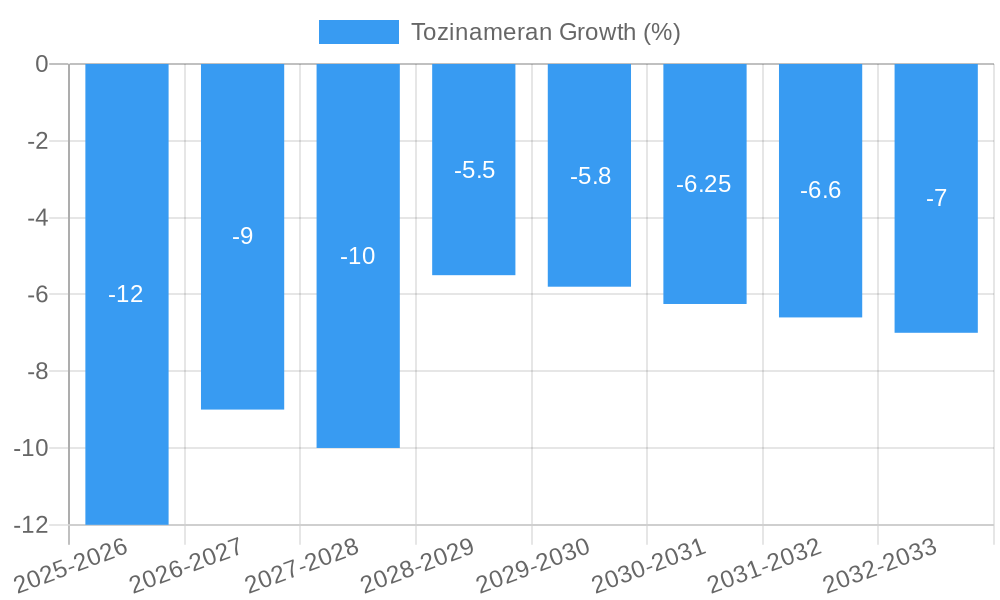
The future market will likely see a gradual decline in the overall value due to reduced initial demand but steady growth fueled by booster programs and ongoing vaccination efforts in developing nations. The market size in 2025 is estimated to be in the multi-billion dollar range, with ongoing development and regulatory approvals for updated vaccines and potential use against other viral diseases contributing to its sustained existence. This involves strategic partnerships, investment in production capacity, and the continuing research and development of next-generation mRNA vaccine platforms.
Tozinameran Market Report: A Comprehensive Analysis (2019-2033)
This comprehensive report provides an in-depth analysis of the Tozinameran market, encompassing market dynamics, growth trends, regional dominance, product landscape, key players, and future outlook. With a study period spanning 2019-2033, a base year of 2025, and a forecast period of 2025-2033, this report is an essential resource for industry professionals, investors, and strategic decision-makers. The report leverages rigorous data analysis and expert insights to deliver actionable intelligence on this dynamic market.
Tozinameran Market Dynamics & Structure
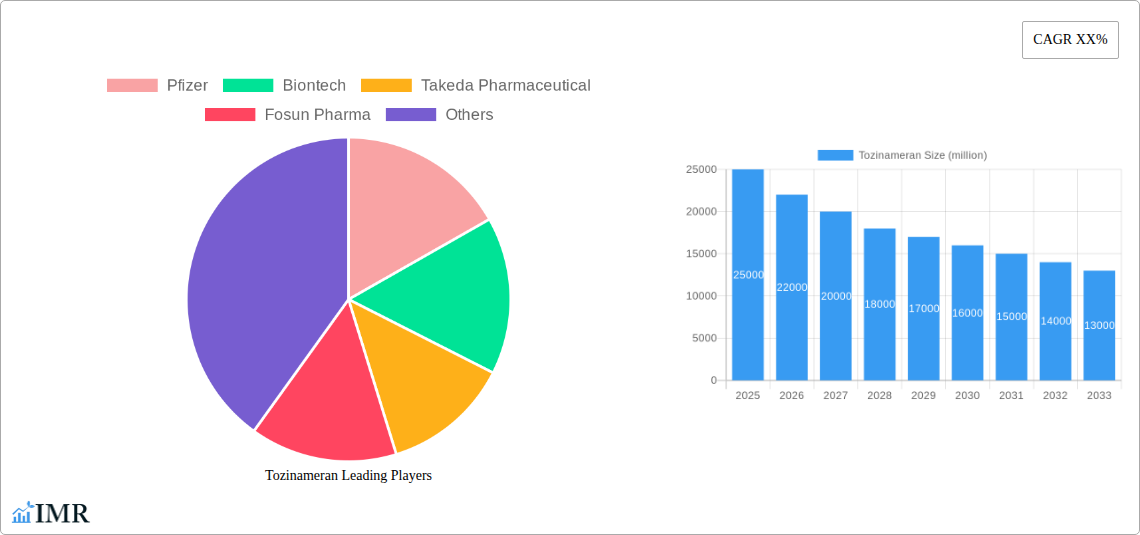
This section analyzes the Tozinameran market's competitive landscape, technological advancements, regulatory environment, and market forces. The market is characterized by a high degree of concentration, with key players like Pfizer and BioNTech holding significant market share. However, the entry of other players like Takeda Pharmaceutical and Fosun Pharma is increasing competition.
- Market Concentration: In 2025, Pfizer and BioNTech together held an estimated 70% market share, while Takeda and Fosun Pharma combined held approximately 15%. The remaining 15% is distributed among smaller players and regional manufacturers.
- Technological Innovation: Ongoing research focuses on improving Tozinameran's efficacy, safety, and ease of administration. This includes exploring next-generation mRNA technologies and combination therapies.
- Regulatory Framework: Stringent regulatory approvals and post-market surveillance are crucial for Tozinameran's continued success. Variations in regulatory pathways across regions influence market access and pricing strategies.
- Competitive Substitutes: The emergence of alternative vaccines and therapeutics presents a competitive challenge. However, Tozinameran's established efficacy profile and widespread adoption provide a strong competitive advantage.
- M&A Trends: The Tozinameran market has witnessed several significant mergers and acquisitions in recent years. The total value of M&A deals during the historical period (2019-2024) is estimated at xx million USD. This signifies increasing consolidation in the market.
- End-User Demographics: The primary end-users are healthcare systems and governments worldwide, with market demand heavily influenced by vaccination programs and pandemic preparedness initiatives.
Tozinameran Growth Trends & Insights
The Tozinameran market experienced significant growth during the historical period (2019-2024), driven by the global pandemic. The market size reached an estimated xx million units in 2024. The adoption rate was exceptionally high in 2020 and 2021 but has plateaued since then due to decreased infection rates and high vaccination coverage in many regions. However, continued demand is projected based on booster programs and broader vaccination initiatives. The compound annual growth rate (CAGR) is projected to be xx% during the forecast period (2025-2033), reaching an estimated market size of xx million units by 2033. This growth will be influenced by factors like emerging variants and government initiatives.
Dominant Regions, Countries, or Segments in Tozinameran
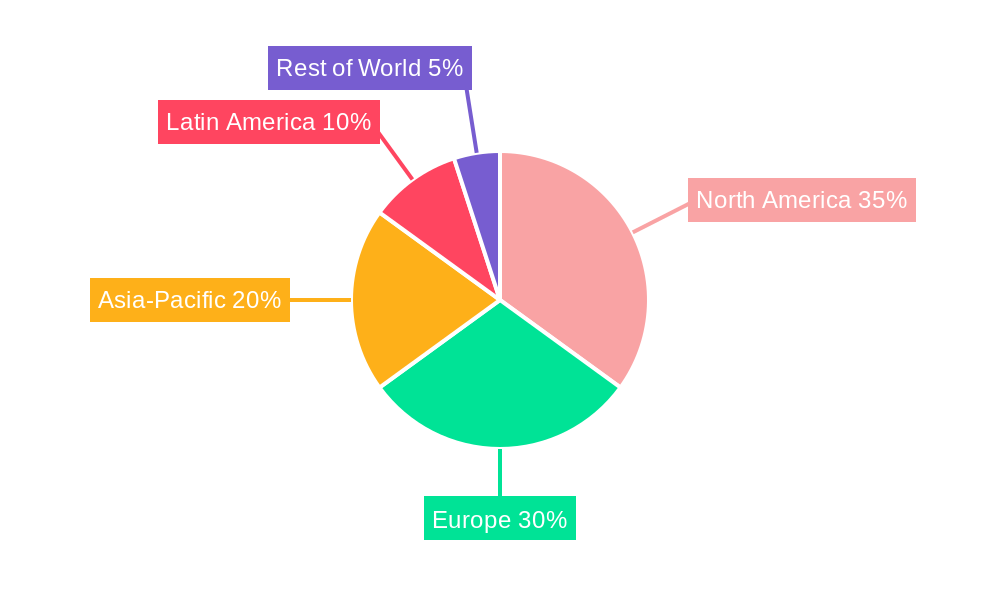
The North American region has consistently been the largest market for Tozinameran, followed by Europe. These regions experienced early and widespread vaccine rollout programs. The high adoption rates and strong healthcare infrastructure in these regions have contributed to their market dominance.
- North America: High per capita income, advanced healthcare infrastructure, and early adoption of vaccination campaigns fueled significant market growth. Government initiatives such as Operation Warp Speed and other funding programs played a pivotal role.
- Europe: Similar to North America, the European market witnessed high demand driven by effective vaccination rollout strategies and strong healthcare systems. However, market penetration varied across member states due to different policies and access levels.
- Asia-Pacific: The Asia-Pacific region shows significant growth potential but faces challenges related to infrastructure, healthcare access, and vaccine hesitancy in some areas. However, increasing government investments and evolving healthcare infrastructure are driving market expansion.
Tozinameran Product Landscape
Tozinameran is an mRNA vaccine delivered via intramuscular injection, known for its high efficacy in preventing COVID-19. Recent technological advancements focus on improving its stability, ease of administration, and tailoring it for specific variants. This includes developments in the manufacturing process to increase production capacity and exploring new formulations that might simplify the cold-chain requirements for broader global accessibility.
Key Drivers, Barriers & Challenges in Tozinameran
Key Drivers: The primary drivers include the ongoing need for COVID-19 vaccination, government initiatives promoting public health, technological advancements enhancing vaccine efficacy and safety, and strategic partnerships driving production and distribution.
Key Challenges: Challenges include the emergence of new viral variants requiring updated vaccine formulations, competition from alternative vaccines and therapeutics, concerns regarding vaccine safety and efficacy, and potential supply chain disruptions impacting global distribution. The cost of manufacturing and distribution also remains a considerable factor, impacting access in certain regions. These challenges collectively impact market growth and expansion.
Emerging Opportunities in Tozinameran
Emerging opportunities include the development of next-generation mRNA vaccines targeting new viral variants or even influenza strains. The exploration of combination vaccines incorporating Tozinameran technology with other vaccines could be particularly impactful. Furthermore, expanding into emerging markets with increasing vaccination campaigns presents significant growth potential. The development of convenient administration methods like nasal sprays could also increase uptake.
Growth Accelerators in the Tozinameran Industry
Long-term growth will be driven by continuous technological advancements improving vaccine efficacy and longevity, strategic partnerships and investments in manufacturing capacity, and expanding market access in underserved regions. Government policies promoting vaccination and public health initiatives will also play a crucial role.
Key Players Shaping the Tozinameran Market
Notable Milestones in Tozinameran Sector
- December 2020: Emergency Use Authorization (EUA) granted by the FDA for Tozinameran in the USA.
- January 2021: Tozinameran rollout begins in several countries across Europe.
- March 2021: Expanded EUA for Tozinameran granted, including adolescents.
- Ongoing: Continuous development of variant-specific Tozinameran formulations.
In-Depth Tozinameran Market Outlook
The Tozinameran market is poised for continued growth, albeit at a slower pace than during the peak pandemic years. Continued demand for booster shots, potential for future pandemics, and the application of mRNA technology in other vaccines will contribute to sustained market growth. Strategic partnerships and investments in manufacturing infrastructure will be key to ensuring sufficient supply and global access. The focus on innovative applications of mRNA technology will significantly shape the market's long-term trajectory.
Tozinameran Segmentation
-
1. Application
- 1.1. Hospital
- 1.2. Clinic
- 1.3. Other
-
2. Types
- 2.1. Teenagers
- 2.2. Adult
Tozinameran Segmentation By Geography
-
1. North America
- 1.1. United States
- 1.2. Canada
- 1.3. Mexico
-
2. South America
- 2.1. Brazil
- 2.2. Argentina
- 2.3. Rest of South America
-
3. Europe
- 3.1. United Kingdom
- 3.2. Germany
- 3.3. France
- 3.4. Italy
- 3.5. Spain
- 3.6. Russia
- 3.7. Benelux
- 3.8. Nordics
- 3.9. Rest of Europe
-
4. Middle East & Africa
- 4.1. Turkey
- 4.2. Israel
- 4.3. GCC
- 4.4. North Africa
- 4.5. South Africa
- 4.6. Rest of Middle East & Africa
-
5. Asia Pacific
- 5.1. China
- 5.2. India
- 5.3. Japan
- 5.4. South Korea
- 5.5. ASEAN
- 5.6. Oceania
- 5.7. Rest of Asia Pacific
Tozinameran REPORT HIGHLIGHTS
| Aspects | Details |
|---|---|
| Study Period | 2019-2033 |
| Base Year | 2024 |
| Estimated Year | 2025 |
| Forecast Period | 2025-2033 |
| Historical Period | 2019-2024 |
| Growth Rate | CAGR of XX% from 2019-2033 |
| Segmentation |
|
Table of Contents
- 1. Introduction
- 1.1. Research Scope
- 1.2. Market Segmentation
- 1.3. Research Methodology
- 1.4. Definitions and Assumptions
- 2. Executive Summary
- 2.1. Introduction
- 3. Market Dynamics
- 3.1. Introduction
- 3.2. Market Drivers
- 3.3. Market Restrains
- 3.4. Market Trends
- 4. Market Factor Analysis
- 4.1. Porters Five Forces
- 4.2. Supply/Value Chain
- 4.3. PESTEL analysis
- 4.4. Market Entropy
- 4.5. Patent/Trademark Analysis
- 5. Global Tozinameran Analysis, Insights and Forecast, 2019-2031
- 5.1. Market Analysis, Insights and Forecast - by Application
- 5.1.1. Hospital
- 5.1.2. Clinic
- 5.1.3. Other
- 5.2. Market Analysis, Insights and Forecast - by Types
- 5.2.1. Teenagers
- 5.2.2. Adult
- 5.3. Market Analysis, Insights and Forecast - by Region
- 5.3.1. North America
- 5.3.2. South America
- 5.3.3. Europe
- 5.3.4. Middle East & Africa
- 5.3.5. Asia Pacific
- 5.1. Market Analysis, Insights and Forecast - by Application
- 6. North America Tozinameran Analysis, Insights and Forecast, 2019-2031
- 6.1. Market Analysis, Insights and Forecast - by Application
- 6.1.1. Hospital
- 6.1.2. Clinic
- 6.1.3. Other
- 6.2. Market Analysis, Insights and Forecast - by Types
- 6.2.1. Teenagers
- 6.2.2. Adult
- 6.1. Market Analysis, Insights and Forecast - by Application
- 7. South America Tozinameran Analysis, Insights and Forecast, 2019-2031
- 7.1. Market Analysis, Insights and Forecast - by Application
- 7.1.1. Hospital
- 7.1.2. Clinic
- 7.1.3. Other
- 7.2. Market Analysis, Insights and Forecast - by Types
- 7.2.1. Teenagers
- 7.2.2. Adult
- 7.1. Market Analysis, Insights and Forecast - by Application
- 8. Europe Tozinameran Analysis, Insights and Forecast, 2019-2031
- 8.1. Market Analysis, Insights and Forecast - by Application
- 8.1.1. Hospital
- 8.1.2. Clinic
- 8.1.3. Other
- 8.2. Market Analysis, Insights and Forecast - by Types
- 8.2.1. Teenagers
- 8.2.2. Adult
- 8.1. Market Analysis, Insights and Forecast - by Application
- 9. Middle East & Africa Tozinameran Analysis, Insights and Forecast, 2019-2031
- 9.1. Market Analysis, Insights and Forecast - by Application
- 9.1.1. Hospital
- 9.1.2. Clinic
- 9.1.3. Other
- 9.2. Market Analysis, Insights and Forecast - by Types
- 9.2.1. Teenagers
- 9.2.2. Adult
- 9.1. Market Analysis, Insights and Forecast - by Application
- 10. Asia Pacific Tozinameran Analysis, Insights and Forecast, 2019-2031
- 10.1. Market Analysis, Insights and Forecast - by Application
- 10.1.1. Hospital
- 10.1.2. Clinic
- 10.1.3. Other
- 10.2. Market Analysis, Insights and Forecast - by Types
- 10.2.1. Teenagers
- 10.2.2. Adult
- 10.1. Market Analysis, Insights and Forecast - by Application
- 11. Competitive Analysis
- 11.1. Global Market Share Analysis 2024
- 11.2. Company Profiles
- 11.2.1 Pfizer
- 11.2.1.1. Overview
- 11.2.1.2. Products
- 11.2.1.3. SWOT Analysis
- 11.2.1.4. Recent Developments
- 11.2.1.5. Financials (Based on Availability)
- 11.2.2 Biontech
- 11.2.2.1. Overview
- 11.2.2.2. Products
- 11.2.2.3. SWOT Analysis
- 11.2.2.4. Recent Developments
- 11.2.2.5. Financials (Based on Availability)
- 11.2.3 Takeda Pharmaceutical
- 11.2.3.1. Overview
- 11.2.3.2. Products
- 11.2.3.3. SWOT Analysis
- 11.2.3.4. Recent Developments
- 11.2.3.5. Financials (Based on Availability)
- 11.2.4 Fosun Pharma
- 11.2.4.1. Overview
- 11.2.4.2. Products
- 11.2.4.3. SWOT Analysis
- 11.2.4.4. Recent Developments
- 11.2.4.5. Financials (Based on Availability)
- 11.2.1 Pfizer
List of Figures
- Figure 1: Global Tozinameran Revenue Breakdown (million, %) by Region 2024 & 2032
- Figure 2: Global Tozinameran Volume Breakdown (K, %) by Region 2024 & 2032
- Figure 3: North America Tozinameran Revenue (million), by Application 2024 & 2032
- Figure 4: North America Tozinameran Volume (K), by Application 2024 & 2032
- Figure 5: North America Tozinameran Revenue Share (%), by Application 2024 & 2032
- Figure 6: North America Tozinameran Volume Share (%), by Application 2024 & 2032
- Figure 7: North America Tozinameran Revenue (million), by Types 2024 & 2032
- Figure 8: North America Tozinameran Volume (K), by Types 2024 & 2032
- Figure 9: North America Tozinameran Revenue Share (%), by Types 2024 & 2032
- Figure 10: North America Tozinameran Volume Share (%), by Types 2024 & 2032
- Figure 11: North America Tozinameran Revenue (million), by Country 2024 & 2032
- Figure 12: North America Tozinameran Volume (K), by Country 2024 & 2032
- Figure 13: North America Tozinameran Revenue Share (%), by Country 2024 & 2032
- Figure 14: North America Tozinameran Volume Share (%), by Country 2024 & 2032
- Figure 15: South America Tozinameran Revenue (million), by Application 2024 & 2032
- Figure 16: South America Tozinameran Volume (K), by Application 2024 & 2032
- Figure 17: South America Tozinameran Revenue Share (%), by Application 2024 & 2032
- Figure 18: South America Tozinameran Volume Share (%), by Application 2024 & 2032
- Figure 19: South America Tozinameran Revenue (million), by Types 2024 & 2032
- Figure 20: South America Tozinameran Volume (K), by Types 2024 & 2032
- Figure 21: South America Tozinameran Revenue Share (%), by Types 2024 & 2032
- Figure 22: South America Tozinameran Volume Share (%), by Types 2024 & 2032
- Figure 23: South America Tozinameran Revenue (million), by Country 2024 & 2032
- Figure 24: South America Tozinameran Volume (K), by Country 2024 & 2032
- Figure 25: South America Tozinameran Revenue Share (%), by Country 2024 & 2032
- Figure 26: South America Tozinameran Volume Share (%), by Country 2024 & 2032
- Figure 27: Europe Tozinameran Revenue (million), by Application 2024 & 2032
- Figure 28: Europe Tozinameran Volume (K), by Application 2024 & 2032
- Figure 29: Europe Tozinameran Revenue Share (%), by Application 2024 & 2032
- Figure 30: Europe Tozinameran Volume Share (%), by Application 2024 & 2032
- Figure 31: Europe Tozinameran Revenue (million), by Types 2024 & 2032
- Figure 32: Europe Tozinameran Volume (K), by Types 2024 & 2032
- Figure 33: Europe Tozinameran Revenue Share (%), by Types 2024 & 2032
- Figure 34: Europe Tozinameran Volume Share (%), by Types 2024 & 2032
- Figure 35: Europe Tozinameran Revenue (million), by Country 2024 & 2032
- Figure 36: Europe Tozinameran Volume (K), by Country 2024 & 2032
- Figure 37: Europe Tozinameran Revenue Share (%), by Country 2024 & 2032
- Figure 38: Europe Tozinameran Volume Share (%), by Country 2024 & 2032
- Figure 39: Middle East & Africa Tozinameran Revenue (million), by Application 2024 & 2032
- Figure 40: Middle East & Africa Tozinameran Volume (K), by Application 2024 & 2032
- Figure 41: Middle East & Africa Tozinameran Revenue Share (%), by Application 2024 & 2032
- Figure 42: Middle East & Africa Tozinameran Volume Share (%), by Application 2024 & 2032
- Figure 43: Middle East & Africa Tozinameran Revenue (million), by Types 2024 & 2032
- Figure 44: Middle East & Africa Tozinameran Volume (K), by Types 2024 & 2032
- Figure 45: Middle East & Africa Tozinameran Revenue Share (%), by Types 2024 & 2032
- Figure 46: Middle East & Africa Tozinameran Volume Share (%), by Types 2024 & 2032
- Figure 47: Middle East & Africa Tozinameran Revenue (million), by Country 2024 & 2032
- Figure 48: Middle East & Africa Tozinameran Volume (K), by Country 2024 & 2032
- Figure 49: Middle East & Africa Tozinameran Revenue Share (%), by Country 2024 & 2032
- Figure 50: Middle East & Africa Tozinameran Volume Share (%), by Country 2024 & 2032
- Figure 51: Asia Pacific Tozinameran Revenue (million), by Application 2024 & 2032
- Figure 52: Asia Pacific Tozinameran Volume (K), by Application 2024 & 2032
- Figure 53: Asia Pacific Tozinameran Revenue Share (%), by Application 2024 & 2032
- Figure 54: Asia Pacific Tozinameran Volume Share (%), by Application 2024 & 2032
- Figure 55: Asia Pacific Tozinameran Revenue (million), by Types 2024 & 2032
- Figure 56: Asia Pacific Tozinameran Volume (K), by Types 2024 & 2032
- Figure 57: Asia Pacific Tozinameran Revenue Share (%), by Types 2024 & 2032
- Figure 58: Asia Pacific Tozinameran Volume Share (%), by Types 2024 & 2032
- Figure 59: Asia Pacific Tozinameran Revenue (million), by Country 2024 & 2032
- Figure 60: Asia Pacific Tozinameran Volume (K), by Country 2024 & 2032
- Figure 61: Asia Pacific Tozinameran Revenue Share (%), by Country 2024 & 2032
- Figure 62: Asia Pacific Tozinameran Volume Share (%), by Country 2024 & 2032
List of Tables
- Table 1: Global Tozinameran Revenue million Forecast, by Region 2019 & 2032
- Table 2: Global Tozinameran Volume K Forecast, by Region 2019 & 2032
- Table 3: Global Tozinameran Revenue million Forecast, by Application 2019 & 2032
- Table 4: Global Tozinameran Volume K Forecast, by Application 2019 & 2032
- Table 5: Global Tozinameran Revenue million Forecast, by Types 2019 & 2032
- Table 6: Global Tozinameran Volume K Forecast, by Types 2019 & 2032
- Table 7: Global Tozinameran Revenue million Forecast, by Region 2019 & 2032
- Table 8: Global Tozinameran Volume K Forecast, by Region 2019 & 2032
- Table 9: Global Tozinameran Revenue million Forecast, by Application 2019 & 2032
- Table 10: Global Tozinameran Volume K Forecast, by Application 2019 & 2032
- Table 11: Global Tozinameran Revenue million Forecast, by Types 2019 & 2032
- Table 12: Global Tozinameran Volume K Forecast, by Types 2019 & 2032
- Table 13: Global Tozinameran Revenue million Forecast, by Country 2019 & 2032
- Table 14: Global Tozinameran Volume K Forecast, by Country 2019 & 2032
- Table 15: United States Tozinameran Revenue (million) Forecast, by Application 2019 & 2032
- Table 16: United States Tozinameran Volume (K) Forecast, by Application 2019 & 2032
- Table 17: Canada Tozinameran Revenue (million) Forecast, by Application 2019 & 2032
- Table 18: Canada Tozinameran Volume (K) Forecast, by Application 2019 & 2032
- Table 19: Mexico Tozinameran Revenue (million) Forecast, by Application 2019 & 2032
- Table 20: Mexico Tozinameran Volume (K) Forecast, by Application 2019 & 2032
- Table 21: Global Tozinameran Revenue million Forecast, by Application 2019 & 2032
- Table 22: Global Tozinameran Volume K Forecast, by Application 2019 & 2032
- Table 23: Global Tozinameran Revenue million Forecast, by Types 2019 & 2032
- Table 24: Global Tozinameran Volume K Forecast, by Types 2019 & 2032
- Table 25: Global Tozinameran Revenue million Forecast, by Country 2019 & 2032
- Table 26: Global Tozinameran Volume K Forecast, by Country 2019 & 2032
- Table 27: Brazil Tozinameran Revenue (million) Forecast, by Application 2019 & 2032
- Table 28: Brazil Tozinameran Volume (K) Forecast, by Application 2019 & 2032
- Table 29: Argentina Tozinameran Revenue (million) Forecast, by Application 2019 & 2032
- Table 30: Argentina Tozinameran Volume (K) Forecast, by Application 2019 & 2032
- Table 31: Rest of South America Tozinameran Revenue (million) Forecast, by Application 2019 & 2032
- Table 32: Rest of South America Tozinameran Volume (K) Forecast, by Application 2019 & 2032
- Table 33: Global Tozinameran Revenue million Forecast, by Application 2019 & 2032
- Table 34: Global Tozinameran Volume K Forecast, by Application 2019 & 2032
- Table 35: Global Tozinameran Revenue million Forecast, by Types 2019 & 2032
- Table 36: Global Tozinameran Volume K Forecast, by Types 2019 & 2032
- Table 37: Global Tozinameran Revenue million Forecast, by Country 2019 & 2032
- Table 38: Global Tozinameran Volume K Forecast, by Country 2019 & 2032
- Table 39: United Kingdom Tozinameran Revenue (million) Forecast, by Application 2019 & 2032
- Table 40: United Kingdom Tozinameran Volume (K) Forecast, by Application 2019 & 2032
- Table 41: Germany Tozinameran Revenue (million) Forecast, by Application 2019 & 2032
- Table 42: Germany Tozinameran Volume (K) Forecast, by Application 2019 & 2032
- Table 43: France Tozinameran Revenue (million) Forecast, by Application 2019 & 2032
- Table 44: France Tozinameran Volume (K) Forecast, by Application 2019 & 2032
- Table 45: Italy Tozinameran Revenue (million) Forecast, by Application 2019 & 2032
- Table 46: Italy Tozinameran Volume (K) Forecast, by Application 2019 & 2032
- Table 47: Spain Tozinameran Revenue (million) Forecast, by Application 2019 & 2032
- Table 48: Spain Tozinameran Volume (K) Forecast, by Application 2019 & 2032
- Table 49: Russia Tozinameran Revenue (million) Forecast, by Application 2019 & 2032
- Table 50: Russia Tozinameran Volume (K) Forecast, by Application 2019 & 2032
- Table 51: Benelux Tozinameran Revenue (million) Forecast, by Application 2019 & 2032
- Table 52: Benelux Tozinameran Volume (K) Forecast, by Application 2019 & 2032
- Table 53: Nordics Tozinameran Revenue (million) Forecast, by Application 2019 & 2032
- Table 54: Nordics Tozinameran Volume (K) Forecast, by Application 2019 & 2032
- Table 55: Rest of Europe Tozinameran Revenue (million) Forecast, by Application 2019 & 2032
- Table 56: Rest of Europe Tozinameran Volume (K) Forecast, by Application 2019 & 2032
- Table 57: Global Tozinameran Revenue million Forecast, by Application 2019 & 2032
- Table 58: Global Tozinameran Volume K Forecast, by Application 2019 & 2032
- Table 59: Global Tozinameran Revenue million Forecast, by Types 2019 & 2032
- Table 60: Global Tozinameran Volume K Forecast, by Types 2019 & 2032
- Table 61: Global Tozinameran Revenue million Forecast, by Country 2019 & 2032
- Table 62: Global Tozinameran Volume K Forecast, by Country 2019 & 2032
- Table 63: Turkey Tozinameran Revenue (million) Forecast, by Application 2019 & 2032
- Table 64: Turkey Tozinameran Volume (K) Forecast, by Application 2019 & 2032
- Table 65: Israel Tozinameran Revenue (million) Forecast, by Application 2019 & 2032
- Table 66: Israel Tozinameran Volume (K) Forecast, by Application 2019 & 2032
- Table 67: GCC Tozinameran Revenue (million) Forecast, by Application 2019 & 2032
- Table 68: GCC Tozinameran Volume (K) Forecast, by Application 2019 & 2032
- Table 69: North Africa Tozinameran Revenue (million) Forecast, by Application 2019 & 2032
- Table 70: North Africa Tozinameran Volume (K) Forecast, by Application 2019 & 2032
- Table 71: South Africa Tozinameran Revenue (million) Forecast, by Application 2019 & 2032
- Table 72: South Africa Tozinameran Volume (K) Forecast, by Application 2019 & 2032
- Table 73: Rest of Middle East & Africa Tozinameran Revenue (million) Forecast, by Application 2019 & 2032
- Table 74: Rest of Middle East & Africa Tozinameran Volume (K) Forecast, by Application 2019 & 2032
- Table 75: Global Tozinameran Revenue million Forecast, by Application 2019 & 2032
- Table 76: Global Tozinameran Volume K Forecast, by Application 2019 & 2032
- Table 77: Global Tozinameran Revenue million Forecast, by Types 2019 & 2032
- Table 78: Global Tozinameran Volume K Forecast, by Types 2019 & 2032
- Table 79: Global Tozinameran Revenue million Forecast, by Country 2019 & 2032
- Table 80: Global Tozinameran Volume K Forecast, by Country 2019 & 2032
- Table 81: China Tozinameran Revenue (million) Forecast, by Application 2019 & 2032
- Table 82: China Tozinameran Volume (K) Forecast, by Application 2019 & 2032
- Table 83: India Tozinameran Revenue (million) Forecast, by Application 2019 & 2032
- Table 84: India Tozinameran Volume (K) Forecast, by Application 2019 & 2032
- Table 85: Japan Tozinameran Revenue (million) Forecast, by Application 2019 & 2032
- Table 86: Japan Tozinameran Volume (K) Forecast, by Application 2019 & 2032
- Table 87: South Korea Tozinameran Revenue (million) Forecast, by Application 2019 & 2032
- Table 88: South Korea Tozinameran Volume (K) Forecast, by Application 2019 & 2032
- Table 89: ASEAN Tozinameran Revenue (million) Forecast, by Application 2019 & 2032
- Table 90: ASEAN Tozinameran Volume (K) Forecast, by Application 2019 & 2032
- Table 91: Oceania Tozinameran Revenue (million) Forecast, by Application 2019 & 2032
- Table 92: Oceania Tozinameran Volume (K) Forecast, by Application 2019 & 2032
- Table 93: Rest of Asia Pacific Tozinameran Revenue (million) Forecast, by Application 2019 & 2032
- Table 94: Rest of Asia Pacific Tozinameran Volume (K) Forecast, by Application 2019 & 2032
Frequently Asked Questions
1. What is the projected Compound Annual Growth Rate (CAGR) of the Tozinameran?
The projected CAGR is approximately XX%.
2. Which companies are prominent players in the Tozinameran?
Key companies in the market include Pfizer, Biontech, Takeda Pharmaceutical, Fosun Pharma.
3. What are the main segments of the Tozinameran?
The market segments include Application, Types.
4. Can you provide details about the market size?
The market size is estimated to be USD XXX million as of 2022.
5. What are some drivers contributing to market growth?
N/A
6. What are the notable trends driving market growth?
N/A
7. Are there any restraints impacting market growth?
N/A
8. Can you provide examples of recent developments in the market?
N/A
9. What pricing options are available for accessing the report?
Pricing options include single-user, multi-user, and enterprise licenses priced at USD 3350.00, USD 5025.00, and USD 6700.00 respectively.
10. Is the market size provided in terms of value or volume?
The market size is provided in terms of value, measured in million and volume, measured in K.
11. Are there any specific market keywords associated with the report?
Yes, the market keyword associated with the report is "Tozinameran," which aids in identifying and referencing the specific market segment covered.
12. How do I determine which pricing option suits my needs best?
The pricing options vary based on user requirements and access needs. Individual users may opt for single-user licenses, while businesses requiring broader access may choose multi-user or enterprise licenses for cost-effective access to the report.
13. Are there any additional resources or data provided in the Tozinameran report?
While the report offers comprehensive insights, it's advisable to review the specific contents or supplementary materials provided to ascertain if additional resources or data are available.
14. How can I stay updated on further developments or reports in the Tozinameran?
To stay informed about further developments, trends, and reports in the Tozinameran, consider subscribing to industry newsletters, following relevant companies and organizations, or regularly checking reputable industry news sources and publications.
Methodology
Step 1 - Identification of Relevant Samples Size from Population Database


Step 2 - Approaches for Defining Global Market Size (Value, Volume* & Price*)

Note*: In applicable scenarios
Step 3 - Data Sources
Primary Research
- Web Analytics
- Survey Reports
- Research Institute
- Latest Research Reports
- Opinion Leaders
Secondary Research
- Annual Reports
- White Paper
- Latest Press Release
- Industry Association
- Paid Database
- Investor Presentations

Step 4 - Data Triangulation
Involves using different sources of information in order to increase the validity of a study
These sources are likely to be stakeholders in a program - participants, other researchers, program staff, other community members, and so on.
Then we put all data in single framework & apply various statistical tools to find out the dynamic on the market.
During the analysis stage, feedback from the stakeholder groups would be compared to determine areas of agreement as well as areas of divergence
