

Key Insights
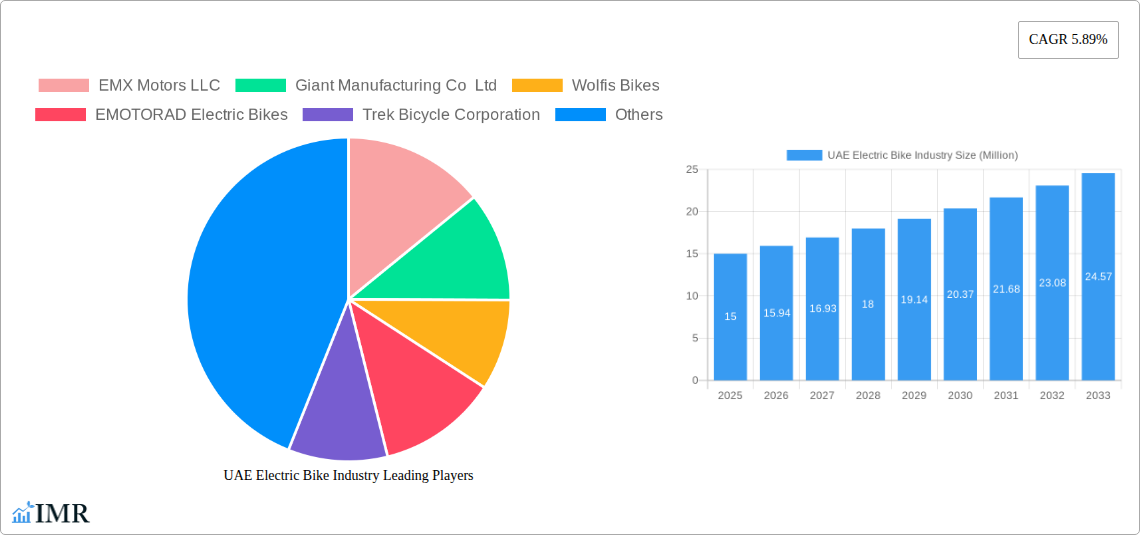
The UAE electric bike market, valued at approximately $XX million in 2025, is projected to experience robust growth, exhibiting a Compound Annual Growth Rate (CAGR) of 5.89% from 2025 to 2033. This expansion is fueled by several key drivers. Increasing environmental awareness and government initiatives promoting sustainable transportation within the UAE are significantly contributing to the rising adoption of e-bikes. Furthermore, the increasing traffic congestion in urban areas, coupled with the rising fuel prices, is making electric bikes a compelling alternative for short-distance commutes and recreational activities. The market is segmented by propulsion type (pedal-assisted, throttle-assisted), application (e-mountain, cargo, city/urban), battery type (lithium-ion, lead-acid), and power output (≤250W, >250W). The lithium-ion battery segment dominates due to its superior performance and longer lifespan. City/urban applications currently hold the largest market share, reflecting the practical appeal of e-bikes for urban mobility. Key players like EMX Motors LLC, Giant Manufacturing Co Ltd, and Trek Bicycle Corporation are actively shaping the market through product innovation and expanding distribution networks. However, high initial purchase costs and limited charging infrastructure remain key restraints to wider market penetration. Future growth will likely be driven by technological advancements leading to improved battery technology, reduced prices, and the development of more comprehensive charging infrastructure within the UAE.
The forecast period (2025-2033) anticipates a steady increase in market size driven by sustained government support for green initiatives and the growing preference for eco-friendly transportation solutions. Competition amongst manufacturers is expected to intensify, leading to innovation in e-bike designs and features catering to diverse consumer needs. The expansion of e-bike sharing programs and the integration of e-bikes into public transportation systems are likely to further propel market growth. The market is expected to see a gradual shift towards higher-powered e-bikes as consumer preferences evolve and technology advances allow for longer-range travel. Understanding these dynamics is crucial for businesses looking to capitalize on the growth opportunities within the burgeoning UAE electric bike market.
UAE Electric Bike Industry: Market Report 2019-2033
This comprehensive report provides an in-depth analysis of the burgeoning UAE electric bike industry, covering market dynamics, growth trends, key players, and future projections from 2019 to 2033. The report serves as an essential resource for industry professionals, investors, and policymakers seeking to understand this rapidly evolving sector. With a focus on both the parent market (micromobility) and the child market (electric bikes), this report offers unparalleled insights into the UAE's electric bike landscape.
UAE Electric Bike Industry Market Dynamics & Structure
The UAE electric bike market is characterized by a moderately fragmented structure, with both international and local players vying for market share. Technological innovation, driven by advancements in battery technology and motor efficiency, is a significant growth driver. The supportive regulatory framework, encouraging sustainable transportation solutions, further bolsters market expansion. However, the relatively high initial cost of e-bikes compared to traditional bicycles poses a barrier to wider adoption. The market also faces competition from other micromobility solutions, such as e-scooters. Mergers and acquisitions (M&A) activity has been relatively low to date but is expected to increase as larger companies look to consolidate their market position. The industry shows potential for significant growth.
- Market Concentration: Moderately fragmented, with a mix of international and domestic brands.
- Technological Innovation: Advancements in battery technology and motor efficiency are key drivers.
- Regulatory Framework: Supportive government policies promoting sustainable transport.
- Competitive Substitutes: E-scooters, other micromobility options.
- End-User Demographics: Growing interest among young professionals, commuters, and environmentally conscious consumers.
- M&A Activity: Low to date, but potential for increase in the forecast period. Expected M&A deal volume: xx Million units.
UAE Electric Bike Industry Growth Trends & Insights
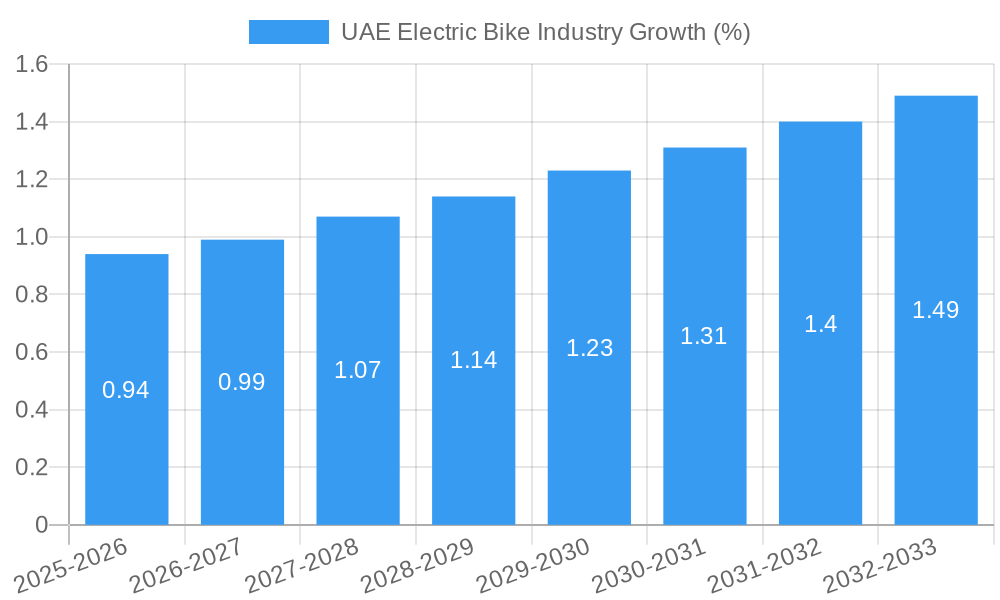
The UAE electric bike market is experiencing robust growth, fueled by rising environmental awareness, increasing urbanization, and government initiatives promoting sustainable transportation. The market size is expected to expand significantly over the forecast period, driven by increased adoption rates and technological advancements. Consumer behavior is shifting towards eco-friendly transportation options, further boosting the demand for electric bikes. The Compound Annual Growth Rate (CAGR) is projected to be xx% during 2025-2033. Market penetration is currently estimated at xx% and is projected to reach xx% by 2033.
- Market Size Evolution: Significant expansion expected during 2025-2033. In 2025, the market size is estimated at xx Million units; in 2033, it's projected at xx Million units.
- Adoption Rates: Increasing steadily, driven by consumer preferences and government incentives.
- Technological Disruptions: Continuous improvements in battery technology, motor efficiency, and smart features.
- Consumer Behavior Shifts: Growing preference for sustainable and eco-friendly transportation.
Dominant Regions, Countries, or Segments in UAE Electric Bike Industry
The City/Urban segment currently dominates the UAE electric bike market, driven by the high concentration of population in urban areas and the increasing need for efficient commuting solutions. Within propulsion types, Pedal Assisted e-bikes hold a significant market share due to their affordability and ease of use. Lithium-ion batteries are the dominant battery type due to their higher energy density and longer lifespan. The power segment of Less than and Equal to 250W currently leads due to their accessibility and affordability. Growth is driven by government initiatives promoting cycling infrastructure, favorable economic conditions, and increasing environmental awareness.
- Key Drivers:
- Expanding urban infrastructure supporting cycling.
- Government initiatives promoting sustainable transportation.
- Rising environmental awareness among consumers.
- Increasing affordability of electric bikes.
- Dominant Segments: City/Urban application, Pedal Assisted propulsion type, Lithium-ion batteries, Less than and Equal to 250W power.
UAE Electric Bike Industry Product Landscape
The UAE electric bike market showcases a diverse range of products, from basic city e-bikes to high-performance mountain e-bikes. Key features include improved battery technology for longer range, integrated smart connectivity, and enhanced safety features. Manufacturers are focusing on differentiating their offerings through unique design aesthetics, advanced technology, and specialized applications tailored to specific user needs. The market is witnessing increasing competition based on innovative features, performance metrics, and pricing strategies.
Key Drivers, Barriers & Challenges in UAE Electric Bike Industry
Key Drivers: Government support for sustainable transport, growing environmental consciousness, increasing urbanization, and the need for efficient commuting solutions. Technological advancements in battery technology and motor efficiency are also driving the market forward.
Challenges: High initial purchase cost of e-bikes compared to traditional bicycles, limited charging infrastructure in certain areas, and the need for improved awareness about the benefits and safety of electric bikes. Competition from other micromobility options also presents a challenge. Supply chain disruptions can impact availability and pricing. Regulatory hurdles and the need for standardization may also slow down growth in the short term.
Emerging Opportunities in UAE Electric Bike Industry
Emerging opportunities include expanding into untapped markets (such as tourism and delivery services), developing innovative e-bike applications for specific industries (e.g., last-mile delivery), and catering to the growing demand for high-performance e-bikes for recreation and sports. Focusing on enhancing customer experience through service and maintenance offerings is also an area for growth.
Growth Accelerators in the UAE Electric Bike Industry Industry
Long-term growth will be fueled by continued technological innovation, strategic partnerships between manufacturers and government agencies to improve infrastructure, and strategic market expansion initiatives targeting specific demographics. Increased awareness campaigns highlighting the environmental and health benefits of electric bikes will also contribute to market growth.
Key Players Shaping the UAE Electric Bike Industry Market
- EMX Motors LLC
- Giant Manufacturing Co Ltd
- Wolfis Bikes
- EMOTORAD Electric Bikes
- Trek Bicycle Corporation
- ONE Moto
- Raleigh Bikes Inc
- Specialized Bicycle Components Inc
- Eveons Mobility Systems LLC
- Saluki Bikes
Notable Milestones in UAE Electric Bike Industry Sector
- August 2021: Riese & Müller Business expands its portfolio of e-bikes and cargo bikes for commercial fleets in the UAE.
- April 2022: TIER launches its first fleet of e-bikes in the UAE, expanding micro-mobility options.
- July 2022: Talabat and Motoboy partner to pilot electric delivery bikes in Dubai, promoting sustainable logistics.
In-Depth UAE Electric Bike Industry Market Outlook
The UAE electric bike market exhibits immense future potential, driven by sustained government support for sustainable transportation, technological advancements, and evolving consumer preferences. Strategic opportunities lie in developing innovative products, expanding into niche markets, and establishing robust after-sales services. The market is poised for significant expansion in the coming years, with considerable growth opportunities for both established and emerging players.
UAE Electric Bike Industry Segmentation
-
1. Propulsion Type
- 1.1. Pedal Assisted
- 1.2. Throttle-assisted (Power-on-demand)
-
2. Application
- 2.1. E-Mountain
- 2.2. Cargo
- 2.3. City/Urban
-
3. Battery Type
- 3.1. Lithium-ion Battery
- 3.2. Lead-acid Battery
- 3.3. Other Battery Types
-
4. Power
- 4.1. Less than and Equal to 250W
- 4.2. Above 250W
UAE Electric Bike Industry Segmentation By Geography
-
1. North America
- 1.1. United States
- 1.2. Canada
- 1.3. Mexico
-
2. South America
- 2.1. Brazil
- 2.2. Argentina
- 2.3. Rest of South America
-
3. Europe
- 3.1. United Kingdom
- 3.2. Germany
- 3.3. France
- 3.4. Italy
- 3.5. Spain
- 3.6. Russia
- 3.7. Benelux
- 3.8. Nordics
- 3.9. Rest of Europe
-
4. Middle East & Africa
- 4.1. Turkey
- 4.2. Israel
- 4.3. GCC
- 4.4. North Africa
- 4.5. South Africa
- 4.6. Rest of Middle East & Africa
-
5. Asia Pacific
- 5.1. China
- 5.2. India
- 5.3. Japan
- 5.4. South Korea
- 5.5. ASEAN
- 5.6. Oceania
- 5.7. Rest of Asia Pacific
UAE Electric Bike Industry REPORT HIGHLIGHTS
| Aspects | Details |
|---|---|
| Study Period | 2019-2033 |
| Base Year | 2024 |
| Estimated Year | 2025 |
| Forecast Period | 2025-2033 |
| Historical Period | 2019-2024 |
| Growth Rate | CAGR of 5.89% from 2019-2033 |
| Segmentation |
|
Table of Contents
- 1. Introduction
- 1.1. Research Scope
- 1.2. Market Segmentation
- 1.3. Research Methodology
- 1.4. Definitions and Assumptions
- 2. Executive Summary
- 2.1. Introduction
- 3. Market Dynamics
- 3.1. Introduction
- 3.2. Market Drivers
- 3.2.1. Rising Traffic Congestion and Increasing Urban Population to Foster Market Growth
- 3.3. Market Restrains
- 3.3.1. Strict Government Regulations and Policies Toward Ride-hailing Services Impact the Market Growth
- 3.4. Market Trends
- 3.4.1. Rising Adoption of E-bikes Across Various Sectors to Drive Demand in the Market
- 4. Market Factor Analysis
- 4.1. Porters Five Forces
- 4.2. Supply/Value Chain
- 4.3. PESTEL analysis
- 4.4. Market Entropy
- 4.5. Patent/Trademark Analysis
- 5. Global UAE Electric Bike Industry Analysis, Insights and Forecast, 2019-2031
- 5.1. Market Analysis, Insights and Forecast - by Propulsion Type
- 5.1.1. Pedal Assisted
- 5.1.2. Throttle-assisted (Power-on-demand)
- 5.2. Market Analysis, Insights and Forecast - by Application
- 5.2.1. E-Mountain
- 5.2.2. Cargo
- 5.2.3. City/Urban
- 5.3. Market Analysis, Insights and Forecast - by Battery Type
- 5.3.1. Lithium-ion Battery
- 5.3.2. Lead-acid Battery
- 5.3.3. Other Battery Types
- 5.4. Market Analysis, Insights and Forecast - by Power
- 5.4.1. Less than and Equal to 250W
- 5.4.2. Above 250W
- 5.5. Market Analysis, Insights and Forecast - by Region
- 5.5.1. North America
- 5.5.2. South America
- 5.5.3. Europe
- 5.5.4. Middle East & Africa
- 5.5.5. Asia Pacific
- 5.1. Market Analysis, Insights and Forecast - by Propulsion Type
- 6. North America UAE Electric Bike Industry Analysis, Insights and Forecast, 2019-2031
- 6.1. Market Analysis, Insights and Forecast - by Propulsion Type
- 6.1.1. Pedal Assisted
- 6.1.2. Throttle-assisted (Power-on-demand)
- 6.2. Market Analysis, Insights and Forecast - by Application
- 6.2.1. E-Mountain
- 6.2.2. Cargo
- 6.2.3. City/Urban
- 6.3. Market Analysis, Insights and Forecast - by Battery Type
- 6.3.1. Lithium-ion Battery
- 6.3.2. Lead-acid Battery
- 6.3.3. Other Battery Types
- 6.4. Market Analysis, Insights and Forecast - by Power
- 6.4.1. Less than and Equal to 250W
- 6.4.2. Above 250W
- 6.1. Market Analysis, Insights and Forecast - by Propulsion Type
- 7. South America UAE Electric Bike Industry Analysis, Insights and Forecast, 2019-2031
- 7.1. Market Analysis, Insights and Forecast - by Propulsion Type
- 7.1.1. Pedal Assisted
- 7.1.2. Throttle-assisted (Power-on-demand)
- 7.2. Market Analysis, Insights and Forecast - by Application
- 7.2.1. E-Mountain
- 7.2.2. Cargo
- 7.2.3. City/Urban
- 7.3. Market Analysis, Insights and Forecast - by Battery Type
- 7.3.1. Lithium-ion Battery
- 7.3.2. Lead-acid Battery
- 7.3.3. Other Battery Types
- 7.4. Market Analysis, Insights and Forecast - by Power
- 7.4.1. Less than and Equal to 250W
- 7.4.2. Above 250W
- 7.1. Market Analysis, Insights and Forecast - by Propulsion Type
- 8. Europe UAE Electric Bike Industry Analysis, Insights and Forecast, 2019-2031
- 8.1. Market Analysis, Insights and Forecast - by Propulsion Type
- 8.1.1. Pedal Assisted
- 8.1.2. Throttle-assisted (Power-on-demand)
- 8.2. Market Analysis, Insights and Forecast - by Application
- 8.2.1. E-Mountain
- 8.2.2. Cargo
- 8.2.3. City/Urban
- 8.3. Market Analysis, Insights and Forecast - by Battery Type
- 8.3.1. Lithium-ion Battery
- 8.3.2. Lead-acid Battery
- 8.3.3. Other Battery Types
- 8.4. Market Analysis, Insights and Forecast - by Power
- 8.4.1. Less than and Equal to 250W
- 8.4.2. Above 250W
- 8.1. Market Analysis, Insights and Forecast - by Propulsion Type
- 9. Middle East & Africa UAE Electric Bike Industry Analysis, Insights and Forecast, 2019-2031
- 9.1. Market Analysis, Insights and Forecast - by Propulsion Type
- 9.1.1. Pedal Assisted
- 9.1.2. Throttle-assisted (Power-on-demand)
- 9.2. Market Analysis, Insights and Forecast - by Application
- 9.2.1. E-Mountain
- 9.2.2. Cargo
- 9.2.3. City/Urban
- 9.3. Market Analysis, Insights and Forecast - by Battery Type
- 9.3.1. Lithium-ion Battery
- 9.3.2. Lead-acid Battery
- 9.3.3. Other Battery Types
- 9.4. Market Analysis, Insights and Forecast - by Power
- 9.4.1. Less than and Equal to 250W
- 9.4.2. Above 250W
- 9.1. Market Analysis, Insights and Forecast - by Propulsion Type
- 10. Asia Pacific UAE Electric Bike Industry Analysis, Insights and Forecast, 2019-2031
- 10.1. Market Analysis, Insights and Forecast - by Propulsion Type
- 10.1.1. Pedal Assisted
- 10.1.2. Throttle-assisted (Power-on-demand)
- 10.2. Market Analysis, Insights and Forecast - by Application
- 10.2.1. E-Mountain
- 10.2.2. Cargo
- 10.2.3. City/Urban
- 10.3. Market Analysis, Insights and Forecast - by Battery Type
- 10.3.1. Lithium-ion Battery
- 10.3.2. Lead-acid Battery
- 10.3.3. Other Battery Types
- 10.4. Market Analysis, Insights and Forecast - by Power
- 10.4.1. Less than and Equal to 250W
- 10.4.2. Above 250W
- 10.1. Market Analysis, Insights and Forecast - by Propulsion Type
- 11. Competitive Analysis
- 11.1. Global Market Share Analysis 2024
- 11.2. Company Profiles
- 11.2.1 EMX Motors LLC
- 11.2.1.1. Overview
- 11.2.1.2. Products
- 11.2.1.3. SWOT Analysis
- 11.2.1.4. Recent Developments
- 11.2.1.5. Financials (Based on Availability)
- 11.2.2 Giant Manufacturing Co Ltd
- 11.2.2.1. Overview
- 11.2.2.2. Products
- 11.2.2.3. SWOT Analysis
- 11.2.2.4. Recent Developments
- 11.2.2.5. Financials (Based on Availability)
- 11.2.3 Wolfis Bikes
- 11.2.3.1. Overview
- 11.2.3.2. Products
- 11.2.3.3. SWOT Analysis
- 11.2.3.4. Recent Developments
- 11.2.3.5. Financials (Based on Availability)
- 11.2.4 EMOTORAD Electric Bikes
- 11.2.4.1. Overview
- 11.2.4.2. Products
- 11.2.4.3. SWOT Analysis
- 11.2.4.4. Recent Developments
- 11.2.4.5. Financials (Based on Availability)
- 11.2.5 Trek Bicycle Corporation
- 11.2.5.1. Overview
- 11.2.5.2. Products
- 11.2.5.3. SWOT Analysis
- 11.2.5.4. Recent Developments
- 11.2.5.5. Financials (Based on Availability)
- 11.2.6 ONE Moto
- 11.2.6.1. Overview
- 11.2.6.2. Products
- 11.2.6.3. SWOT Analysis
- 11.2.6.4. Recent Developments
- 11.2.6.5. Financials (Based on Availability)
- 11.2.7 Raleigh Bikes Inc
- 11.2.7.1. Overview
- 11.2.7.2. Products
- 11.2.7.3. SWOT Analysis
- 11.2.7.4. Recent Developments
- 11.2.7.5. Financials (Based on Availability)
- 11.2.8 Specialized Bicycle Components Inc*List Not Exhaustive
- 11.2.8.1. Overview
- 11.2.8.2. Products
- 11.2.8.3. SWOT Analysis
- 11.2.8.4. Recent Developments
- 11.2.8.5. Financials (Based on Availability)
- 11.2.9 Eveons Mobility Systems LLC
- 11.2.9.1. Overview
- 11.2.9.2. Products
- 11.2.9.3. SWOT Analysis
- 11.2.9.4. Recent Developments
- 11.2.9.5. Financials (Based on Availability)
- 11.2.10 Saluki Bikes
- 11.2.10.1. Overview
- 11.2.10.2. Products
- 11.2.10.3. SWOT Analysis
- 11.2.10.4. Recent Developments
- 11.2.10.5. Financials (Based on Availability)
- 11.2.1 EMX Motors LLC
List of Figures
- Figure 1: Global UAE Electric Bike Industry Revenue Breakdown (Million, %) by Region 2024 & 2032
- Figure 2: UAE UAE Electric Bike Industry Revenue (Million), by Country 2024 & 2032
- Figure 3: UAE UAE Electric Bike Industry Revenue Share (%), by Country 2024 & 2032
- Figure 4: North America UAE Electric Bike Industry Revenue (Million), by Propulsion Type 2024 & 2032
- Figure 5: North America UAE Electric Bike Industry Revenue Share (%), by Propulsion Type 2024 & 2032
- Figure 6: North America UAE Electric Bike Industry Revenue (Million), by Application 2024 & 2032
- Figure 7: North America UAE Electric Bike Industry Revenue Share (%), by Application 2024 & 2032
- Figure 8: North America UAE Electric Bike Industry Revenue (Million), by Battery Type 2024 & 2032
- Figure 9: North America UAE Electric Bike Industry Revenue Share (%), by Battery Type 2024 & 2032
- Figure 10: North America UAE Electric Bike Industry Revenue (Million), by Power 2024 & 2032
- Figure 11: North America UAE Electric Bike Industry Revenue Share (%), by Power 2024 & 2032
- Figure 12: North America UAE Electric Bike Industry Revenue (Million), by Country 2024 & 2032
- Figure 13: North America UAE Electric Bike Industry Revenue Share (%), by Country 2024 & 2032
- Figure 14: South America UAE Electric Bike Industry Revenue (Million), by Propulsion Type 2024 & 2032
- Figure 15: South America UAE Electric Bike Industry Revenue Share (%), by Propulsion Type 2024 & 2032
- Figure 16: South America UAE Electric Bike Industry Revenue (Million), by Application 2024 & 2032
- Figure 17: South America UAE Electric Bike Industry Revenue Share (%), by Application 2024 & 2032
- Figure 18: South America UAE Electric Bike Industry Revenue (Million), by Battery Type 2024 & 2032
- Figure 19: South America UAE Electric Bike Industry Revenue Share (%), by Battery Type 2024 & 2032
- Figure 20: South America UAE Electric Bike Industry Revenue (Million), by Power 2024 & 2032
- Figure 21: South America UAE Electric Bike Industry Revenue Share (%), by Power 2024 & 2032
- Figure 22: South America UAE Electric Bike Industry Revenue (Million), by Country 2024 & 2032
- Figure 23: South America UAE Electric Bike Industry Revenue Share (%), by Country 2024 & 2032
- Figure 24: Europe UAE Electric Bike Industry Revenue (Million), by Propulsion Type 2024 & 2032
- Figure 25: Europe UAE Electric Bike Industry Revenue Share (%), by Propulsion Type 2024 & 2032
- Figure 26: Europe UAE Electric Bike Industry Revenue (Million), by Application 2024 & 2032
- Figure 27: Europe UAE Electric Bike Industry Revenue Share (%), by Application 2024 & 2032
- Figure 28: Europe UAE Electric Bike Industry Revenue (Million), by Battery Type 2024 & 2032
- Figure 29: Europe UAE Electric Bike Industry Revenue Share (%), by Battery Type 2024 & 2032
- Figure 30: Europe UAE Electric Bike Industry Revenue (Million), by Power 2024 & 2032
- Figure 31: Europe UAE Electric Bike Industry Revenue Share (%), by Power 2024 & 2032
- Figure 32: Europe UAE Electric Bike Industry Revenue (Million), by Country 2024 & 2032
- Figure 33: Europe UAE Electric Bike Industry Revenue Share (%), by Country 2024 & 2032
- Figure 34: Middle East & Africa UAE Electric Bike Industry Revenue (Million), by Propulsion Type 2024 & 2032
- Figure 35: Middle East & Africa UAE Electric Bike Industry Revenue Share (%), by Propulsion Type 2024 & 2032
- Figure 36: Middle East & Africa UAE Electric Bike Industry Revenue (Million), by Application 2024 & 2032
- Figure 37: Middle East & Africa UAE Electric Bike Industry Revenue Share (%), by Application 2024 & 2032
- Figure 38: Middle East & Africa UAE Electric Bike Industry Revenue (Million), by Battery Type 2024 & 2032
- Figure 39: Middle East & Africa UAE Electric Bike Industry Revenue Share (%), by Battery Type 2024 & 2032
- Figure 40: Middle East & Africa UAE Electric Bike Industry Revenue (Million), by Power 2024 & 2032
- Figure 41: Middle East & Africa UAE Electric Bike Industry Revenue Share (%), by Power 2024 & 2032
- Figure 42: Middle East & Africa UAE Electric Bike Industry Revenue (Million), by Country 2024 & 2032
- Figure 43: Middle East & Africa UAE Electric Bike Industry Revenue Share (%), by Country 2024 & 2032
- Figure 44: Asia Pacific UAE Electric Bike Industry Revenue (Million), by Propulsion Type 2024 & 2032
- Figure 45: Asia Pacific UAE Electric Bike Industry Revenue Share (%), by Propulsion Type 2024 & 2032
- Figure 46: Asia Pacific UAE Electric Bike Industry Revenue (Million), by Application 2024 & 2032
- Figure 47: Asia Pacific UAE Electric Bike Industry Revenue Share (%), by Application 2024 & 2032
- Figure 48: Asia Pacific UAE Electric Bike Industry Revenue (Million), by Battery Type 2024 & 2032
- Figure 49: Asia Pacific UAE Electric Bike Industry Revenue Share (%), by Battery Type 2024 & 2032
- Figure 50: Asia Pacific UAE Electric Bike Industry Revenue (Million), by Power 2024 & 2032
- Figure 51: Asia Pacific UAE Electric Bike Industry Revenue Share (%), by Power 2024 & 2032
- Figure 52: Asia Pacific UAE Electric Bike Industry Revenue (Million), by Country 2024 & 2032
- Figure 53: Asia Pacific UAE Electric Bike Industry Revenue Share (%), by Country 2024 & 2032
List of Tables
- Table 1: Global UAE Electric Bike Industry Revenue Million Forecast, by Region 2019 & 2032
- Table 2: Global UAE Electric Bike Industry Revenue Million Forecast, by Propulsion Type 2019 & 2032
- Table 3: Global UAE Electric Bike Industry Revenue Million Forecast, by Application 2019 & 2032
- Table 4: Global UAE Electric Bike Industry Revenue Million Forecast, by Battery Type 2019 & 2032
- Table 5: Global UAE Electric Bike Industry Revenue Million Forecast, by Power 2019 & 2032
- Table 6: Global UAE Electric Bike Industry Revenue Million Forecast, by Region 2019 & 2032
- Table 7: Global UAE Electric Bike Industry Revenue Million Forecast, by Country 2019 & 2032
- Table 8: Global UAE Electric Bike Industry Revenue Million Forecast, by Propulsion Type 2019 & 2032
- Table 9: Global UAE Electric Bike Industry Revenue Million Forecast, by Application 2019 & 2032
- Table 10: Global UAE Electric Bike Industry Revenue Million Forecast, by Battery Type 2019 & 2032
- Table 11: Global UAE Electric Bike Industry Revenue Million Forecast, by Power 2019 & 2032
- Table 12: Global UAE Electric Bike Industry Revenue Million Forecast, by Country 2019 & 2032
- Table 13: United States UAE Electric Bike Industry Revenue (Million) Forecast, by Application 2019 & 2032
- Table 14: Canada UAE Electric Bike Industry Revenue (Million) Forecast, by Application 2019 & 2032
- Table 15: Mexico UAE Electric Bike Industry Revenue (Million) Forecast, by Application 2019 & 2032
- Table 16: Global UAE Electric Bike Industry Revenue Million Forecast, by Propulsion Type 2019 & 2032
- Table 17: Global UAE Electric Bike Industry Revenue Million Forecast, by Application 2019 & 2032
- Table 18: Global UAE Electric Bike Industry Revenue Million Forecast, by Battery Type 2019 & 2032
- Table 19: Global UAE Electric Bike Industry Revenue Million Forecast, by Power 2019 & 2032
- Table 20: Global UAE Electric Bike Industry Revenue Million Forecast, by Country 2019 & 2032
- Table 21: Brazil UAE Electric Bike Industry Revenue (Million) Forecast, by Application 2019 & 2032
- Table 22: Argentina UAE Electric Bike Industry Revenue (Million) Forecast, by Application 2019 & 2032
- Table 23: Rest of South America UAE Electric Bike Industry Revenue (Million) Forecast, by Application 2019 & 2032
- Table 24: Global UAE Electric Bike Industry Revenue Million Forecast, by Propulsion Type 2019 & 2032
- Table 25: Global UAE Electric Bike Industry Revenue Million Forecast, by Application 2019 & 2032
- Table 26: Global UAE Electric Bike Industry Revenue Million Forecast, by Battery Type 2019 & 2032
- Table 27: Global UAE Electric Bike Industry Revenue Million Forecast, by Power 2019 & 2032
- Table 28: Global UAE Electric Bike Industry Revenue Million Forecast, by Country 2019 & 2032
- Table 29: United Kingdom UAE Electric Bike Industry Revenue (Million) Forecast, by Application 2019 & 2032
- Table 30: Germany UAE Electric Bike Industry Revenue (Million) Forecast, by Application 2019 & 2032
- Table 31: France UAE Electric Bike Industry Revenue (Million) Forecast, by Application 2019 & 2032
- Table 32: Italy UAE Electric Bike Industry Revenue (Million) Forecast, by Application 2019 & 2032
- Table 33: Spain UAE Electric Bike Industry Revenue (Million) Forecast, by Application 2019 & 2032
- Table 34: Russia UAE Electric Bike Industry Revenue (Million) Forecast, by Application 2019 & 2032
- Table 35: Benelux UAE Electric Bike Industry Revenue (Million) Forecast, by Application 2019 & 2032
- Table 36: Nordics UAE Electric Bike Industry Revenue (Million) Forecast, by Application 2019 & 2032
- Table 37: Rest of Europe UAE Electric Bike Industry Revenue (Million) Forecast, by Application 2019 & 2032
- Table 38: Global UAE Electric Bike Industry Revenue Million Forecast, by Propulsion Type 2019 & 2032
- Table 39: Global UAE Electric Bike Industry Revenue Million Forecast, by Application 2019 & 2032
- Table 40: Global UAE Electric Bike Industry Revenue Million Forecast, by Battery Type 2019 & 2032
- Table 41: Global UAE Electric Bike Industry Revenue Million Forecast, by Power 2019 & 2032
- Table 42: Global UAE Electric Bike Industry Revenue Million Forecast, by Country 2019 & 2032
- Table 43: Turkey UAE Electric Bike Industry Revenue (Million) Forecast, by Application 2019 & 2032
- Table 44: Israel UAE Electric Bike Industry Revenue (Million) Forecast, by Application 2019 & 2032
- Table 45: GCC UAE Electric Bike Industry Revenue (Million) Forecast, by Application 2019 & 2032
- Table 46: North Africa UAE Electric Bike Industry Revenue (Million) Forecast, by Application 2019 & 2032
- Table 47: South Africa UAE Electric Bike Industry Revenue (Million) Forecast, by Application 2019 & 2032
- Table 48: Rest of Middle East & Africa UAE Electric Bike Industry Revenue (Million) Forecast, by Application 2019 & 2032
- Table 49: Global UAE Electric Bike Industry Revenue Million Forecast, by Propulsion Type 2019 & 2032
- Table 50: Global UAE Electric Bike Industry Revenue Million Forecast, by Application 2019 & 2032
- Table 51: Global UAE Electric Bike Industry Revenue Million Forecast, by Battery Type 2019 & 2032
- Table 52: Global UAE Electric Bike Industry Revenue Million Forecast, by Power 2019 & 2032
- Table 53: Global UAE Electric Bike Industry Revenue Million Forecast, by Country 2019 & 2032
- Table 54: China UAE Electric Bike Industry Revenue (Million) Forecast, by Application 2019 & 2032
- Table 55: India UAE Electric Bike Industry Revenue (Million) Forecast, by Application 2019 & 2032
- Table 56: Japan UAE Electric Bike Industry Revenue (Million) Forecast, by Application 2019 & 2032
- Table 57: South Korea UAE Electric Bike Industry Revenue (Million) Forecast, by Application 2019 & 2032
- Table 58: ASEAN UAE Electric Bike Industry Revenue (Million) Forecast, by Application 2019 & 2032
- Table 59: Oceania UAE Electric Bike Industry Revenue (Million) Forecast, by Application 2019 & 2032
- Table 60: Rest of Asia Pacific UAE Electric Bike Industry Revenue (Million) Forecast, by Application 2019 & 2032
Frequently Asked Questions
1. What is the projected Compound Annual Growth Rate (CAGR) of the UAE Electric Bike Industry?
The projected CAGR is approximately 5.89%.
2. Which companies are prominent players in the UAE Electric Bike Industry?
Key companies in the market include EMX Motors LLC, Giant Manufacturing Co Ltd, Wolfis Bikes, EMOTORAD Electric Bikes, Trek Bicycle Corporation, ONE Moto, Raleigh Bikes Inc, Specialized Bicycle Components Inc*List Not Exhaustive, Eveons Mobility Systems LLC, Saluki Bikes.
3. What are the main segments of the UAE Electric Bike Industry?
The market segments include Propulsion Type, Application, Battery Type, Power.
4. Can you provide details about the market size?
The market size is estimated to be USD XX Million as of 2022.
5. What are some drivers contributing to market growth?
Rising Traffic Congestion and Increasing Urban Population to Foster Market Growth.
6. What are the notable trends driving market growth?
Rising Adoption of E-bikes Across Various Sectors to Drive Demand in the Market.
7. Are there any restraints impacting market growth?
Strict Government Regulations and Policies Toward Ride-hailing Services Impact the Market Growth.
8. Can you provide examples of recent developments in the market?
In April 2022, TIER, one of Europe's leading shared micro-mobility providers, has launched its first fleet of e-bikes in the UAE. The e-bike launch is in line with TIER's strategic plan to provide micro-mobility solutions in all major cities and hubs across the Middle East, enabling a larger audience with the option of a sustainable method of transport, whilst reducing carbon emissions.
9. What pricing options are available for accessing the report?
Pricing options include single-user, multi-user, and enterprise licenses priced at USD 3800, USD 4500, and USD 5800 respectively.
10. Is the market size provided in terms of value or volume?
The market size is provided in terms of value, measured in Million.
11. Are there any specific market keywords associated with the report?
Yes, the market keyword associated with the report is "UAE Electric Bike Industry," which aids in identifying and referencing the specific market segment covered.
12. How do I determine which pricing option suits my needs best?
The pricing options vary based on user requirements and access needs. Individual users may opt for single-user licenses, while businesses requiring broader access may choose multi-user or enterprise licenses for cost-effective access to the report.
13. Are there any additional resources or data provided in the UAE Electric Bike Industry report?
While the report offers comprehensive insights, it's advisable to review the specific contents or supplementary materials provided to ascertain if additional resources or data are available.
14. How can I stay updated on further developments or reports in the UAE Electric Bike Industry?
To stay informed about further developments, trends, and reports in the UAE Electric Bike Industry, consider subscribing to industry newsletters, following relevant companies and organizations, or regularly checking reputable industry news sources and publications.
Methodology
Step 1 - Identification of Relevant Samples Size from Population Database


Step 2 - Approaches for Defining Global Market Size (Value, Volume* & Price*)

Note*: In applicable scenarios
Step 3 - Data Sources
Primary Research
- Web Analytics
- Survey Reports
- Research Institute
- Latest Research Reports
- Opinion Leaders
Secondary Research
- Annual Reports
- White Paper
- Latest Press Release
- Industry Association
- Paid Database
- Investor Presentations

Step 4 - Data Triangulation
Involves using different sources of information in order to increase the validity of a study
These sources are likely to be stakeholders in a program - participants, other researchers, program staff, other community members, and so on.
Then we put all data in single framework & apply various statistical tools to find out the dynamic on the market.
During the analysis stage, feedback from the stakeholder groups would be compared to determine areas of agreement as well as areas of divergence
