

Key Insights
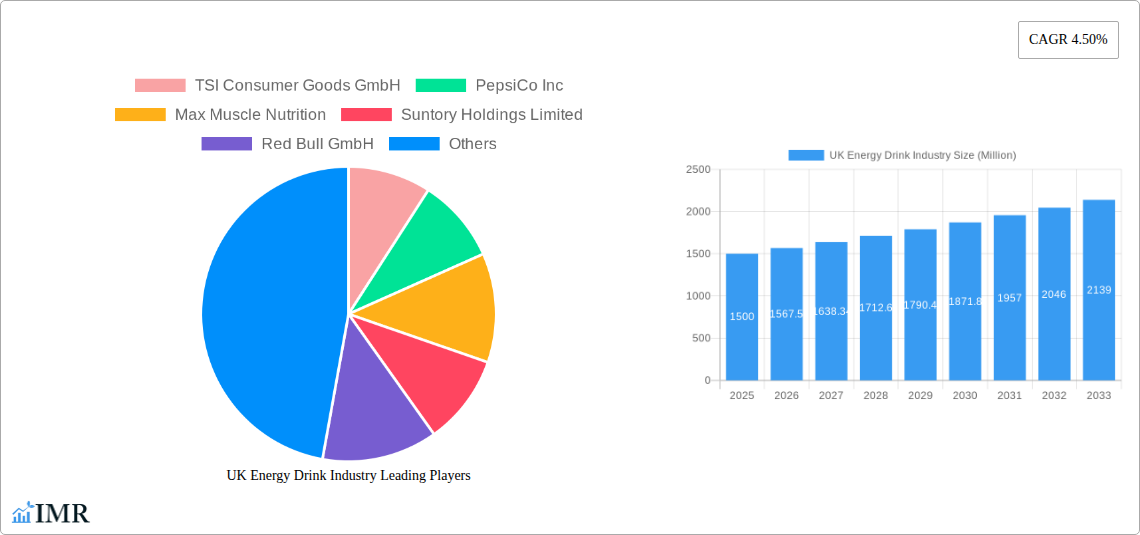
The UK energy drink market, valued at approximately £1.5 billion in 2025, is projected to experience steady growth, with a compound annual growth rate (CAGR) of 4.5% from 2025 to 2033. This expansion is driven by several factors. Firstly, the increasing prevalence of busy lifestyles and demanding work schedules fuels the demand for quick energy boosts. Secondly, the evolving consumer preferences towards functional beverages with added vitamins and natural ingredients are shaping product innovation within the sector. Furthermore, successful marketing campaigns targeting younger demographics, coupled with strategic distribution expansion across various retail channels – from supermarkets and convenience stores to online platforms – contribute significantly to market growth. However, growing health consciousness and concerns regarding the high sugar and caffeine content in many energy drinks represent a key restraint. The market is segmented by packaging type (cans and PET bottles), product type (drinks, shots, and mixers), and distribution channels, with supermarkets and hypermarkets currently holding the largest market share. Competition is fierce, with established players like Red Bull, Coca-Cola, and PepsiCo vying for market dominance alongside emerging brands focused on healthier formulations and niche appeal. The market's future trajectory will depend heavily on adapting to evolving consumer preferences for healthier options and innovative product offerings.
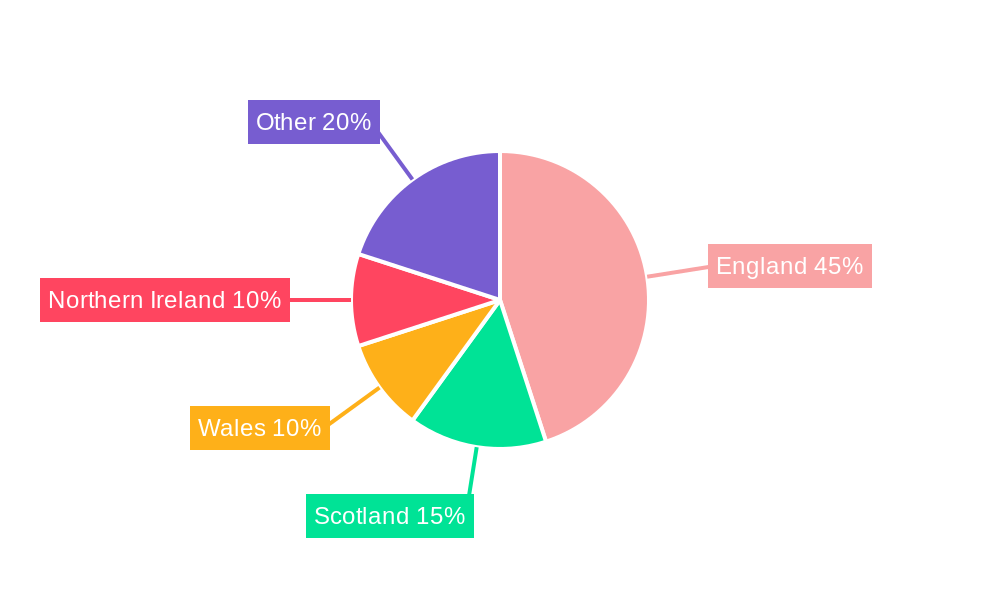
The regional breakdown within the UK reflects the energy drink market's relatively even distribution across England, Wales, Scotland, and Northern Ireland, with slight variations based on population density and consumer habits. The growth in online retail channels is expected to slightly increase market accessibility nationwide, potentially reducing regional disparities over the forecast period. The continued success of established brands will rely on effective branding, innovative product development, and strategic partnerships to maintain a strong presence in the competitive landscape. New entrants will need to effectively communicate the unique value proposition of their products, focusing on either health-conscious formulations or appealing to specific consumer niches.
UK Energy Drink Industry: A Comprehensive Market Report (2019-2033)
This comprehensive report provides a detailed analysis of the UK energy drink market, offering invaluable insights for industry professionals, investors, and strategic decision-makers. Spanning the period from 2019 to 2033, with a focus on 2025, this study meticulously examines market dynamics, growth trends, key players, and future prospects. The report leverages rigorous data analysis and incorporates recent industry developments to deliver a robust and actionable overview. Download now to gain a competitive edge in this rapidly evolving market.
UK Energy Drink Industry Market Dynamics & Structure
This section analyzes the competitive landscape, technological advancements, regulatory influences, and consumer trends shaping the UK energy drink market. The market is characterized by a high level of competition amongst established global players and emerging innovative brands.
- Market Concentration: The market exhibits moderate concentration, with a few dominant players holding significant market share. Red Bull and Coca-Cola, for example, command a substantial portion, estimated at xx% and xx% respectively in 2025. However, numerous smaller players and emerging brands are actively contesting the market.
- Technological Innovation: The sector witnesses constant innovation in product formulation (e.g., functional energy drinks, plant-based options), packaging (e.g., sustainable materials), and distribution (e.g., e-commerce). However, high R&D costs and regulatory compliance requirements can act as barriers to entry for smaller players.
- Regulatory Framework: UK regulations regarding labeling, ingredients, and marketing heavily influence market dynamics. Stringent rules around sugar content and health claims drive product reformulation and influence consumer choices.
- Competitive Product Substitutes: The energy drink market faces competition from other caffeinated beverages like coffee, tea, and sports drinks. Furthermore, the increasing consumer focus on health and wellness is driving the growth of healthier alternatives, placing pressure on traditional energy drinks.
- End-User Demographics: The target market spans a broad demographic, encompassing young adults, athletes, and professionals seeking a quick energy boost. However, increasing health consciousness is shifting consumer preferences towards lower-sugar and healthier alternatives.
- M&A Trends: The sector has witnessed moderate M&A activity in recent years, with larger companies strategically acquiring smaller brands to expand their product portfolios and market reach. The number of deals is estimated to be xx in the past 5 years.
UK Energy Drink Industry Growth Trends & Insights
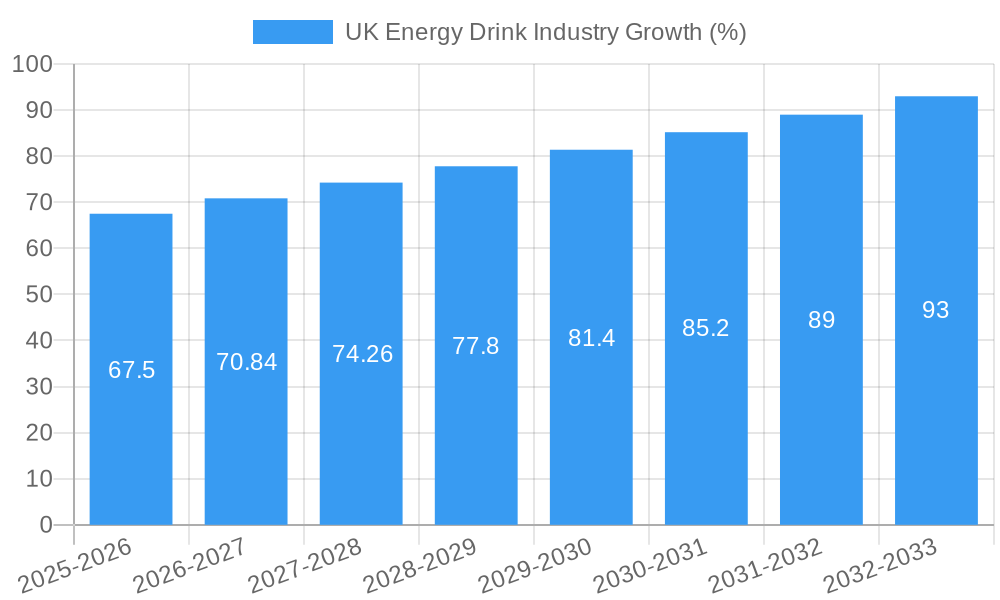
The UK energy drink market exhibits a dynamic growth trajectory. Historical data (2019-2024) reveals consistent market expansion, driven by factors such as increasing consumer demand, product diversification, and effective marketing campaigns. The estimated market size in 2025 is xx million units, showcasing significant growth potential. The Compound Annual Growth Rate (CAGR) during the forecast period (2025-2033) is projected to be xx%, fueled by factors such as the rise of functional energy drinks and the increasing adoption of healthier options. Market penetration is expected to increase from xx% in 2025 to xx% by 2033. Furthermore, technological disruptions, such as the introduction of innovative packaging and formulations, are also contributing to market expansion. A significant shift in consumer behavior, characterized by a growing preference for healthier and functional alternatives, is influencing the trajectory of the market.
Dominant Regions, Countries, or Segments in UK Energy Drink Industry
Market dominance varies across different segments. While national-level data is not consistently available at a unit level, the largest cities and densely populated areas tend to drive the market.
- By Packaging Type: Cans currently hold the largest market share (xx%), followed by PET bottles (xx%). Consumer preference for portability and convenience is a primary driver of this dominance.
- By Product Type: Traditional energy drinks constitute the largest segment, contributing xx% to the total market. However, the fast-growing segments are shots (xx%) and functional mixes (xx%), reflecting evolving consumer demands for healthier alternatives.
- By Distribution Channel: Supermarkets/hypermarkets are the leading distribution channel, accounting for xx% of total sales. This reflects the convenience and wide availability of the products in these locations. Convenience stores (xx%) and specialist stores (xx%) also play crucial roles in the distribution network. Online retail channels are increasingly gaining traction (xx%), driven by a rise in e-commerce and convenience seeking behaviors.
UK Energy Drink Industry Product Landscape
The UK energy drink market showcases a wide array of products, ranging from traditional high-sugar, high-caffeine drinks to healthier alternatives focusing on natural ingredients, reduced sugar, and functional benefits. Innovations center on healthier formulations, convenient packaging, and unique flavor profiles to cater to evolving consumer preferences. This includes the rise of plant-based energy drinks and the incorporation of functional ingredients like vitamins and antioxidants. These products increasingly highlight their natural origins, low-sugar content, and use of sustainably sourced ingredients to meet growing health-conscious consumer demands.
Key Drivers, Barriers & Challenges in UK Energy Drink Industry
Key Drivers:
- Growing consumer demand for convenient energy boosts.
- Increasing popularity of functional energy drinks, catering to health-conscious consumers.
- Expansion of distribution channels, especially online retail.
- Innovation in product formulation and packaging.
Key Challenges and Restraints:
- Intense competition, particularly from established brands and innovative smaller players.
- Strict regulations regarding sugar content, ingredients, and labeling create difficulties for manufacturers.
- Health concerns associated with high sugar and caffeine intake impact market growth.
- Fluctuating raw material prices can increase production costs. The impact is estimated to be around xx% in the 2025 market.
Emerging Opportunities in UK Energy Drink Industry
- Growing demand for plant-based, natural, and organic energy drinks presents a significant opportunity for manufacturers.
- Expanding into niche markets such as functional energy drinks targeted at specific demographics (athletes, gamers).
- Leveraging e-commerce channels for direct-to-consumer sales.
- Exploring sustainable packaging solutions to address environmental concerns.
Growth Accelerators in the UK Energy Drink Industry
The long-term growth trajectory of the UK energy drink market is propelled by several factors. Strategic partnerships between brands and retailers to enhance distribution and visibility are key to expanding the market reach. Moreover, continuous innovation in product formulations to align with changing consumer preferences, including a focus on health and wellness, will drive future success. Finally, strategic market expansion and new product launches in under-penetrated segments of the market will also act as key growth accelerants.
Key Players Shaping the UK Energy Drink Industry Market
- TSI Consumer Goods GmbH
- PepsiCo Inc
- Max Muscle Nutrition
- Suntory Holdings Limited
- Red Bull GmbH
- The Coca-Cola Company
- Nestle SA
- Global Trade Holdings Co Ltd
- Monster Energy Company
- GlaxoSmithKline PLC
Notable Milestones in UK Energy Drink Industry Sector
- September 2022: Virtue Clean Energy launches its zero-sugar, zero-calorie energy drink in the UK.
- June 2022: Tenzing launches two new plant-based energy shots.
- March 2022: PerfectTed launches a range of canned matcha green tea energy drinks.
In-Depth UK Energy Drink Industry Market Outlook
The UK energy drink market is poised for robust growth over the forecast period. The increasing demand for healthier and functional alternatives presents substantial opportunities for brands to differentiate themselves. Strategic partnerships, innovative product development, and the expansion into emerging distribution channels will be crucial factors in shaping the market's future landscape. The focus on sustainable and ethically sourced ingredients is expected to gain further momentum, influencing the long-term trajectory of this dynamic sector.
UK Energy Drink Industry Segmentation
-
1. Packaging Type
- 1.1. Can
- 1.2. PET Bottle
-
2. Product Type
- 2.1. Drinks
- 2.2. Shots
- 2.3. Mixers
-
3. Distribution Channel
- 3.1. Supermarkets/Hypermarkets
- 3.2. Convenience Stores
- 3.3. Specalist Stores
- 3.4. Online Retail Stores
- 3.5. Other Distribution Channels
UK Energy Drink Industry Segmentation By Geography
-
1. North America
- 1.1. United States
- 1.2. Canada
- 1.3. Mexico
-
2. South America
- 2.1. Brazil
- 2.2. Argentina
- 2.3. Rest of South America
-
3. Europe
- 3.1. United Kingdom
- 3.2. Germany
- 3.3. France
- 3.4. Italy
- 3.5. Spain
- 3.6. Russia
- 3.7. Benelux
- 3.8. Nordics
- 3.9. Rest of Europe
-
4. Middle East & Africa
- 4.1. Turkey
- 4.2. Israel
- 4.3. GCC
- 4.4. North Africa
- 4.5. South Africa
- 4.6. Rest of Middle East & Africa
-
5. Asia Pacific
- 5.1. China
- 5.2. India
- 5.3. Japan
- 5.4. South Korea
- 5.5. ASEAN
- 5.6. Oceania
- 5.7. Rest of Asia Pacific
UK Energy Drink Industry REPORT HIGHLIGHTS
| Aspects | Details |
|---|---|
| Study Period | 2019-2033 |
| Base Year | 2024 |
| Estimated Year | 2025 |
| Forecast Period | 2025-2033 |
| Historical Period | 2019-2024 |
| Growth Rate | CAGR of 4.50% from 2019-2033 |
| Segmentation |
|
Table of Contents
- 1. Introduction
- 1.1. Research Scope
- 1.2. Market Segmentation
- 1.3. Research Methodology
- 1.4. Definitions and Assumptions
- 2. Executive Summary
- 2.1. Introduction
- 3. Market Dynamics
- 3.1. Introduction
- 3.2. Market Drivers
- 3.2.1. Rising Health & Wellness Trends; Strategic Initiatives By Key Players
- 3.3. Market Restrains
- 3.3.1. Cost Considerations Coupled With Availability Of Alternatives
- 3.4. Market Trends
- 3.4.1. The Drinks Segment Dominates the Energy Drink Market
- 4. Market Factor Analysis
- 4.1. Porters Five Forces
- 4.2. Supply/Value Chain
- 4.3. PESTEL analysis
- 4.4. Market Entropy
- 4.5. Patent/Trademark Analysis
- 5. Global UK Energy Drink Industry Analysis, Insights and Forecast, 2019-2031
- 5.1. Market Analysis, Insights and Forecast - by Packaging Type
- 5.1.1. Can
- 5.1.2. PET Bottle
- 5.2. Market Analysis, Insights and Forecast - by Product Type
- 5.2.1. Drinks
- 5.2.2. Shots
- 5.2.3. Mixers
- 5.3. Market Analysis, Insights and Forecast - by Distribution Channel
- 5.3.1. Supermarkets/Hypermarkets
- 5.3.2. Convenience Stores
- 5.3.3. Specalist Stores
- 5.3.4. Online Retail Stores
- 5.3.5. Other Distribution Channels
- 5.4. Market Analysis, Insights and Forecast - by Region
- 5.4.1. North America
- 5.4.2. South America
- 5.4.3. Europe
- 5.4.4. Middle East & Africa
- 5.4.5. Asia Pacific
- 5.1. Market Analysis, Insights and Forecast - by Packaging Type
- 6. North America UK Energy Drink Industry Analysis, Insights and Forecast, 2019-2031
- 6.1. Market Analysis, Insights and Forecast - by Packaging Type
- 6.1.1. Can
- 6.1.2. PET Bottle
- 6.2. Market Analysis, Insights and Forecast - by Product Type
- 6.2.1. Drinks
- 6.2.2. Shots
- 6.2.3. Mixers
- 6.3. Market Analysis, Insights and Forecast - by Distribution Channel
- 6.3.1. Supermarkets/Hypermarkets
- 6.3.2. Convenience Stores
- 6.3.3. Specalist Stores
- 6.3.4. Online Retail Stores
- 6.3.5. Other Distribution Channels
- 6.1. Market Analysis, Insights and Forecast - by Packaging Type
- 7. South America UK Energy Drink Industry Analysis, Insights and Forecast, 2019-2031
- 7.1. Market Analysis, Insights and Forecast - by Packaging Type
- 7.1.1. Can
- 7.1.2. PET Bottle
- 7.2. Market Analysis, Insights and Forecast - by Product Type
- 7.2.1. Drinks
- 7.2.2. Shots
- 7.2.3. Mixers
- 7.3. Market Analysis, Insights and Forecast - by Distribution Channel
- 7.3.1. Supermarkets/Hypermarkets
- 7.3.2. Convenience Stores
- 7.3.3. Specalist Stores
- 7.3.4. Online Retail Stores
- 7.3.5. Other Distribution Channels
- 7.1. Market Analysis, Insights and Forecast - by Packaging Type
- 8. Europe UK Energy Drink Industry Analysis, Insights and Forecast, 2019-2031
- 8.1. Market Analysis, Insights and Forecast - by Packaging Type
- 8.1.1. Can
- 8.1.2. PET Bottle
- 8.2. Market Analysis, Insights and Forecast - by Product Type
- 8.2.1. Drinks
- 8.2.2. Shots
- 8.2.3. Mixers
- 8.3. Market Analysis, Insights and Forecast - by Distribution Channel
- 8.3.1. Supermarkets/Hypermarkets
- 8.3.2. Convenience Stores
- 8.3.3. Specalist Stores
- 8.3.4. Online Retail Stores
- 8.3.5. Other Distribution Channels
- 8.1. Market Analysis, Insights and Forecast - by Packaging Type
- 9. Middle East & Africa UK Energy Drink Industry Analysis, Insights and Forecast, 2019-2031
- 9.1. Market Analysis, Insights and Forecast - by Packaging Type
- 9.1.1. Can
- 9.1.2. PET Bottle
- 9.2. Market Analysis, Insights and Forecast - by Product Type
- 9.2.1. Drinks
- 9.2.2. Shots
- 9.2.3. Mixers
- 9.3. Market Analysis, Insights and Forecast - by Distribution Channel
- 9.3.1. Supermarkets/Hypermarkets
- 9.3.2. Convenience Stores
- 9.3.3. Specalist Stores
- 9.3.4. Online Retail Stores
- 9.3.5. Other Distribution Channels
- 9.1. Market Analysis, Insights and Forecast - by Packaging Type
- 10. Asia Pacific UK Energy Drink Industry Analysis, Insights and Forecast, 2019-2031
- 10.1. Market Analysis, Insights and Forecast - by Packaging Type
- 10.1.1. Can
- 10.1.2. PET Bottle
- 10.2. Market Analysis, Insights and Forecast - by Product Type
- 10.2.1. Drinks
- 10.2.2. Shots
- 10.2.3. Mixers
- 10.3. Market Analysis, Insights and Forecast - by Distribution Channel
- 10.3.1. Supermarkets/Hypermarkets
- 10.3.2. Convenience Stores
- 10.3.3. Specalist Stores
- 10.3.4. Online Retail Stores
- 10.3.5. Other Distribution Channels
- 10.1. Market Analysis, Insights and Forecast - by Packaging Type
- 11. England UK Energy Drink Industry Analysis, Insights and Forecast, 2019-2031
- 12. Wales UK Energy Drink Industry Analysis, Insights and Forecast, 2019-2031
- 13. Scotland UK Energy Drink Industry Analysis, Insights and Forecast, 2019-2031
- 14. Northern UK Energy Drink Industry Analysis, Insights and Forecast, 2019-2031
- 15. Ireland UK Energy Drink Industry Analysis, Insights and Forecast, 2019-2031
- 16. Competitive Analysis
- 16.1. Global Market Share Analysis 2024
- 16.2. Company Profiles
- 16.2.1 TSI Consumer Goods GmbH
- 16.2.1.1. Overview
- 16.2.1.2. Products
- 16.2.1.3. SWOT Analysis
- 16.2.1.4. Recent Developments
- 16.2.1.5. Financials (Based on Availability)
- 16.2.2 PepsiCo Inc
- 16.2.2.1. Overview
- 16.2.2.2. Products
- 16.2.2.3. SWOT Analysis
- 16.2.2.4. Recent Developments
- 16.2.2.5. Financials (Based on Availability)
- 16.2.3 Max Muscle Nutrition
- 16.2.3.1. Overview
- 16.2.3.2. Products
- 16.2.3.3. SWOT Analysis
- 16.2.3.4. Recent Developments
- 16.2.3.5. Financials (Based on Availability)
- 16.2.4 Suntory Holdings Limited
- 16.2.4.1. Overview
- 16.2.4.2. Products
- 16.2.4.3. SWOT Analysis
- 16.2.4.4. Recent Developments
- 16.2.4.5. Financials (Based on Availability)
- 16.2.5 Red Bull GmbH
- 16.2.5.1. Overview
- 16.2.5.2. Products
- 16.2.5.3. SWOT Analysis
- 16.2.5.4. Recent Developments
- 16.2.5.5. Financials (Based on Availability)
- 16.2.6 The Coca-Cola Company
- 16.2.6.1. Overview
- 16.2.6.2. Products
- 16.2.6.3. SWOT Analysis
- 16.2.6.4. Recent Developments
- 16.2.6.5. Financials (Based on Availability)
- 16.2.7 Nestle SA*List Not Exhaustive
- 16.2.7.1. Overview
- 16.2.7.2. Products
- 16.2.7.3. SWOT Analysis
- 16.2.7.4. Recent Developments
- 16.2.7.5. Financials (Based on Availability)
- 16.2.8 Global Trade Holdings Co Ltd
- 16.2.8.1. Overview
- 16.2.8.2. Products
- 16.2.8.3. SWOT Analysis
- 16.2.8.4. Recent Developments
- 16.2.8.5. Financials (Based on Availability)
- 16.2.9 Monster Energy Company
- 16.2.9.1. Overview
- 16.2.9.2. Products
- 16.2.9.3. SWOT Analysis
- 16.2.9.4. Recent Developments
- 16.2.9.5. Financials (Based on Availability)
- 16.2.10 GlaxoSmithKline PLC
- 16.2.10.1. Overview
- 16.2.10.2. Products
- 16.2.10.3. SWOT Analysis
- 16.2.10.4. Recent Developments
- 16.2.10.5. Financials (Based on Availability)
- 16.2.1 TSI Consumer Goods GmbH
List of Figures
- Figure 1: Global UK Energy Drink Industry Revenue Breakdown (Million, %) by Region 2024 & 2032
- Figure 2: Global UK Energy Drink Industry Volume Breakdown (K Liters, %) by Region 2024 & 2032
- Figure 3: United kingdom Region UK Energy Drink Industry Revenue (Million), by Country 2024 & 2032
- Figure 4: United kingdom Region UK Energy Drink Industry Volume (K Liters), by Country 2024 & 2032
- Figure 5: United kingdom Region UK Energy Drink Industry Revenue Share (%), by Country 2024 & 2032
- Figure 6: United kingdom Region UK Energy Drink Industry Volume Share (%), by Country 2024 & 2032
- Figure 7: North America UK Energy Drink Industry Revenue (Million), by Packaging Type 2024 & 2032
- Figure 8: North America UK Energy Drink Industry Volume (K Liters), by Packaging Type 2024 & 2032
- Figure 9: North America UK Energy Drink Industry Revenue Share (%), by Packaging Type 2024 & 2032
- Figure 10: North America UK Energy Drink Industry Volume Share (%), by Packaging Type 2024 & 2032
- Figure 11: North America UK Energy Drink Industry Revenue (Million), by Product Type 2024 & 2032
- Figure 12: North America UK Energy Drink Industry Volume (K Liters), by Product Type 2024 & 2032
- Figure 13: North America UK Energy Drink Industry Revenue Share (%), by Product Type 2024 & 2032
- Figure 14: North America UK Energy Drink Industry Volume Share (%), by Product Type 2024 & 2032
- Figure 15: North America UK Energy Drink Industry Revenue (Million), by Distribution Channel 2024 & 2032
- Figure 16: North America UK Energy Drink Industry Volume (K Liters), by Distribution Channel 2024 & 2032
- Figure 17: North America UK Energy Drink Industry Revenue Share (%), by Distribution Channel 2024 & 2032
- Figure 18: North America UK Energy Drink Industry Volume Share (%), by Distribution Channel 2024 & 2032
- Figure 19: North America UK Energy Drink Industry Revenue (Million), by Country 2024 & 2032
- Figure 20: North America UK Energy Drink Industry Volume (K Liters), by Country 2024 & 2032
- Figure 21: North America UK Energy Drink Industry Revenue Share (%), by Country 2024 & 2032
- Figure 22: North America UK Energy Drink Industry Volume Share (%), by Country 2024 & 2032
- Figure 23: South America UK Energy Drink Industry Revenue (Million), by Packaging Type 2024 & 2032
- Figure 24: South America UK Energy Drink Industry Volume (K Liters), by Packaging Type 2024 & 2032
- Figure 25: South America UK Energy Drink Industry Revenue Share (%), by Packaging Type 2024 & 2032
- Figure 26: South America UK Energy Drink Industry Volume Share (%), by Packaging Type 2024 & 2032
- Figure 27: South America UK Energy Drink Industry Revenue (Million), by Product Type 2024 & 2032
- Figure 28: South America UK Energy Drink Industry Volume (K Liters), by Product Type 2024 & 2032
- Figure 29: South America UK Energy Drink Industry Revenue Share (%), by Product Type 2024 & 2032
- Figure 30: South America UK Energy Drink Industry Volume Share (%), by Product Type 2024 & 2032
- Figure 31: South America UK Energy Drink Industry Revenue (Million), by Distribution Channel 2024 & 2032
- Figure 32: South America UK Energy Drink Industry Volume (K Liters), by Distribution Channel 2024 & 2032
- Figure 33: South America UK Energy Drink Industry Revenue Share (%), by Distribution Channel 2024 & 2032
- Figure 34: South America UK Energy Drink Industry Volume Share (%), by Distribution Channel 2024 & 2032
- Figure 35: South America UK Energy Drink Industry Revenue (Million), by Country 2024 & 2032
- Figure 36: South America UK Energy Drink Industry Volume (K Liters), by Country 2024 & 2032
- Figure 37: South America UK Energy Drink Industry Revenue Share (%), by Country 2024 & 2032
- Figure 38: South America UK Energy Drink Industry Volume Share (%), by Country 2024 & 2032
- Figure 39: Europe UK Energy Drink Industry Revenue (Million), by Packaging Type 2024 & 2032
- Figure 40: Europe UK Energy Drink Industry Volume (K Liters), by Packaging Type 2024 & 2032
- Figure 41: Europe UK Energy Drink Industry Revenue Share (%), by Packaging Type 2024 & 2032
- Figure 42: Europe UK Energy Drink Industry Volume Share (%), by Packaging Type 2024 & 2032
- Figure 43: Europe UK Energy Drink Industry Revenue (Million), by Product Type 2024 & 2032
- Figure 44: Europe UK Energy Drink Industry Volume (K Liters), by Product Type 2024 & 2032
- Figure 45: Europe UK Energy Drink Industry Revenue Share (%), by Product Type 2024 & 2032
- Figure 46: Europe UK Energy Drink Industry Volume Share (%), by Product Type 2024 & 2032
- Figure 47: Europe UK Energy Drink Industry Revenue (Million), by Distribution Channel 2024 & 2032
- Figure 48: Europe UK Energy Drink Industry Volume (K Liters), by Distribution Channel 2024 & 2032
- Figure 49: Europe UK Energy Drink Industry Revenue Share (%), by Distribution Channel 2024 & 2032
- Figure 50: Europe UK Energy Drink Industry Volume Share (%), by Distribution Channel 2024 & 2032
- Figure 51: Europe UK Energy Drink Industry Revenue (Million), by Country 2024 & 2032
- Figure 52: Europe UK Energy Drink Industry Volume (K Liters), by Country 2024 & 2032
- Figure 53: Europe UK Energy Drink Industry Revenue Share (%), by Country 2024 & 2032
- Figure 54: Europe UK Energy Drink Industry Volume Share (%), by Country 2024 & 2032
- Figure 55: Middle East & Africa UK Energy Drink Industry Revenue (Million), by Packaging Type 2024 & 2032
- Figure 56: Middle East & Africa UK Energy Drink Industry Volume (K Liters), by Packaging Type 2024 & 2032
- Figure 57: Middle East & Africa UK Energy Drink Industry Revenue Share (%), by Packaging Type 2024 & 2032
- Figure 58: Middle East & Africa UK Energy Drink Industry Volume Share (%), by Packaging Type 2024 & 2032
- Figure 59: Middle East & Africa UK Energy Drink Industry Revenue (Million), by Product Type 2024 & 2032
- Figure 60: Middle East & Africa UK Energy Drink Industry Volume (K Liters), by Product Type 2024 & 2032
- Figure 61: Middle East & Africa UK Energy Drink Industry Revenue Share (%), by Product Type 2024 & 2032
- Figure 62: Middle East & Africa UK Energy Drink Industry Volume Share (%), by Product Type 2024 & 2032
- Figure 63: Middle East & Africa UK Energy Drink Industry Revenue (Million), by Distribution Channel 2024 & 2032
- Figure 64: Middle East & Africa UK Energy Drink Industry Volume (K Liters), by Distribution Channel 2024 & 2032
- Figure 65: Middle East & Africa UK Energy Drink Industry Revenue Share (%), by Distribution Channel 2024 & 2032
- Figure 66: Middle East & Africa UK Energy Drink Industry Volume Share (%), by Distribution Channel 2024 & 2032
- Figure 67: Middle East & Africa UK Energy Drink Industry Revenue (Million), by Country 2024 & 2032
- Figure 68: Middle East & Africa UK Energy Drink Industry Volume (K Liters), by Country 2024 & 2032
- Figure 69: Middle East & Africa UK Energy Drink Industry Revenue Share (%), by Country 2024 & 2032
- Figure 70: Middle East & Africa UK Energy Drink Industry Volume Share (%), by Country 2024 & 2032
- Figure 71: Asia Pacific UK Energy Drink Industry Revenue (Million), by Packaging Type 2024 & 2032
- Figure 72: Asia Pacific UK Energy Drink Industry Volume (K Liters), by Packaging Type 2024 & 2032
- Figure 73: Asia Pacific UK Energy Drink Industry Revenue Share (%), by Packaging Type 2024 & 2032
- Figure 74: Asia Pacific UK Energy Drink Industry Volume Share (%), by Packaging Type 2024 & 2032
- Figure 75: Asia Pacific UK Energy Drink Industry Revenue (Million), by Product Type 2024 & 2032
- Figure 76: Asia Pacific UK Energy Drink Industry Volume (K Liters), by Product Type 2024 & 2032
- Figure 77: Asia Pacific UK Energy Drink Industry Revenue Share (%), by Product Type 2024 & 2032
- Figure 78: Asia Pacific UK Energy Drink Industry Volume Share (%), by Product Type 2024 & 2032
- Figure 79: Asia Pacific UK Energy Drink Industry Revenue (Million), by Distribution Channel 2024 & 2032
- Figure 80: Asia Pacific UK Energy Drink Industry Volume (K Liters), by Distribution Channel 2024 & 2032
- Figure 81: Asia Pacific UK Energy Drink Industry Revenue Share (%), by Distribution Channel 2024 & 2032
- Figure 82: Asia Pacific UK Energy Drink Industry Volume Share (%), by Distribution Channel 2024 & 2032
- Figure 83: Asia Pacific UK Energy Drink Industry Revenue (Million), by Country 2024 & 2032
- Figure 84: Asia Pacific UK Energy Drink Industry Volume (K Liters), by Country 2024 & 2032
- Figure 85: Asia Pacific UK Energy Drink Industry Revenue Share (%), by Country 2024 & 2032
- Figure 86: Asia Pacific UK Energy Drink Industry Volume Share (%), by Country 2024 & 2032
List of Tables
- Table 1: Global UK Energy Drink Industry Revenue Million Forecast, by Region 2019 & 2032
- Table 2: Global UK Energy Drink Industry Volume K Liters Forecast, by Region 2019 & 2032
- Table 3: Global UK Energy Drink Industry Revenue Million Forecast, by Packaging Type 2019 & 2032
- Table 4: Global UK Energy Drink Industry Volume K Liters Forecast, by Packaging Type 2019 & 2032
- Table 5: Global UK Energy Drink Industry Revenue Million Forecast, by Product Type 2019 & 2032
- Table 6: Global UK Energy Drink Industry Volume K Liters Forecast, by Product Type 2019 & 2032
- Table 7: Global UK Energy Drink Industry Revenue Million Forecast, by Distribution Channel 2019 & 2032
- Table 8: Global UK Energy Drink Industry Volume K Liters Forecast, by Distribution Channel 2019 & 2032
- Table 9: Global UK Energy Drink Industry Revenue Million Forecast, by Region 2019 & 2032
- Table 10: Global UK Energy Drink Industry Volume K Liters Forecast, by Region 2019 & 2032
- Table 11: Global UK Energy Drink Industry Revenue Million Forecast, by Country 2019 & 2032
- Table 12: Global UK Energy Drink Industry Volume K Liters Forecast, by Country 2019 & 2032
- Table 13: England UK Energy Drink Industry Revenue (Million) Forecast, by Application 2019 & 2032
- Table 14: England UK Energy Drink Industry Volume (K Liters) Forecast, by Application 2019 & 2032
- Table 15: Wales UK Energy Drink Industry Revenue (Million) Forecast, by Application 2019 & 2032
- Table 16: Wales UK Energy Drink Industry Volume (K Liters) Forecast, by Application 2019 & 2032
- Table 17: Scotland UK Energy Drink Industry Revenue (Million) Forecast, by Application 2019 & 2032
- Table 18: Scotland UK Energy Drink Industry Volume (K Liters) Forecast, by Application 2019 & 2032
- Table 19: Northern UK Energy Drink Industry Revenue (Million) Forecast, by Application 2019 & 2032
- Table 20: Northern UK Energy Drink Industry Volume (K Liters) Forecast, by Application 2019 & 2032
- Table 21: Ireland UK Energy Drink Industry Revenue (Million) Forecast, by Application 2019 & 2032
- Table 22: Ireland UK Energy Drink Industry Volume (K Liters) Forecast, by Application 2019 & 2032
- Table 23: Global UK Energy Drink Industry Revenue Million Forecast, by Packaging Type 2019 & 2032
- Table 24: Global UK Energy Drink Industry Volume K Liters Forecast, by Packaging Type 2019 & 2032
- Table 25: Global UK Energy Drink Industry Revenue Million Forecast, by Product Type 2019 & 2032
- Table 26: Global UK Energy Drink Industry Volume K Liters Forecast, by Product Type 2019 & 2032
- Table 27: Global UK Energy Drink Industry Revenue Million Forecast, by Distribution Channel 2019 & 2032
- Table 28: Global UK Energy Drink Industry Volume K Liters Forecast, by Distribution Channel 2019 & 2032
- Table 29: Global UK Energy Drink Industry Revenue Million Forecast, by Country 2019 & 2032
- Table 30: Global UK Energy Drink Industry Volume K Liters Forecast, by Country 2019 & 2032
- Table 31: United States UK Energy Drink Industry Revenue (Million) Forecast, by Application 2019 & 2032
- Table 32: United States UK Energy Drink Industry Volume (K Liters) Forecast, by Application 2019 & 2032
- Table 33: Canada UK Energy Drink Industry Revenue (Million) Forecast, by Application 2019 & 2032
- Table 34: Canada UK Energy Drink Industry Volume (K Liters) Forecast, by Application 2019 & 2032
- Table 35: Mexico UK Energy Drink Industry Revenue (Million) Forecast, by Application 2019 & 2032
- Table 36: Mexico UK Energy Drink Industry Volume (K Liters) Forecast, by Application 2019 & 2032
- Table 37: Global UK Energy Drink Industry Revenue Million Forecast, by Packaging Type 2019 & 2032
- Table 38: Global UK Energy Drink Industry Volume K Liters Forecast, by Packaging Type 2019 & 2032
- Table 39: Global UK Energy Drink Industry Revenue Million Forecast, by Product Type 2019 & 2032
- Table 40: Global UK Energy Drink Industry Volume K Liters Forecast, by Product Type 2019 & 2032
- Table 41: Global UK Energy Drink Industry Revenue Million Forecast, by Distribution Channel 2019 & 2032
- Table 42: Global UK Energy Drink Industry Volume K Liters Forecast, by Distribution Channel 2019 & 2032
- Table 43: Global UK Energy Drink Industry Revenue Million Forecast, by Country 2019 & 2032
- Table 44: Global UK Energy Drink Industry Volume K Liters Forecast, by Country 2019 & 2032
- Table 45: Brazil UK Energy Drink Industry Revenue (Million) Forecast, by Application 2019 & 2032
- Table 46: Brazil UK Energy Drink Industry Volume (K Liters) Forecast, by Application 2019 & 2032
- Table 47: Argentina UK Energy Drink Industry Revenue (Million) Forecast, by Application 2019 & 2032
- Table 48: Argentina UK Energy Drink Industry Volume (K Liters) Forecast, by Application 2019 & 2032
- Table 49: Rest of South America UK Energy Drink Industry Revenue (Million) Forecast, by Application 2019 & 2032
- Table 50: Rest of South America UK Energy Drink Industry Volume (K Liters) Forecast, by Application 2019 & 2032
- Table 51: Global UK Energy Drink Industry Revenue Million Forecast, by Packaging Type 2019 & 2032
- Table 52: Global UK Energy Drink Industry Volume K Liters Forecast, by Packaging Type 2019 & 2032
- Table 53: Global UK Energy Drink Industry Revenue Million Forecast, by Product Type 2019 & 2032
- Table 54: Global UK Energy Drink Industry Volume K Liters Forecast, by Product Type 2019 & 2032
- Table 55: Global UK Energy Drink Industry Revenue Million Forecast, by Distribution Channel 2019 & 2032
- Table 56: Global UK Energy Drink Industry Volume K Liters Forecast, by Distribution Channel 2019 & 2032
- Table 57: Global UK Energy Drink Industry Revenue Million Forecast, by Country 2019 & 2032
- Table 58: Global UK Energy Drink Industry Volume K Liters Forecast, by Country 2019 & 2032
- Table 59: United Kingdom UK Energy Drink Industry Revenue (Million) Forecast, by Application 2019 & 2032
- Table 60: United Kingdom UK Energy Drink Industry Volume (K Liters) Forecast, by Application 2019 & 2032
- Table 61: Germany UK Energy Drink Industry Revenue (Million) Forecast, by Application 2019 & 2032
- Table 62: Germany UK Energy Drink Industry Volume (K Liters) Forecast, by Application 2019 & 2032
- Table 63: France UK Energy Drink Industry Revenue (Million) Forecast, by Application 2019 & 2032
- Table 64: France UK Energy Drink Industry Volume (K Liters) Forecast, by Application 2019 & 2032
- Table 65: Italy UK Energy Drink Industry Revenue (Million) Forecast, by Application 2019 & 2032
- Table 66: Italy UK Energy Drink Industry Volume (K Liters) Forecast, by Application 2019 & 2032
- Table 67: Spain UK Energy Drink Industry Revenue (Million) Forecast, by Application 2019 & 2032
- Table 68: Spain UK Energy Drink Industry Volume (K Liters) Forecast, by Application 2019 & 2032
- Table 69: Russia UK Energy Drink Industry Revenue (Million) Forecast, by Application 2019 & 2032
- Table 70: Russia UK Energy Drink Industry Volume (K Liters) Forecast, by Application 2019 & 2032
- Table 71: Benelux UK Energy Drink Industry Revenue (Million) Forecast, by Application 2019 & 2032
- Table 72: Benelux UK Energy Drink Industry Volume (K Liters) Forecast, by Application 2019 & 2032
- Table 73: Nordics UK Energy Drink Industry Revenue (Million) Forecast, by Application 2019 & 2032
- Table 74: Nordics UK Energy Drink Industry Volume (K Liters) Forecast, by Application 2019 & 2032
- Table 75: Rest of Europe UK Energy Drink Industry Revenue (Million) Forecast, by Application 2019 & 2032
- Table 76: Rest of Europe UK Energy Drink Industry Volume (K Liters) Forecast, by Application 2019 & 2032
- Table 77: Global UK Energy Drink Industry Revenue Million Forecast, by Packaging Type 2019 & 2032
- Table 78: Global UK Energy Drink Industry Volume K Liters Forecast, by Packaging Type 2019 & 2032
- Table 79: Global UK Energy Drink Industry Revenue Million Forecast, by Product Type 2019 & 2032
- Table 80: Global UK Energy Drink Industry Volume K Liters Forecast, by Product Type 2019 & 2032
- Table 81: Global UK Energy Drink Industry Revenue Million Forecast, by Distribution Channel 2019 & 2032
- Table 82: Global UK Energy Drink Industry Volume K Liters Forecast, by Distribution Channel 2019 & 2032
- Table 83: Global UK Energy Drink Industry Revenue Million Forecast, by Country 2019 & 2032
- Table 84: Global UK Energy Drink Industry Volume K Liters Forecast, by Country 2019 & 2032
- Table 85: Turkey UK Energy Drink Industry Revenue (Million) Forecast, by Application 2019 & 2032
- Table 86: Turkey UK Energy Drink Industry Volume (K Liters) Forecast, by Application 2019 & 2032
- Table 87: Israel UK Energy Drink Industry Revenue (Million) Forecast, by Application 2019 & 2032
- Table 88: Israel UK Energy Drink Industry Volume (K Liters) Forecast, by Application 2019 & 2032
- Table 89: GCC UK Energy Drink Industry Revenue (Million) Forecast, by Application 2019 & 2032
- Table 90: GCC UK Energy Drink Industry Volume (K Liters) Forecast, by Application 2019 & 2032
- Table 91: North Africa UK Energy Drink Industry Revenue (Million) Forecast, by Application 2019 & 2032
- Table 92: North Africa UK Energy Drink Industry Volume (K Liters) Forecast, by Application 2019 & 2032
- Table 93: South Africa UK Energy Drink Industry Revenue (Million) Forecast, by Application 2019 & 2032
- Table 94: South Africa UK Energy Drink Industry Volume (K Liters) Forecast, by Application 2019 & 2032
- Table 95: Rest of Middle East & Africa UK Energy Drink Industry Revenue (Million) Forecast, by Application 2019 & 2032
- Table 96: Rest of Middle East & Africa UK Energy Drink Industry Volume (K Liters) Forecast, by Application 2019 & 2032
- Table 97: Global UK Energy Drink Industry Revenue Million Forecast, by Packaging Type 2019 & 2032
- Table 98: Global UK Energy Drink Industry Volume K Liters Forecast, by Packaging Type 2019 & 2032
- Table 99: Global UK Energy Drink Industry Revenue Million Forecast, by Product Type 2019 & 2032
- Table 100: Global UK Energy Drink Industry Volume K Liters Forecast, by Product Type 2019 & 2032
- Table 101: Global UK Energy Drink Industry Revenue Million Forecast, by Distribution Channel 2019 & 2032
- Table 102: Global UK Energy Drink Industry Volume K Liters Forecast, by Distribution Channel 2019 & 2032
- Table 103: Global UK Energy Drink Industry Revenue Million Forecast, by Country 2019 & 2032
- Table 104: Global UK Energy Drink Industry Volume K Liters Forecast, by Country 2019 & 2032
- Table 105: China UK Energy Drink Industry Revenue (Million) Forecast, by Application 2019 & 2032
- Table 106: China UK Energy Drink Industry Volume (K Liters) Forecast, by Application 2019 & 2032
- Table 107: India UK Energy Drink Industry Revenue (Million) Forecast, by Application 2019 & 2032
- Table 108: India UK Energy Drink Industry Volume (K Liters) Forecast, by Application 2019 & 2032
- Table 109: Japan UK Energy Drink Industry Revenue (Million) Forecast, by Application 2019 & 2032
- Table 110: Japan UK Energy Drink Industry Volume (K Liters) Forecast, by Application 2019 & 2032
- Table 111: South Korea UK Energy Drink Industry Revenue (Million) Forecast, by Application 2019 & 2032
- Table 112: South Korea UK Energy Drink Industry Volume (K Liters) Forecast, by Application 2019 & 2032
- Table 113: ASEAN UK Energy Drink Industry Revenue (Million) Forecast, by Application 2019 & 2032
- Table 114: ASEAN UK Energy Drink Industry Volume (K Liters) Forecast, by Application 2019 & 2032
- Table 115: Oceania UK Energy Drink Industry Revenue (Million) Forecast, by Application 2019 & 2032
- Table 116: Oceania UK Energy Drink Industry Volume (K Liters) Forecast, by Application 2019 & 2032
- Table 117: Rest of Asia Pacific UK Energy Drink Industry Revenue (Million) Forecast, by Application 2019 & 2032
- Table 118: Rest of Asia Pacific UK Energy Drink Industry Volume (K Liters) Forecast, by Application 2019 & 2032
Frequently Asked Questions
1. What is the projected Compound Annual Growth Rate (CAGR) of the UK Energy Drink Industry?
The projected CAGR is approximately 4.50%.
2. Which companies are prominent players in the UK Energy Drink Industry?
Key companies in the market include TSI Consumer Goods GmbH, PepsiCo Inc, Max Muscle Nutrition, Suntory Holdings Limited, Red Bull GmbH, The Coca-Cola Company, Nestle SA*List Not Exhaustive, Global Trade Holdings Co Ltd, Monster Energy Company, GlaxoSmithKline PLC.
3. What are the main segments of the UK Energy Drink Industry?
The market segments include Packaging Type, Product Type, Distribution Channel.
4. Can you provide details about the market size?
The market size is estimated to be USD XX Million as of 2022.
5. What are some drivers contributing to market growth?
Rising Health & Wellness Trends; Strategic Initiatives By Key Players.
6. What are the notable trends driving market growth?
The Drinks Segment Dominates the Energy Drink Market.
7. Are there any restraints impacting market growth?
Cost Considerations Coupled With Availability Of Alternatives.
8. Can you provide examples of recent developments in the market?
In September 2022, Virtue Clean Energy, the brand that creates clean alternatives in the energy drink category, launched its newest product, Virtue Clean Energy in the United Kingdom. Virtue Drinks contain zero sugar & zero calories, made with all-natural ingredients. It has 80mg of 100% organic caffeine derived from green coffee beans, plus B vitamins (B3, B6, B7, B12).
9. What pricing options are available for accessing the report?
Pricing options include single-user, multi-user, and enterprise licenses priced at USD 3800, USD 4500, and USD 5800 respectively.
10. Is the market size provided in terms of value or volume?
The market size is provided in terms of value, measured in Million and volume, measured in K Liters.
11. Are there any specific market keywords associated with the report?
Yes, the market keyword associated with the report is "UK Energy Drink Industry," which aids in identifying and referencing the specific market segment covered.
12. How do I determine which pricing option suits my needs best?
The pricing options vary based on user requirements and access needs. Individual users may opt for single-user licenses, while businesses requiring broader access may choose multi-user or enterprise licenses for cost-effective access to the report.
13. Are there any additional resources or data provided in the UK Energy Drink Industry report?
While the report offers comprehensive insights, it's advisable to review the specific contents or supplementary materials provided to ascertain if additional resources or data are available.
14. How can I stay updated on further developments or reports in the UK Energy Drink Industry?
To stay informed about further developments, trends, and reports in the UK Energy Drink Industry, consider subscribing to industry newsletters, following relevant companies and organizations, or regularly checking reputable industry news sources and publications.
Methodology
Step 1 - Identification of Relevant Samples Size from Population Database


Step 2 - Approaches for Defining Global Market Size (Value, Volume* & Price*)

Note*: In applicable scenarios
Step 3 - Data Sources
Primary Research
- Web Analytics
- Survey Reports
- Research Institute
- Latest Research Reports
- Opinion Leaders
Secondary Research
- Annual Reports
- White Paper
- Latest Press Release
- Industry Association
- Paid Database
- Investor Presentations

Step 4 - Data Triangulation
Involves using different sources of information in order to increase the validity of a study
These sources are likely to be stakeholders in a program - participants, other researchers, program staff, other community members, and so on.
Then we put all data in single framework & apply various statistical tools to find out the dynamic on the market.
During the analysis stage, feedback from the stakeholder groups would be compared to determine areas of agreement as well as areas of divergence
