

Key Insights
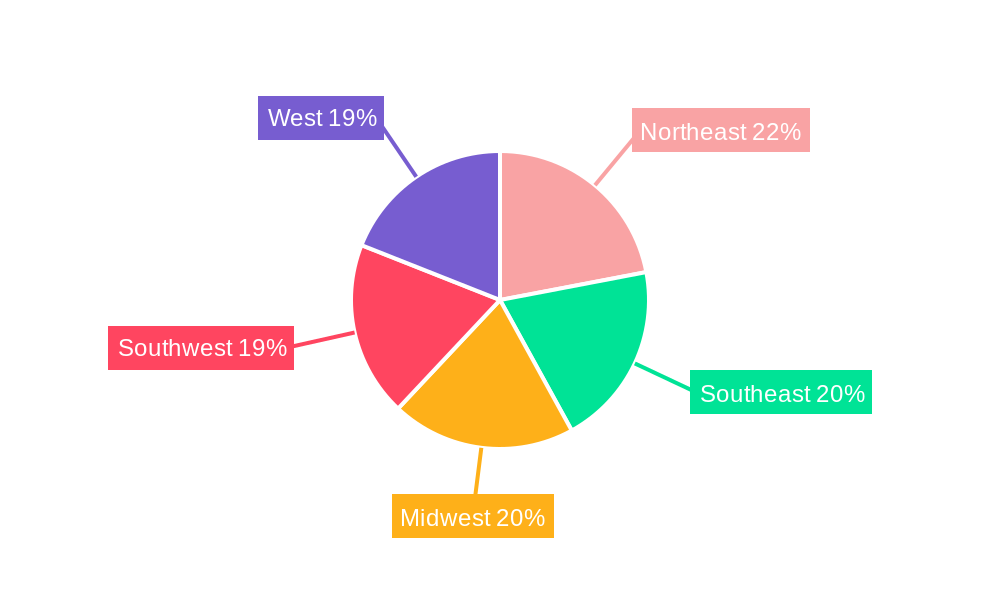
The US sustainable home furniture market is experiencing robust growth, driven by increasing consumer awareness of environmental issues and a rising preference for eco-friendly products. The market's Compound Annual Growth Rate (CAGR) exceeding 5% since 2019 indicates a significant upward trajectory projected to continue through 2033. Key drivers include the growing popularity of sustainable and ethically sourced materials like bamboo and reclaimed wood, coupled with a shift towards minimalist and multi-functional furniture designs that reduce waste. Consumers are increasingly willing to pay a premium for furniture that aligns with their values, creating a strong demand for products with certifications like Forest Stewardship Council (FSC) and Global Organic Textile Standard (GOTS). The online distribution channel is witnessing faster growth than offline channels, reflecting changing consumer shopping habits and the increasing accessibility of sustainable furniture options through e-commerce platforms. Segmentation by application reveals strong demand within the home furniture category, while the hospitality and office sectors are also experiencing gradual adoption of sustainable practices. Leading companies like Inter IKEA Systems B.V., Williams-Sonoma Inc., and Wayfair Inc. are actively integrating sustainable practices into their product lines and supply chains, further fueling market expansion. The market's regional performance across the United States shows relatively even distribution across the Northeast, Southeast, Midwest, Southwest and West regions, with potential for localized variations depending on specific consumer preferences and regional initiatives promoting sustainable living.
This market's future growth hinges on several factors. Continued innovation in sustainable materials and manufacturing processes will be crucial. Government policies promoting sustainable practices and incentives for eco-friendly furniture purchases could significantly accelerate market expansion. Addressing potential restraints such as the higher cost of sustainable materials compared to conventional options will require ongoing efforts to improve efficiency and create more affordable alternatives. The market's long-term success depends on maintaining transparency and credibility regarding sustainability claims, ensuring consumer trust and building strong brand loyalty. Furthermore, educating consumers on the lifecycle impacts of furniture and promoting responsible disposal methods will be essential for maximizing the environmental benefits of this burgeoning market.

US Sustainable Home Furniture Market: A Comprehensive Report (2019-2033)
This comprehensive report provides an in-depth analysis of the US Sustainable Home Furniture Market, offering invaluable insights for industry professionals, investors, and strategic decision-makers. Focusing on the parent market of Home Furniture and its child market of Sustainable Home Furniture, this study covers market dynamics, growth trends, competitive landscapes, and future opportunities. The report projects a market size of xx Million units by 2033.
US Sustainable Home Furniture Market Dynamics & Structure
This section analyzes the intricate structure of the US Sustainable Home Furniture market, examining market concentration, innovation drivers, regulatory landscapes, competitive substitutes, consumer demographics, and mergers & acquisitions (M&A) activity. The market is characterized by a moderately fragmented landscape, with key players vying for market share.
- Market Concentration: The market exhibits moderate concentration, with the top 5 players holding approximately xx% of the market share in 2024.
- Technological Innovation: Advancements in sustainable materials (bamboo, PET, recycled wood) and manufacturing processes are driving market growth. However, high initial investment costs pose a barrier to entry for some players.
- Regulatory Framework: Increasingly stringent environmental regulations are pushing manufacturers to adopt sustainable practices, creating both opportunities and challenges. The impact of the xx Act on the market is analyzed.
- Competitive Substitutes: Traditional furniture made from unsustainable materials represents a major competitive threat, demanding continuous innovation in sustainability and cost-effectiveness.
- End-User Demographics: Growing environmental awareness among millennials and Gen Z is significantly driving the demand for sustainable furniture. Shifting consumer preferences towards ethically sourced products are explored.
- M&A Trends: The past five years have seen xx M&A deals in the sustainable home furniture sector, indicating consolidation and strategic expansion within the industry.
US Sustainable Home Furniture Market Growth Trends & Insights
This section leverages extensive market research data to analyze the evolution of the US Sustainable Home Furniture market size, adoption rates, technological disruptions, and shifting consumer behaviors. The market is experiencing robust growth, driven by increasing consumer demand for eco-friendly products and rising environmental awareness.
The market exhibited a CAGR of xx% during the historical period (2019-2024) and is projected to grow at a CAGR of xx% during the forecast period (2025-2033). Market penetration of sustainable home furniture is estimated at xx% in 2025, expected to reach xx% by 2033. Technological advancements in sustainable materials and manufacturing techniques are key growth drivers. Moreover, changing consumer preferences towards eco-conscious lifestyle choices continue to fuel market expansion. Detailed analysis of regional variations in growth rates and market penetration is also provided.

Dominant Regions, Countries, or Segments in US Sustainable Home Furniture Market
This section pinpoints the leading regions, countries, and market segments within the US Sustainable Home Furniture market. Analysis reveals the dominance of specific regions and distribution channels.
By Distribution Channel: The online channel is experiencing faster growth, fueled by the ease of access and broader reach. However, the offline channel remains significant due to the tangible nature of furniture products.
By Application: The Home Furniture segment dominates the market, accounting for approximately xx% of the market share in 2025.
By Material: Wood remains the most prevalent material, followed by Bamboo, and then PET.
- Key Drivers (California): Strong environmental regulations, high consumer awareness, and a robust e-commerce infrastructure contribute to California's market leadership.
- Growth Potential (Texas): Texas shows high growth potential, driven by population growth, increasing disposable incomes, and expanding e-commerce penetration.
US Sustainable Home Furniture Market Product Landscape
The US sustainable home furniture market showcases a wide range of products made from sustainable materials such as reclaimed wood, bamboo, and recycled PET. These products are characterized by their durability, aesthetic appeal, and environmental friendliness. Innovation is focused on developing more sustainable materials, enhancing manufacturing processes, and improving product design to meet evolving consumer demands.
Key Drivers, Barriers & Challenges in US Sustainable Home Furniture Market
Key Drivers: Growing consumer awareness of environmental issues, stringent government regulations promoting sustainable practices, and technological advancements in sustainable materials are driving market growth.
Challenges: High production costs compared to traditional furniture, limited availability of sustainable materials, and supply chain complexities pose significant challenges to market expansion. These challenges are analyzed with specific quantifiable impacts on market growth.
Emerging Opportunities in US Sustainable Home Furniture Market
Untapped opportunities exist in expanding into rural markets and underserved communities with targeted marketing strategies. Innovative product design utilizing recycled materials also presents significant potential. Furthermore, tailoring products to specific lifestyles and sustainable living trends can create new market segments.
Growth Accelerators in the US Sustainable Home Furniture Market Industry
Technological breakthroughs in sustainable materials science, strategic partnerships between furniture manufacturers and sustainable material suppliers, and expansion into new geographical markets are expected to propel market growth. Efficient supply chain management and circular economy initiatives will also play a crucial role.
Key Players Shaping the US Sustainable Home Furniture Market Market
- Inter IKEA Systems B.V.
- Interior Systems Inc
- Global Furniture Group
- Kimball International Inc
- Steelcase
- HNI Corporation
- Williams-Sonoma Inc
- Okamura Corp
- Herman Miller Inc
- Wayfair Inc
- Ashley Furniture
- Haworth
- Bed Bath & Beyond Inc
Notable Milestones in US Sustainable Home Furniture Market Sector
- April 2021: Wayfair Inc. announces plans to open three new engineering sites, signaling investment in technological advancements for sustainable practices.
In-Depth US Sustainable Home Furniture Market Outlook
The US Sustainable Home Furniture market exhibits strong growth potential, driven by increasing consumer demand, favorable government policies, and ongoing technological innovations. Strategic partnerships and expansion into new markets represent key opportunities for sustained long-term growth. The market is poised for significant expansion, presenting lucrative prospects for businesses focused on sustainability and innovation.
US Sustainable Home Furniture Market Segmentation
-
1. Application
- 1.1. Home Furniture
- 1.2. Office Furniture
- 1.3. Hospitality Furniture
- 1.4. Other Furniture
-
2. Material
- 2.1. Wood
- 2.2. Bamboo
- 2.3. PET
- 2.4. Others
-
3. Distribution Channel
- 3.1. Offline
- 3.2. Online
US Sustainable Home Furniture Market Segmentation By Geography
-
1. North America
- 1.1. United States
- 1.2. Canada
- 1.3. Mexico
-
2. South America
- 2.1. Brazil
- 2.2. Argentina
- 2.3. Rest of South America
-
3. Europe
- 3.1. United Kingdom
- 3.2. Germany
- 3.3. France
- 3.4. Italy
- 3.5. Spain
- 3.6. Russia
- 3.7. Benelux
- 3.8. Nordics
- 3.9. Rest of Europe
-
4. Middle East & Africa
- 4.1. Turkey
- 4.2. Israel
- 4.3. GCC
- 4.4. North Africa
- 4.5. South Africa
- 4.6. Rest of Middle East & Africa
-
5. Asia Pacific
- 5.1. China
- 5.2. India
- 5.3. Japan
- 5.4. South Korea
- 5.5. ASEAN
- 5.6. Oceania
- 5.7. Rest of Asia Pacific
US Sustainable Home Furniture Market REPORT HIGHLIGHTS
| Aspects | Details |
|---|---|
| Study Period | 2019-2033 |
| Base Year | 2024 |
| Estimated Year | 2025 |
| Forecast Period | 2025-2033 |
| Historical Period | 2019-2024 |
| Growth Rate | CAGR of > 5.00% from 2019-2033 |
| Segmentation |
|
Table of Contents
- 1. Introduction
- 1.1. Research Scope
- 1.2. Market Segmentation
- 1.3. Research Methodology
- 1.4. Definitions and Assumptions
- 2. Executive Summary
- 2.1. Introduction
- 3. Market Dynamics
- 3.1. Introduction
- 3.2. Market Drivers
- 3.2.1. Rise in E-commerce is Driving the Market; Rise in Construction and Real Estate Sector Drives the Furniture Market
- 3.3. Market Restrains
- 3.3.1. Economic Fluctuations; High Competition in the Furniture Market
- 3.4. Market Trends
- 3.4.1. Residential Sector Driving the Market
- 4. Market Factor Analysis
- 4.1. Porters Five Forces
- 4.2. Supply/Value Chain
- 4.3. PESTEL analysis
- 4.4. Market Entropy
- 4.5. Patent/Trademark Analysis
- 5. Global US Sustainable Home Furniture Market Analysis, Insights and Forecast, 2019-2031
- 5.1. Market Analysis, Insights and Forecast - by Application
- 5.1.1. Home Furniture
- 5.1.2. Office Furniture
- 5.1.3. Hospitality Furniture
- 5.1.4. Other Furniture
- 5.2. Market Analysis, Insights and Forecast - by Material
- 5.2.1. Wood
- 5.2.2. Bamboo
- 5.2.3. PET
- 5.2.4. Others
- 5.3. Market Analysis, Insights and Forecast - by Distribution Channel
- 5.3.1. Offline
- 5.3.2. Online
- 5.4. Market Analysis, Insights and Forecast - by Region
- 5.4.1. North America
- 5.4.2. South America
- 5.4.3. Europe
- 5.4.4. Middle East & Africa
- 5.4.5. Asia Pacific
- 5.1. Market Analysis, Insights and Forecast - by Application
- 6. North America US Sustainable Home Furniture Market Analysis, Insights and Forecast, 2019-2031
- 6.1. Market Analysis, Insights and Forecast - by Application
- 6.1.1. Home Furniture
- 6.1.2. Office Furniture
- 6.1.3. Hospitality Furniture
- 6.1.4. Other Furniture
- 6.2. Market Analysis, Insights and Forecast - by Material
- 6.2.1. Wood
- 6.2.2. Bamboo
- 6.2.3. PET
- 6.2.4. Others
- 6.3. Market Analysis, Insights and Forecast - by Distribution Channel
- 6.3.1. Offline
- 6.3.2. Online
- 6.1. Market Analysis, Insights and Forecast - by Application
- 7. South America US Sustainable Home Furniture Market Analysis, Insights and Forecast, 2019-2031
- 7.1. Market Analysis, Insights and Forecast - by Application
- 7.1.1. Home Furniture
- 7.1.2. Office Furniture
- 7.1.3. Hospitality Furniture
- 7.1.4. Other Furniture
- 7.2. Market Analysis, Insights and Forecast - by Material
- 7.2.1. Wood
- 7.2.2. Bamboo
- 7.2.3. PET
- 7.2.4. Others
- 7.3. Market Analysis, Insights and Forecast - by Distribution Channel
- 7.3.1. Offline
- 7.3.2. Online
- 7.1. Market Analysis, Insights and Forecast - by Application
- 8. Europe US Sustainable Home Furniture Market Analysis, Insights and Forecast, 2019-2031
- 8.1. Market Analysis, Insights and Forecast - by Application
- 8.1.1. Home Furniture
- 8.1.2. Office Furniture
- 8.1.3. Hospitality Furniture
- 8.1.4. Other Furniture
- 8.2. Market Analysis, Insights and Forecast - by Material
- 8.2.1. Wood
- 8.2.2. Bamboo
- 8.2.3. PET
- 8.2.4. Others
- 8.3. Market Analysis, Insights and Forecast - by Distribution Channel
- 8.3.1. Offline
- 8.3.2. Online
- 8.1. Market Analysis, Insights and Forecast - by Application
- 9. Middle East & Africa US Sustainable Home Furniture Market Analysis, Insights and Forecast, 2019-2031
- 9.1. Market Analysis, Insights and Forecast - by Application
- 9.1.1. Home Furniture
- 9.1.2. Office Furniture
- 9.1.3. Hospitality Furniture
- 9.1.4. Other Furniture
- 9.2. Market Analysis, Insights and Forecast - by Material
- 9.2.1. Wood
- 9.2.2. Bamboo
- 9.2.3. PET
- 9.2.4. Others
- 9.3. Market Analysis, Insights and Forecast - by Distribution Channel
- 9.3.1. Offline
- 9.3.2. Online
- 9.1. Market Analysis, Insights and Forecast - by Application
- 10. Asia Pacific US Sustainable Home Furniture Market Analysis, Insights and Forecast, 2019-2031
- 10.1. Market Analysis, Insights and Forecast - by Application
- 10.1.1. Home Furniture
- 10.1.2. Office Furniture
- 10.1.3. Hospitality Furniture
- 10.1.4. Other Furniture
- 10.2. Market Analysis, Insights and Forecast - by Material
- 10.2.1. Wood
- 10.2.2. Bamboo
- 10.2.3. PET
- 10.2.4. Others
- 10.3. Market Analysis, Insights and Forecast - by Distribution Channel
- 10.3.1. Offline
- 10.3.2. Online
- 10.1. Market Analysis, Insights and Forecast - by Application
- 11. Northeast US Sustainable Home Furniture Market Analysis, Insights and Forecast, 2019-2031
- 12. Southeast US Sustainable Home Furniture Market Analysis, Insights and Forecast, 2019-2031
- 13. Midwest US Sustainable Home Furniture Market Analysis, Insights and Forecast, 2019-2031
- 14. Southwest US Sustainable Home Furniture Market Analysis, Insights and Forecast, 2019-2031
- 15. West US Sustainable Home Furniture Market Analysis, Insights and Forecast, 2019-2031
- 16. Competitive Analysis
- 16.1. Global Market Share Analysis 2024
- 16.2. Company Profiles
- 16.2.1 Inter IKEA Systems B V
- 16.2.1.1. Overview
- 16.2.1.2. Products
- 16.2.1.3. SWOT Analysis
- 16.2.1.4. Recent Developments
- 16.2.1.5. Financials (Based on Availability)
- 16.2.2 Interior Systems Inc**List Not Exhaustive
- 16.2.2.1. Overview
- 16.2.2.2. Products
- 16.2.2.3. SWOT Analysis
- 16.2.2.4. Recent Developments
- 16.2.2.5. Financials (Based on Availability)
- 16.2.3 Global Furniture Group
- 16.2.3.1. Overview
- 16.2.3.2. Products
- 16.2.3.3. SWOT Analysis
- 16.2.3.4. Recent Developments
- 16.2.3.5. Financials (Based on Availability)
- 16.2.4 Kimball International Inc
- 16.2.4.1. Overview
- 16.2.4.2. Products
- 16.2.4.3. SWOT Analysis
- 16.2.4.4. Recent Developments
- 16.2.4.5. Financials (Based on Availability)
- 16.2.5 Steelcase
- 16.2.5.1. Overview
- 16.2.5.2. Products
- 16.2.5.3. SWOT Analysis
- 16.2.5.4. Recent Developments
- 16.2.5.5. Financials (Based on Availability)
- 16.2.6 HNI Corporation
- 16.2.6.1. Overview
- 16.2.6.2. Products
- 16.2.6.3. SWOT Analysis
- 16.2.6.4. Recent Developments
- 16.2.6.5. Financials (Based on Availability)
- 16.2.7 Williams-Sonoma Inc
- 16.2.7.1. Overview
- 16.2.7.2. Products
- 16.2.7.3. SWOT Analysis
- 16.2.7.4. Recent Developments
- 16.2.7.5. Financials (Based on Availability)
- 16.2.8 Okamura Corp
- 16.2.8.1. Overview
- 16.2.8.2. Products
- 16.2.8.3. SWOT Analysis
- 16.2.8.4. Recent Developments
- 16.2.8.5. Financials (Based on Availability)
- 16.2.9 Herman Miller Inc
- 16.2.9.1. Overview
- 16.2.9.2. Products
- 16.2.9.3. SWOT Analysis
- 16.2.9.4. Recent Developments
- 16.2.9.5. Financials (Based on Availability)
- 16.2.10 Wayfair Inc
- 16.2.10.1. Overview
- 16.2.10.2. Products
- 16.2.10.3. SWOT Analysis
- 16.2.10.4. Recent Developments
- 16.2.10.5. Financials (Based on Availability)
- 16.2.11 Ashley Furniture
- 16.2.11.1. Overview
- 16.2.11.2. Products
- 16.2.11.3. SWOT Analysis
- 16.2.11.4. Recent Developments
- 16.2.11.5. Financials (Based on Availability)
- 16.2.12 Haworth
- 16.2.12.1. Overview
- 16.2.12.2. Products
- 16.2.12.3. SWOT Analysis
- 16.2.12.4. Recent Developments
- 16.2.12.5. Financials (Based on Availability)
- 16.2.13 Bed Bath & Beyond Inc
- 16.2.13.1. Overview
- 16.2.13.2. Products
- 16.2.13.3. SWOT Analysis
- 16.2.13.4. Recent Developments
- 16.2.13.5. Financials (Based on Availability)
- 16.2.1 Inter IKEA Systems B V
List of Figures
- Figure 1: Global US Sustainable Home Furniture Market Revenue Breakdown (Million, %) by Region 2024 & 2032
- Figure 2: United states US Sustainable Home Furniture Market Revenue (Million), by Country 2024 & 2032
- Figure 3: United states US Sustainable Home Furniture Market Revenue Share (%), by Country 2024 & 2032
- Figure 4: North America US Sustainable Home Furniture Market Revenue (Million), by Application 2024 & 2032
- Figure 5: North America US Sustainable Home Furniture Market Revenue Share (%), by Application 2024 & 2032
- Figure 6: North America US Sustainable Home Furniture Market Revenue (Million), by Material 2024 & 2032
- Figure 7: North America US Sustainable Home Furniture Market Revenue Share (%), by Material 2024 & 2032
- Figure 8: North America US Sustainable Home Furniture Market Revenue (Million), by Distribution Channel 2024 & 2032
- Figure 9: North America US Sustainable Home Furniture Market Revenue Share (%), by Distribution Channel 2024 & 2032
- Figure 10: North America US Sustainable Home Furniture Market Revenue (Million), by Country 2024 & 2032
- Figure 11: North America US Sustainable Home Furniture Market Revenue Share (%), by Country 2024 & 2032
- Figure 12: South America US Sustainable Home Furniture Market Revenue (Million), by Application 2024 & 2032
- Figure 13: South America US Sustainable Home Furniture Market Revenue Share (%), by Application 2024 & 2032
- Figure 14: South America US Sustainable Home Furniture Market Revenue (Million), by Material 2024 & 2032
- Figure 15: South America US Sustainable Home Furniture Market Revenue Share (%), by Material 2024 & 2032
- Figure 16: South America US Sustainable Home Furniture Market Revenue (Million), by Distribution Channel 2024 & 2032
- Figure 17: South America US Sustainable Home Furniture Market Revenue Share (%), by Distribution Channel 2024 & 2032
- Figure 18: South America US Sustainable Home Furniture Market Revenue (Million), by Country 2024 & 2032
- Figure 19: South America US Sustainable Home Furniture Market Revenue Share (%), by Country 2024 & 2032
- Figure 20: Europe US Sustainable Home Furniture Market Revenue (Million), by Application 2024 & 2032
- Figure 21: Europe US Sustainable Home Furniture Market Revenue Share (%), by Application 2024 & 2032
- Figure 22: Europe US Sustainable Home Furniture Market Revenue (Million), by Material 2024 & 2032
- Figure 23: Europe US Sustainable Home Furniture Market Revenue Share (%), by Material 2024 & 2032
- Figure 24: Europe US Sustainable Home Furniture Market Revenue (Million), by Distribution Channel 2024 & 2032
- Figure 25: Europe US Sustainable Home Furniture Market Revenue Share (%), by Distribution Channel 2024 & 2032
- Figure 26: Europe US Sustainable Home Furniture Market Revenue (Million), by Country 2024 & 2032
- Figure 27: Europe US Sustainable Home Furniture Market Revenue Share (%), by Country 2024 & 2032
- Figure 28: Middle East & Africa US Sustainable Home Furniture Market Revenue (Million), by Application 2024 & 2032
- Figure 29: Middle East & Africa US Sustainable Home Furniture Market Revenue Share (%), by Application 2024 & 2032
- Figure 30: Middle East & Africa US Sustainable Home Furniture Market Revenue (Million), by Material 2024 & 2032
- Figure 31: Middle East & Africa US Sustainable Home Furniture Market Revenue Share (%), by Material 2024 & 2032
- Figure 32: Middle East & Africa US Sustainable Home Furniture Market Revenue (Million), by Distribution Channel 2024 & 2032
- Figure 33: Middle East & Africa US Sustainable Home Furniture Market Revenue Share (%), by Distribution Channel 2024 & 2032
- Figure 34: Middle East & Africa US Sustainable Home Furniture Market Revenue (Million), by Country 2024 & 2032
- Figure 35: Middle East & Africa US Sustainable Home Furniture Market Revenue Share (%), by Country 2024 & 2032
- Figure 36: Asia Pacific US Sustainable Home Furniture Market Revenue (Million), by Application 2024 & 2032
- Figure 37: Asia Pacific US Sustainable Home Furniture Market Revenue Share (%), by Application 2024 & 2032
- Figure 38: Asia Pacific US Sustainable Home Furniture Market Revenue (Million), by Material 2024 & 2032
- Figure 39: Asia Pacific US Sustainable Home Furniture Market Revenue Share (%), by Material 2024 & 2032
- Figure 40: Asia Pacific US Sustainable Home Furniture Market Revenue (Million), by Distribution Channel 2024 & 2032
- Figure 41: Asia Pacific US Sustainable Home Furniture Market Revenue Share (%), by Distribution Channel 2024 & 2032
- Figure 42: Asia Pacific US Sustainable Home Furniture Market Revenue (Million), by Country 2024 & 2032
- Figure 43: Asia Pacific US Sustainable Home Furniture Market Revenue Share (%), by Country 2024 & 2032
List of Tables
- Table 1: Global US Sustainable Home Furniture Market Revenue Million Forecast, by Region 2019 & 2032
- Table 2: Global US Sustainable Home Furniture Market Revenue Million Forecast, by Application 2019 & 2032
- Table 3: Global US Sustainable Home Furniture Market Revenue Million Forecast, by Material 2019 & 2032
- Table 4: Global US Sustainable Home Furniture Market Revenue Million Forecast, by Distribution Channel 2019 & 2032
- Table 5: Global US Sustainable Home Furniture Market Revenue Million Forecast, by Region 2019 & 2032
- Table 6: Global US Sustainable Home Furniture Market Revenue Million Forecast, by Country 2019 & 2032
- Table 7: Northeast US Sustainable Home Furniture Market Revenue (Million) Forecast, by Application 2019 & 2032
- Table 8: Southeast US Sustainable Home Furniture Market Revenue (Million) Forecast, by Application 2019 & 2032
- Table 9: Midwest US Sustainable Home Furniture Market Revenue (Million) Forecast, by Application 2019 & 2032
- Table 10: Southwest US Sustainable Home Furniture Market Revenue (Million) Forecast, by Application 2019 & 2032
- Table 11: West US Sustainable Home Furniture Market Revenue (Million) Forecast, by Application 2019 & 2032
- Table 12: Global US Sustainable Home Furniture Market Revenue Million Forecast, by Application 2019 & 2032
- Table 13: Global US Sustainable Home Furniture Market Revenue Million Forecast, by Material 2019 & 2032
- Table 14: Global US Sustainable Home Furniture Market Revenue Million Forecast, by Distribution Channel 2019 & 2032
- Table 15: Global US Sustainable Home Furniture Market Revenue Million Forecast, by Country 2019 & 2032
- Table 16: United States US Sustainable Home Furniture Market Revenue (Million) Forecast, by Application 2019 & 2032
- Table 17: Canada US Sustainable Home Furniture Market Revenue (Million) Forecast, by Application 2019 & 2032
- Table 18: Mexico US Sustainable Home Furniture Market Revenue (Million) Forecast, by Application 2019 & 2032
- Table 19: Global US Sustainable Home Furniture Market Revenue Million Forecast, by Application 2019 & 2032
- Table 20: Global US Sustainable Home Furniture Market Revenue Million Forecast, by Material 2019 & 2032
- Table 21: Global US Sustainable Home Furniture Market Revenue Million Forecast, by Distribution Channel 2019 & 2032
- Table 22: Global US Sustainable Home Furniture Market Revenue Million Forecast, by Country 2019 & 2032
- Table 23: Brazil US Sustainable Home Furniture Market Revenue (Million) Forecast, by Application 2019 & 2032
- Table 24: Argentina US Sustainable Home Furniture Market Revenue (Million) Forecast, by Application 2019 & 2032
- Table 25: Rest of South America US Sustainable Home Furniture Market Revenue (Million) Forecast, by Application 2019 & 2032
- Table 26: Global US Sustainable Home Furniture Market Revenue Million Forecast, by Application 2019 & 2032
- Table 27: Global US Sustainable Home Furniture Market Revenue Million Forecast, by Material 2019 & 2032
- Table 28: Global US Sustainable Home Furniture Market Revenue Million Forecast, by Distribution Channel 2019 & 2032
- Table 29: Global US Sustainable Home Furniture Market Revenue Million Forecast, by Country 2019 & 2032
- Table 30: United Kingdom US Sustainable Home Furniture Market Revenue (Million) Forecast, by Application 2019 & 2032
- Table 31: Germany US Sustainable Home Furniture Market Revenue (Million) Forecast, by Application 2019 & 2032
- Table 32: France US Sustainable Home Furniture Market Revenue (Million) Forecast, by Application 2019 & 2032
- Table 33: Italy US Sustainable Home Furniture Market Revenue (Million) Forecast, by Application 2019 & 2032
- Table 34: Spain US Sustainable Home Furniture Market Revenue (Million) Forecast, by Application 2019 & 2032
- Table 35: Russia US Sustainable Home Furniture Market Revenue (Million) Forecast, by Application 2019 & 2032
- Table 36: Benelux US Sustainable Home Furniture Market Revenue (Million) Forecast, by Application 2019 & 2032
- Table 37: Nordics US Sustainable Home Furniture Market Revenue (Million) Forecast, by Application 2019 & 2032
- Table 38: Rest of Europe US Sustainable Home Furniture Market Revenue (Million) Forecast, by Application 2019 & 2032
- Table 39: Global US Sustainable Home Furniture Market Revenue Million Forecast, by Application 2019 & 2032
- Table 40: Global US Sustainable Home Furniture Market Revenue Million Forecast, by Material 2019 & 2032
- Table 41: Global US Sustainable Home Furniture Market Revenue Million Forecast, by Distribution Channel 2019 & 2032
- Table 42: Global US Sustainable Home Furniture Market Revenue Million Forecast, by Country 2019 & 2032
- Table 43: Turkey US Sustainable Home Furniture Market Revenue (Million) Forecast, by Application 2019 & 2032
- Table 44: Israel US Sustainable Home Furniture Market Revenue (Million) Forecast, by Application 2019 & 2032
- Table 45: GCC US Sustainable Home Furniture Market Revenue (Million) Forecast, by Application 2019 & 2032
- Table 46: North Africa US Sustainable Home Furniture Market Revenue (Million) Forecast, by Application 2019 & 2032
- Table 47: South Africa US Sustainable Home Furniture Market Revenue (Million) Forecast, by Application 2019 & 2032
- Table 48: Rest of Middle East & Africa US Sustainable Home Furniture Market Revenue (Million) Forecast, by Application 2019 & 2032
- Table 49: Global US Sustainable Home Furniture Market Revenue Million Forecast, by Application 2019 & 2032
- Table 50: Global US Sustainable Home Furniture Market Revenue Million Forecast, by Material 2019 & 2032
- Table 51: Global US Sustainable Home Furniture Market Revenue Million Forecast, by Distribution Channel 2019 & 2032
- Table 52: Global US Sustainable Home Furniture Market Revenue Million Forecast, by Country 2019 & 2032
- Table 53: China US Sustainable Home Furniture Market Revenue (Million) Forecast, by Application 2019 & 2032
- Table 54: India US Sustainable Home Furniture Market Revenue (Million) Forecast, by Application 2019 & 2032
- Table 55: Japan US Sustainable Home Furniture Market Revenue (Million) Forecast, by Application 2019 & 2032
- Table 56: South Korea US Sustainable Home Furniture Market Revenue (Million) Forecast, by Application 2019 & 2032
- Table 57: ASEAN US Sustainable Home Furniture Market Revenue (Million) Forecast, by Application 2019 & 2032
- Table 58: Oceania US Sustainable Home Furniture Market Revenue (Million) Forecast, by Application 2019 & 2032
- Table 59: Rest of Asia Pacific US Sustainable Home Furniture Market Revenue (Million) Forecast, by Application 2019 & 2032
Frequently Asked Questions
1. What is the projected Compound Annual Growth Rate (CAGR) of the US Sustainable Home Furniture Market?
The projected CAGR is approximately > 5.00%.
2. Which companies are prominent players in the US Sustainable Home Furniture Market?
Key companies in the market include Inter IKEA Systems B V, Interior Systems Inc**List Not Exhaustive, Global Furniture Group, Kimball International Inc, Steelcase, HNI Corporation, Williams-Sonoma Inc, Okamura Corp, Herman Miller Inc, Wayfair Inc, Ashley Furniture, Haworth, Bed Bath & Beyond Inc.
3. What are the main segments of the US Sustainable Home Furniture Market?
The market segments include Application, Material, Distribution Channel.
4. Can you provide details about the market size?
The market size is estimated to be USD XX Million as of 2022.
5. What are some drivers contributing to market growth?
Rise in E-commerce is Driving the Market; Rise in Construction and Real Estate Sector Drives the Furniture Market.
6. What are the notable trends driving market growth?
Residential Sector Driving the Market.
7. Are there any restraints impacting market growth?
Economic Fluctuations; High Competition in the Furniture Market.
8. Can you provide examples of recent developments in the market?
In April 2021, Wayfair Inc., the leading home furniture chain, planned to open three new engineering sites in the San Francisco Bay Area of California, Austin, Texas, and Toronto in Ontario, Canada. The company is planning to hire approximately 1,000 technologists to its world-class engineering organization globally over the next year.
9. What pricing options are available for accessing the report?
Pricing options include single-user, multi-user, and enterprise licenses priced at USD 3800, USD 4500, and USD 5800 respectively.
10. Is the market size provided in terms of value or volume?
The market size is provided in terms of value, measured in Million.
11. Are there any specific market keywords associated with the report?
Yes, the market keyword associated with the report is "US Sustainable Home Furniture Market," which aids in identifying and referencing the specific market segment covered.
12. How do I determine which pricing option suits my needs best?
The pricing options vary based on user requirements and access needs. Individual users may opt for single-user licenses, while businesses requiring broader access may choose multi-user or enterprise licenses for cost-effective access to the report.
13. Are there any additional resources or data provided in the US Sustainable Home Furniture Market report?
While the report offers comprehensive insights, it's advisable to review the specific contents or supplementary materials provided to ascertain if additional resources or data are available.
14. How can I stay updated on further developments or reports in the US Sustainable Home Furniture Market?
To stay informed about further developments, trends, and reports in the US Sustainable Home Furniture Market, consider subscribing to industry newsletters, following relevant companies and organizations, or regularly checking reputable industry news sources and publications.
Methodology
Step 1 - Identification of Relevant Samples Size from Population Database


Step 2 - Approaches for Defining Global Market Size (Value, Volume* & Price*)

Note*: In applicable scenarios
Step 3 - Data Sources
Primary Research
- Web Analytics
- Survey Reports
- Research Institute
- Latest Research Reports
- Opinion Leaders
Secondary Research
- Annual Reports
- White Paper
- Latest Press Release
- Industry Association
- Paid Database
- Investor Presentations

Step 4 - Data Triangulation
Involves using different sources of information in order to increase the validity of a study
These sources are likely to be stakeholders in a program - participants, other researchers, program staff, other community members, and so on.
Then we put all data in single framework & apply various statistical tools to find out the dynamic on the market.
During the analysis stage, feedback from the stakeholder groups would be compared to determine areas of agreement as well as areas of divergence
