

Key Insights
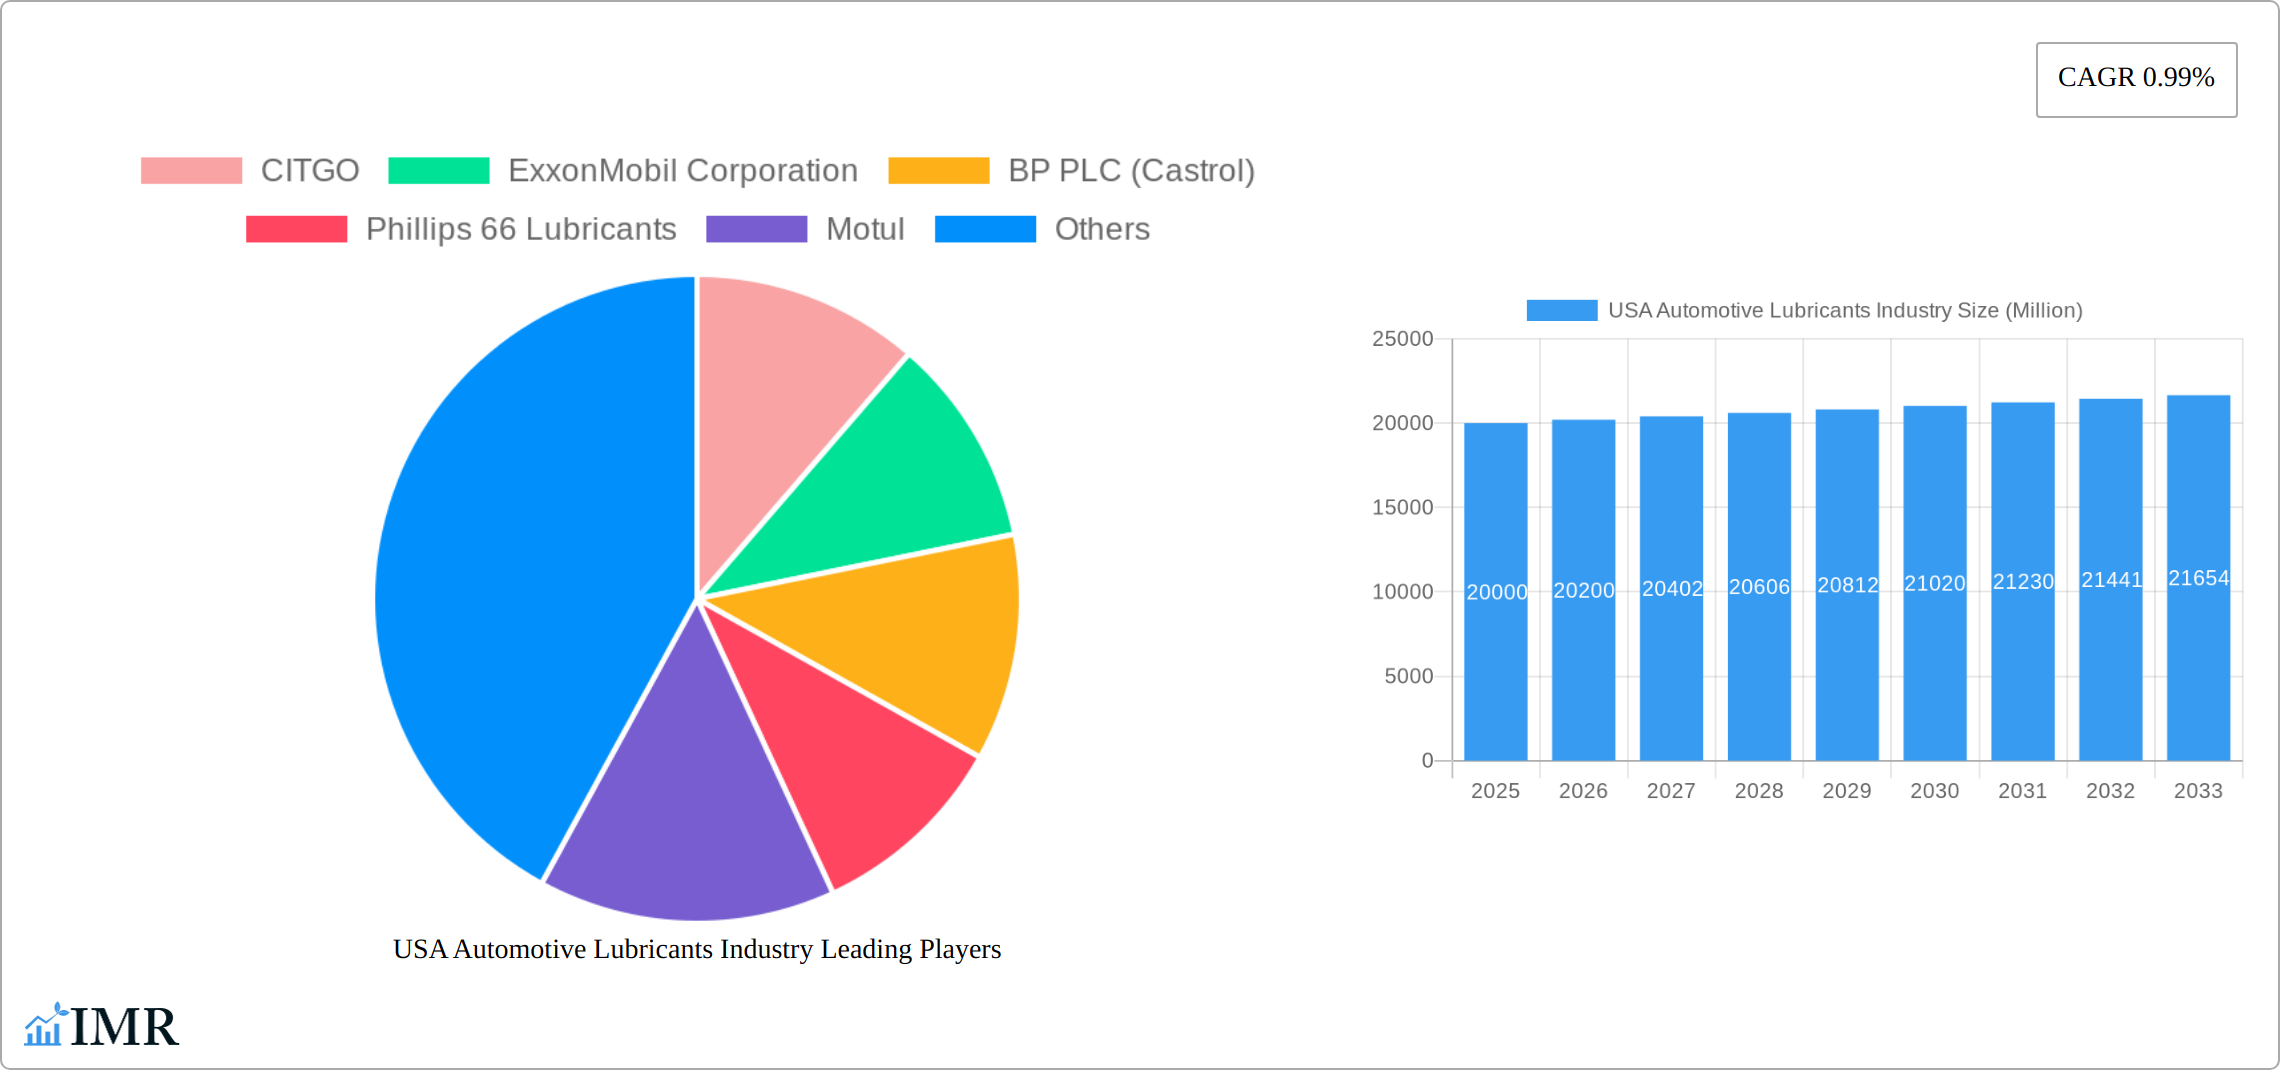
The US automotive lubricants market, valued at approximately $20 billion in 2025, is projected to experience steady growth, driven primarily by the increasing number of vehicles on the road and the rising demand for high-performance lubricants. A compound annual growth rate (CAGR) of 0.99% from 2025 to 2033 suggests a relatively stable market, though this could be influenced by factors such as fluctuating oil prices, technological advancements in lubricant formulations (e.g., synthetic oils), and evolving vehicle technologies (e.g., electric vehicles). The passenger vehicle segment currently holds the largest market share, followed by commercial vehicles and motorcycles. Within product types, engine oils dominate, while the demand for specialized fluids like transmission and gear oils, and high-performance greases is steadily rising due to increased focus on vehicle efficiency and extended service intervals. Regional variations exist, with states like California and Texas, due to their large populations and significant automotive industries, likely contributing the most significant portions of the market. Competitive pressures are intense, with major players like ExxonMobil, Shell, and Castrol vying for market dominance through innovation, branding, and distribution networks. Smaller, specialized companies like AMSOIL focus on niche markets with high-performance lubricants.
The market's relatively low CAGR hints at a mature market, indicating that significant growth will likely depend on factors like technological innovations in lubricant formulations that extend vehicle life, improve fuel efficiency, or reduce emissions. Furthermore, the increasing adoption of electric vehicles presents both a challenge and an opportunity. While the demand for conventional lubricants may decline in the long term due to the reduced need for engine oil changes, the market for specialized lubricants for electric vehicle components (such as coolants and greases) presents a potential avenue for growth. Government regulations regarding emissions and environmental protection also play a significant role, influencing the development and adoption of eco-friendly lubricants. Therefore, companies will need to strategically adapt their product portfolios and focus on innovation and sustainability to thrive in this evolving market.
USA Automotive Lubricants Industry Market Report: 2019-2033
This comprehensive report provides an in-depth analysis of the USA automotive lubricants industry, covering market dynamics, growth trends, key players, and future outlook. The study period spans from 2019 to 2033, with 2025 serving as the base and estimated year. This report is crucial for industry professionals, investors, and strategists seeking to understand this dynamic market and capitalize on emerging opportunities. The report delves into both parent market (Automotive Industry) and child markets (Commercial Vehicles, Passenger Vehicles, Motorcycles) to offer a holistic perspective.
USA Automotive Lubricants Industry Market Dynamics & Structure
The USA automotive lubricants market is characterized by moderate concentration, with major players like ExxonMobil, Shell, and Chevron holding significant market share (estimated at xx% combined in 2025). Technological innovation, driven by stricter emission regulations and the rise of electric vehicles, is a key driver. The regulatory landscape, encompassing environmental standards (e.g., EPA regulations on oil composition) and safety regulations, significantly shapes product development and market access. Competition from alternative lubricants and bio-based products is intensifying, impacting market share and pricing strategies. End-user demographics, particularly the growth of the commercial vehicle segment, influence demand for specific lubricant types. Furthermore, M&A activity (e.g., Valvoline and Cummins’ collaboration) is shaping market consolidation and competitive dynamics. An estimated xx M&A deals were recorded between 2019 and 2024.
- Market Concentration: Moderately concentrated, with top 5 players holding xx% market share in 2025.
- Technological Innovation: Focus on fuel efficiency, emission reduction, and extended drain intervals.
- Regulatory Framework: Stringent environmental and safety regulations impacting product formulation and disposal.
- Competitive Substitutes: Bio-based lubricants and alternative technologies posing a growing challenge.
- End-User Demographics: Growth in commercial vehicle fleets driving demand for heavy-duty lubricants.
- M&A Trends: Strategic partnerships and acquisitions shaping market consolidation.
USA Automotive Lubricants Industry Growth Trends & Insights
The USA automotive lubricants market demonstrated robust growth, achieving a market size of [Insert Updated Market Size in Million Units] in 2024, representing a CAGR of [Insert Updated CAGR]% during the historical period (2019-2024). This expansion is fueled by several key factors, including a rise in vehicle ownership, increased vehicle miles traveled (VMT), and the burgeoning commercial vehicle sector. However, the emergence of electric vehicles (EVs) presents a dynamic challenge and opportunity, potentially impacting the demand for conventional engine oils while simultaneously creating a need for specialized EV fluids, such as e-fluids and thermal management fluids. Technological advancements, such as the development of high-performance synthetic lubricants with extended drain intervals and enhanced fuel efficiency, are significantly influencing product adoption. Furthermore, evolving consumer preferences, reflecting a heightened awareness of environmental sustainability, are driving the demand for eco-friendly, biodegradable, and low-carbon footprint lubricants. The forecast period (2025-2033) projects continued growth, although potentially at a moderated pace given the ongoing transition to EVs, with a projected CAGR of [Insert Updated CAGR]%. Market penetration for synthetic lubricants is anticipated to reach [Insert Updated Percentage]% by 2033, driven by their superior performance characteristics.
Dominant Regions, Countries, or Segments in USA Automotive Lubricants Industry
The passenger vehicle segment continues to dominate the USA automotive lubricants market, accounting for approximately [Insert Updated Number] million units in 2025. This dominance is attributable to high vehicle ownership rates and the relatively frequent oil change intervals associated with conventional internal combustion engine (ICE) vehicles. Engine oils remain the largest product segment, contributing approximately [Insert Updated Number] million units to the overall market in 2025 due to their crucial role in vehicle maintenance and performance. Key growth drivers for the passenger vehicle segment encompass increasing vehicle sales, a growing middle class, and favorable economic conditions in various regions. The commercial vehicle segment exhibits substantial growth potential, fueled by the expansion of the logistics and transportation industries, requiring specialized lubricants to withstand demanding operational conditions.
- Passenger Vehicles: High vehicle ownership and frequent oil changes sustain significant demand, although this is expected to moderate with EV adoption.
- Commercial Vehicles: Expansion of logistics and transportation sectors, along with stricter emission regulations, fuels growth potential for heavy-duty lubricants.
- Engine Oils: Remains the dominant product segment, with a shift towards higher-performance synthetic and semi-synthetic formulations.
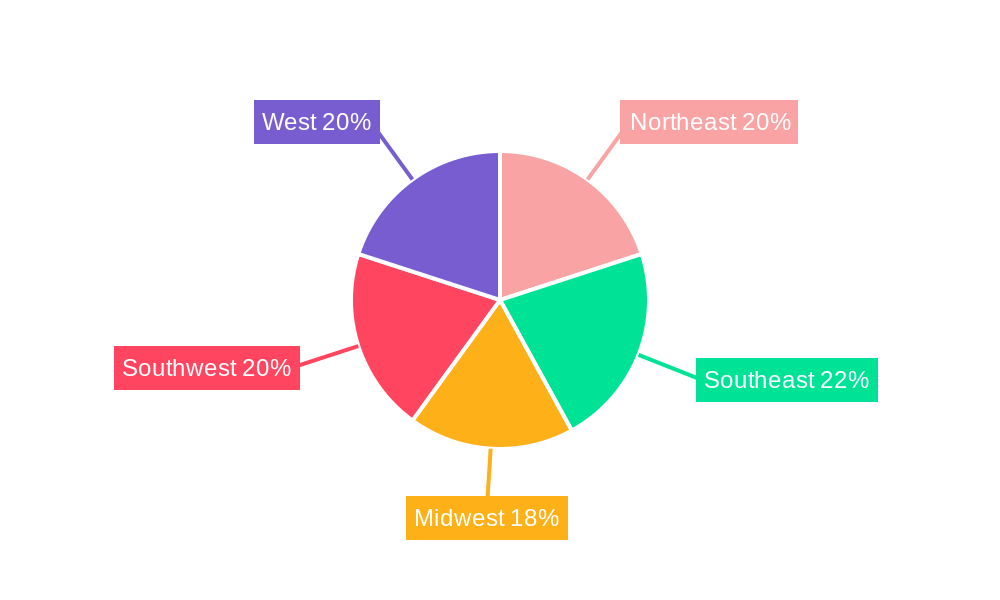
- Geographic Dominance: High population density and economic activity in the Eastern and Western coastal regions, as well as major industrial centers, contribute significantly to market share.
USA Automotive Lubricants Industry Product Landscape
The automotive lubricant market encompasses a diverse array of products meticulously engineered for various vehicle types and applications. Engine oils are categorized based on viscosity grade (e.g., SAE 0W-20, 5W-30), performance standards (e.g., API SN Plus, ILSAC GF-6), and formulation (conventional, synthetic, semi-synthetic, and group III base oils). Greases provide enhanced lubrication and protection in high-stress applications, such as wheel bearings and chassis components. Transmission and gear oils are crucial for the smooth and efficient operation of transmission and drivetrain systems. Cutting-edge innovations are focused on improving fuel efficiency, extending drain intervals, enhancing engine protection, reducing emissions, and optimizing overall vehicle performance. Unique selling propositions (USPs) frequently emphasize enhanced protection against wear and tear, improved fuel economy, extended drain intervals, and superior performance at extreme temperatures, driving product adoption.
Key Drivers, Barriers & Challenges in USA Automotive Lubricants Industry
Key Drivers: Stringent emission regulations incentivize the development and adoption of advanced lubricants that improve fuel efficiency and reduce emissions. Growing vehicle ownership and expanding commercial vehicle fleets drive demand. Technological advancements leading to enhanced performance characteristics are attracting consumers.
Key Challenges: Supply chain disruptions caused by geopolitical instability and resource limitations create price volatility and availability issues. Intensifying competition from both domestic and international players puts pressure on margins. The transition to electric vehicles poses a long-term challenge to the traditional engine oil market.
Emerging Opportunities in USA Automotive Lubricants Industry
Significant opportunities exist in developing and commercializing sustainable and bio-based lubricants to address growing environmental concerns and meet increasingly stringent regulatory requirements. The rapid adoption of electric vehicles (EVs) creates a substantial demand for specialized lubricants for EV components, such as e-axles, inverters, and battery cooling systems. Furthermore, untapped markets in rural areas and underserved segments present considerable growth potential through targeted distribution strategies and tailored product offerings.
Growth Accelerators in the USA Automotive Lubricants Industry
Technological advancements in lubricant formulation, particularly the development of higher-performance synthetic oils with improved oxidation resistance and extended service life, are driving market expansion. Strategic partnerships and collaborations between lubricant manufacturers and automotive original equipment manufacturers (OEMs) are crucial for accelerating product development, enhancing market reach, and ensuring product compatibility with new vehicle technologies. Expansion into new geographic markets and diversification into specialized lubricant segments, such as those for EVs and heavy-duty commercial vehicles, are driving long-term growth and market share gains.
Key Players Shaping the USA Automotive Lubricants Industry Market
- CITGO
- ExxonMobil Corporation
- BP PLC (Castrol)
- Phillips 66 Lubricants
- Motul
- Royal Dutch Shell Plc
- Chevron Corporation
- TotalEnergies
- Valvoline Inc
- AMSOIL Inc
Notable Milestones in USA Automotive Lubricants Industry Sector
- July 2021: Mighty Distributing System partnered with Total Specialties USA, expanding the market reach of Quartz Ineo and Quartz 9000 lubricants.
- October 2021: Valvoline and Cummins extended their collaboration, boosting Valvoline's market presence in heavy-duty engine oils.
- January 2022: ExxonMobil reorganized its business lines, potentially impacting its lubricants division's focus and strategies.
In-Depth USA Automotive Lubricants Industry Market Outlook
The USA automotive lubricants market is poised for continued growth, driven by technological innovation, strategic partnerships, and the expansion of the commercial vehicle sector. However, the transition to electric vehicles presents both challenges and opportunities, requiring manufacturers to adapt their product portfolios and strategies. The focus on sustainability and environmental concerns will shape future product development and market dynamics. Strategic investments in research and development, coupled with effective marketing and distribution strategies, will be crucial for success in this evolving market.
USA Automotive Lubricants Industry Segmentation
-
1. Vehicle Type
- 1.1. Commercial Vehicles
- 1.2. Motorcycles
- 1.3. Passenger Vehicles
-
2. Product Type
- 2.1. Engine Oils
- 2.2. Greases
- 2.3. Hydraulic Fluids
- 2.4. Transmission & Gear Oils
USA Automotive Lubricants Industry Segmentation By Geography
-
1. North America
- 1.1. United States
- 1.2. Canada
- 1.3. Mexico
-
2. South America
- 2.1. Brazil
- 2.2. Argentina
- 2.3. Rest of South America
-
3. Europe
- 3.1. United Kingdom
- 3.2. Germany
- 3.3. France
- 3.4. Italy
- 3.5. Spain
- 3.6. Russia
- 3.7. Benelux
- 3.8. Nordics
- 3.9. Rest of Europe
-
4. Middle East & Africa
- 4.1. Turkey
- 4.2. Israel
- 4.3. GCC
- 4.4. North Africa
- 4.5. South Africa
- 4.6. Rest of Middle East & Africa
-
5. Asia Pacific
- 5.1. China
- 5.2. India
- 5.3. Japan
- 5.4. South Korea
- 5.5. ASEAN
- 5.6. Oceania
- 5.7. Rest of Asia Pacific
USA Automotive Lubricants Industry REPORT HIGHLIGHTS
| Aspects | Details |
|---|---|
| Study Period | 2019-2033 |
| Base Year | 2024 |
| Estimated Year | 2025 |
| Forecast Period | 2025-2033 |
| Historical Period | 2019-2024 |
| Growth Rate | CAGR of 0.99% from 2019-2033 |
| Segmentation |
|
Table of Contents
- 1. Introduction
- 1.1. Research Scope
- 1.2. Market Segmentation
- 1.3. Research Methodology
- 1.4. Definitions and Assumptions
- 2. Executive Summary
- 2.1. Introduction
- 3. Market Dynamics
- 3.1. Introduction
- 3.2. Market Drivers
- 3.2.1. Increasing Automotive Production and Sales; Increasing Adoption of High-performance Lubricants
- 3.3. Market Restrains
- 3.3.1. Extended Drain Intervals; Modest Impact of Electric Vehicles (EVs) in the Future
- 3.4. Market Trends
- 3.4.1. Largest Segment By Vehicle Type
- 4. Market Factor Analysis
- 4.1. Porters Five Forces
- 4.2. Supply/Value Chain
- 4.3. PESTEL analysis
- 4.4. Market Entropy
- 4.5. Patent/Trademark Analysis
- 5. Global USA Automotive Lubricants Industry Analysis, Insights and Forecast, 2019-2031
- 5.1. Market Analysis, Insights and Forecast - by Vehicle Type
- 5.1.1. Commercial Vehicles
- 5.1.2. Motorcycles
- 5.1.3. Passenger Vehicles
- 5.2. Market Analysis, Insights and Forecast - by Product Type
- 5.2.1. Engine Oils
- 5.2.2. Greases
- 5.2.3. Hydraulic Fluids
- 5.2.4. Transmission & Gear Oils
- 5.3. Market Analysis, Insights and Forecast - by Region
- 5.3.1. North America
- 5.3.2. South America
- 5.3.3. Europe
- 5.3.4. Middle East & Africa
- 5.3.5. Asia Pacific
- 5.1. Market Analysis, Insights and Forecast - by Vehicle Type
- 6. North America USA Automotive Lubricants Industry Analysis, Insights and Forecast, 2019-2031
- 6.1. Market Analysis, Insights and Forecast - by Vehicle Type
- 6.1.1. Commercial Vehicles
- 6.1.2. Motorcycles
- 6.1.3. Passenger Vehicles
- 6.2. Market Analysis, Insights and Forecast - by Product Type
- 6.2.1. Engine Oils
- 6.2.2. Greases
- 6.2.3. Hydraulic Fluids
- 6.2.4. Transmission & Gear Oils
- 6.1. Market Analysis, Insights and Forecast - by Vehicle Type
- 7. South America USA Automotive Lubricants Industry Analysis, Insights and Forecast, 2019-2031
- 7.1. Market Analysis, Insights and Forecast - by Vehicle Type
- 7.1.1. Commercial Vehicles
- 7.1.2. Motorcycles
- 7.1.3. Passenger Vehicles
- 7.2. Market Analysis, Insights and Forecast - by Product Type
- 7.2.1. Engine Oils
- 7.2.2. Greases
- 7.2.3. Hydraulic Fluids
- 7.2.4. Transmission & Gear Oils
- 7.1. Market Analysis, Insights and Forecast - by Vehicle Type
- 8. Europe USA Automotive Lubricants Industry Analysis, Insights and Forecast, 2019-2031
- 8.1. Market Analysis, Insights and Forecast - by Vehicle Type
- 8.1.1. Commercial Vehicles
- 8.1.2. Motorcycles
- 8.1.3. Passenger Vehicles
- 8.2. Market Analysis, Insights and Forecast - by Product Type
- 8.2.1. Engine Oils
- 8.2.2. Greases
- 8.2.3. Hydraulic Fluids
- 8.2.4. Transmission & Gear Oils
- 8.1. Market Analysis, Insights and Forecast - by Vehicle Type
- 9. Middle East & Africa USA Automotive Lubricants Industry Analysis, Insights and Forecast, 2019-2031
- 9.1. Market Analysis, Insights and Forecast - by Vehicle Type
- 9.1.1. Commercial Vehicles
- 9.1.2. Motorcycles
- 9.1.3. Passenger Vehicles
- 9.2. Market Analysis, Insights and Forecast - by Product Type
- 9.2.1. Engine Oils
- 9.2.2. Greases
- 9.2.3. Hydraulic Fluids
- 9.2.4. Transmission & Gear Oils
- 9.1. Market Analysis, Insights and Forecast - by Vehicle Type
- 10. Asia Pacific USA Automotive Lubricants Industry Analysis, Insights and Forecast, 2019-2031
- 10.1. Market Analysis, Insights and Forecast - by Vehicle Type
- 10.1.1. Commercial Vehicles
- 10.1.2. Motorcycles
- 10.1.3. Passenger Vehicles
- 10.2. Market Analysis, Insights and Forecast - by Product Type
- 10.2.1. Engine Oils
- 10.2.2. Greases
- 10.2.3. Hydraulic Fluids
- 10.2.4. Transmission & Gear Oils
- 10.1. Market Analysis, Insights and Forecast - by Vehicle Type
- 11. Northeast USA Automotive Lubricants Industry Analysis, Insights and Forecast, 2019-2031
- 12. Southeast USA Automotive Lubricants Industry Analysis, Insights and Forecast, 2019-2031
- 13. Midwest USA Automotive Lubricants Industry Analysis, Insights and Forecast, 2019-2031
- 14. Southwest USA Automotive Lubricants Industry Analysis, Insights and Forecast, 2019-2031
- 15. West USA Automotive Lubricants Industry Analysis, Insights and Forecast, 2019-2031
- 16. Competitive Analysis
- 16.1. Global Market Share Analysis 2024
- 16.2. Company Profiles
- 16.2.1 CITGO
- 16.2.1.1. Overview
- 16.2.1.2. Products
- 16.2.1.3. SWOT Analysis
- 16.2.1.4. Recent Developments
- 16.2.1.5. Financials (Based on Availability)
- 16.2.2 ExxonMobil Corporation
- 16.2.2.1. Overview
- 16.2.2.2. Products
- 16.2.2.3. SWOT Analysis
- 16.2.2.4. Recent Developments
- 16.2.2.5. Financials (Based on Availability)
- 16.2.3 BP PLC (Castrol)
- 16.2.3.1. Overview
- 16.2.3.2. Products
- 16.2.3.3. SWOT Analysis
- 16.2.3.4. Recent Developments
- 16.2.3.5. Financials (Based on Availability)
- 16.2.4 Phillips 66 Lubricants
- 16.2.4.1. Overview
- 16.2.4.2. Products
- 16.2.4.3. SWOT Analysis
- 16.2.4.4. Recent Developments
- 16.2.4.5. Financials (Based on Availability)
- 16.2.5 Motul
- 16.2.5.1. Overview
- 16.2.5.2. Products
- 16.2.5.3. SWOT Analysis
- 16.2.5.4. Recent Developments
- 16.2.5.5. Financials (Based on Availability)
- 16.2.6 Royal Dutch Shell Plc
- 16.2.6.1. Overview
- 16.2.6.2. Products
- 16.2.6.3. SWOT Analysis
- 16.2.6.4. Recent Developments
- 16.2.6.5. Financials (Based on Availability)
- 16.2.7 Chevron Corporation
- 16.2.7.1. Overview
- 16.2.7.2. Products
- 16.2.7.3. SWOT Analysis
- 16.2.7.4. Recent Developments
- 16.2.7.5. Financials (Based on Availability)
- 16.2.8 TotalEnergies
- 16.2.8.1. Overview
- 16.2.8.2. Products
- 16.2.8.3. SWOT Analysis
- 16.2.8.4. Recent Developments
- 16.2.8.5. Financials (Based on Availability)
- 16.2.9 Valvoline Inc
- 16.2.9.1. Overview
- 16.2.9.2. Products
- 16.2.9.3. SWOT Analysis
- 16.2.9.4. Recent Developments
- 16.2.9.5. Financials (Based on Availability)
- 16.2.10 AMSOIL Inc
- 16.2.10.1. Overview
- 16.2.10.2. Products
- 16.2.10.3. SWOT Analysis
- 16.2.10.4. Recent Developments
- 16.2.10.5. Financials (Based on Availability)
- 16.2.1 CITGO
List of Figures
- Figure 1: Global USA Automotive Lubricants Industry Revenue Breakdown (Million, %) by Region 2024 & 2032
- Figure 2: Global USA Automotive Lubricants Industry Volume Breakdown (Billion, %) by Region 2024 & 2032
- Figure 3: United states USA Automotive Lubricants Industry Revenue (Million), by Country 2024 & 2032
- Figure 4: United states USA Automotive Lubricants Industry Volume (Billion), by Country 2024 & 2032
- Figure 5: United states USA Automotive Lubricants Industry Revenue Share (%), by Country 2024 & 2032
- Figure 6: United states USA Automotive Lubricants Industry Volume Share (%), by Country 2024 & 2032
- Figure 7: North America USA Automotive Lubricants Industry Revenue (Million), by Vehicle Type 2024 & 2032
- Figure 8: North America USA Automotive Lubricants Industry Volume (Billion), by Vehicle Type 2024 & 2032
- Figure 9: North America USA Automotive Lubricants Industry Revenue Share (%), by Vehicle Type 2024 & 2032
- Figure 10: North America USA Automotive Lubricants Industry Volume Share (%), by Vehicle Type 2024 & 2032
- Figure 11: North America USA Automotive Lubricants Industry Revenue (Million), by Product Type 2024 & 2032
- Figure 12: North America USA Automotive Lubricants Industry Volume (Billion), by Product Type 2024 & 2032
- Figure 13: North America USA Automotive Lubricants Industry Revenue Share (%), by Product Type 2024 & 2032
- Figure 14: North America USA Automotive Lubricants Industry Volume Share (%), by Product Type 2024 & 2032
- Figure 15: North America USA Automotive Lubricants Industry Revenue (Million), by Country 2024 & 2032
- Figure 16: North America USA Automotive Lubricants Industry Volume (Billion), by Country 2024 & 2032
- Figure 17: North America USA Automotive Lubricants Industry Revenue Share (%), by Country 2024 & 2032
- Figure 18: North America USA Automotive Lubricants Industry Volume Share (%), by Country 2024 & 2032
- Figure 19: South America USA Automotive Lubricants Industry Revenue (Million), by Vehicle Type 2024 & 2032
- Figure 20: South America USA Automotive Lubricants Industry Volume (Billion), by Vehicle Type 2024 & 2032
- Figure 21: South America USA Automotive Lubricants Industry Revenue Share (%), by Vehicle Type 2024 & 2032
- Figure 22: South America USA Automotive Lubricants Industry Volume Share (%), by Vehicle Type 2024 & 2032
- Figure 23: South America USA Automotive Lubricants Industry Revenue (Million), by Product Type 2024 & 2032
- Figure 24: South America USA Automotive Lubricants Industry Volume (Billion), by Product Type 2024 & 2032
- Figure 25: South America USA Automotive Lubricants Industry Revenue Share (%), by Product Type 2024 & 2032
- Figure 26: South America USA Automotive Lubricants Industry Volume Share (%), by Product Type 2024 & 2032
- Figure 27: South America USA Automotive Lubricants Industry Revenue (Million), by Country 2024 & 2032
- Figure 28: South America USA Automotive Lubricants Industry Volume (Billion), by Country 2024 & 2032
- Figure 29: South America USA Automotive Lubricants Industry Revenue Share (%), by Country 2024 & 2032
- Figure 30: South America USA Automotive Lubricants Industry Volume Share (%), by Country 2024 & 2032
- Figure 31: Europe USA Automotive Lubricants Industry Revenue (Million), by Vehicle Type 2024 & 2032
- Figure 32: Europe USA Automotive Lubricants Industry Volume (Billion), by Vehicle Type 2024 & 2032
- Figure 33: Europe USA Automotive Lubricants Industry Revenue Share (%), by Vehicle Type 2024 & 2032
- Figure 34: Europe USA Automotive Lubricants Industry Volume Share (%), by Vehicle Type 2024 & 2032
- Figure 35: Europe USA Automotive Lubricants Industry Revenue (Million), by Product Type 2024 & 2032
- Figure 36: Europe USA Automotive Lubricants Industry Volume (Billion), by Product Type 2024 & 2032
- Figure 37: Europe USA Automotive Lubricants Industry Revenue Share (%), by Product Type 2024 & 2032
- Figure 38: Europe USA Automotive Lubricants Industry Volume Share (%), by Product Type 2024 & 2032
- Figure 39: Europe USA Automotive Lubricants Industry Revenue (Million), by Country 2024 & 2032
- Figure 40: Europe USA Automotive Lubricants Industry Volume (Billion), by Country 2024 & 2032
- Figure 41: Europe USA Automotive Lubricants Industry Revenue Share (%), by Country 2024 & 2032
- Figure 42: Europe USA Automotive Lubricants Industry Volume Share (%), by Country 2024 & 2032
- Figure 43: Middle East & Africa USA Automotive Lubricants Industry Revenue (Million), by Vehicle Type 2024 & 2032
- Figure 44: Middle East & Africa USA Automotive Lubricants Industry Volume (Billion), by Vehicle Type 2024 & 2032
- Figure 45: Middle East & Africa USA Automotive Lubricants Industry Revenue Share (%), by Vehicle Type 2024 & 2032
- Figure 46: Middle East & Africa USA Automotive Lubricants Industry Volume Share (%), by Vehicle Type 2024 & 2032
- Figure 47: Middle East & Africa USA Automotive Lubricants Industry Revenue (Million), by Product Type 2024 & 2032
- Figure 48: Middle East & Africa USA Automotive Lubricants Industry Volume (Billion), by Product Type 2024 & 2032
- Figure 49: Middle East & Africa USA Automotive Lubricants Industry Revenue Share (%), by Product Type 2024 & 2032
- Figure 50: Middle East & Africa USA Automotive Lubricants Industry Volume Share (%), by Product Type 2024 & 2032
- Figure 51: Middle East & Africa USA Automotive Lubricants Industry Revenue (Million), by Country 2024 & 2032
- Figure 52: Middle East & Africa USA Automotive Lubricants Industry Volume (Billion), by Country 2024 & 2032
- Figure 53: Middle East & Africa USA Automotive Lubricants Industry Revenue Share (%), by Country 2024 & 2032
- Figure 54: Middle East & Africa USA Automotive Lubricants Industry Volume Share (%), by Country 2024 & 2032
- Figure 55: Asia Pacific USA Automotive Lubricants Industry Revenue (Million), by Vehicle Type 2024 & 2032
- Figure 56: Asia Pacific USA Automotive Lubricants Industry Volume (Billion), by Vehicle Type 2024 & 2032
- Figure 57: Asia Pacific USA Automotive Lubricants Industry Revenue Share (%), by Vehicle Type 2024 & 2032
- Figure 58: Asia Pacific USA Automotive Lubricants Industry Volume Share (%), by Vehicle Type 2024 & 2032
- Figure 59: Asia Pacific USA Automotive Lubricants Industry Revenue (Million), by Product Type 2024 & 2032
- Figure 60: Asia Pacific USA Automotive Lubricants Industry Volume (Billion), by Product Type 2024 & 2032
- Figure 61: Asia Pacific USA Automotive Lubricants Industry Revenue Share (%), by Product Type 2024 & 2032
- Figure 62: Asia Pacific USA Automotive Lubricants Industry Volume Share (%), by Product Type 2024 & 2032
- Figure 63: Asia Pacific USA Automotive Lubricants Industry Revenue (Million), by Country 2024 & 2032
- Figure 64: Asia Pacific USA Automotive Lubricants Industry Volume (Billion), by Country 2024 & 2032
- Figure 65: Asia Pacific USA Automotive Lubricants Industry Revenue Share (%), by Country 2024 & 2032
- Figure 66: Asia Pacific USA Automotive Lubricants Industry Volume Share (%), by Country 2024 & 2032
List of Tables
- Table 1: Global USA Automotive Lubricants Industry Revenue Million Forecast, by Region 2019 & 2032
- Table 2: Global USA Automotive Lubricants Industry Volume Billion Forecast, by Region 2019 & 2032
- Table 3: Global USA Automotive Lubricants Industry Revenue Million Forecast, by Vehicle Type 2019 & 2032
- Table 4: Global USA Automotive Lubricants Industry Volume Billion Forecast, by Vehicle Type 2019 & 2032
- Table 5: Global USA Automotive Lubricants Industry Revenue Million Forecast, by Product Type 2019 & 2032
- Table 6: Global USA Automotive Lubricants Industry Volume Billion Forecast, by Product Type 2019 & 2032
- Table 7: Global USA Automotive Lubricants Industry Revenue Million Forecast, by Region 2019 & 2032
- Table 8: Global USA Automotive Lubricants Industry Volume Billion Forecast, by Region 2019 & 2032
- Table 9: Global USA Automotive Lubricants Industry Revenue Million Forecast, by Country 2019 & 2032
- Table 10: Global USA Automotive Lubricants Industry Volume Billion Forecast, by Country 2019 & 2032
- Table 11: Northeast USA Automotive Lubricants Industry Revenue (Million) Forecast, by Application 2019 & 2032
- Table 12: Northeast USA Automotive Lubricants Industry Volume (Billion) Forecast, by Application 2019 & 2032
- Table 13: Southeast USA Automotive Lubricants Industry Revenue (Million) Forecast, by Application 2019 & 2032
- Table 14: Southeast USA Automotive Lubricants Industry Volume (Billion) Forecast, by Application 2019 & 2032
- Table 15: Midwest USA Automotive Lubricants Industry Revenue (Million) Forecast, by Application 2019 & 2032
- Table 16: Midwest USA Automotive Lubricants Industry Volume (Billion) Forecast, by Application 2019 & 2032
- Table 17: Southwest USA Automotive Lubricants Industry Revenue (Million) Forecast, by Application 2019 & 2032
- Table 18: Southwest USA Automotive Lubricants Industry Volume (Billion) Forecast, by Application 2019 & 2032
- Table 19: West USA Automotive Lubricants Industry Revenue (Million) Forecast, by Application 2019 & 2032
- Table 20: West USA Automotive Lubricants Industry Volume (Billion) Forecast, by Application 2019 & 2032
- Table 21: Global USA Automotive Lubricants Industry Revenue Million Forecast, by Vehicle Type 2019 & 2032
- Table 22: Global USA Automotive Lubricants Industry Volume Billion Forecast, by Vehicle Type 2019 & 2032
- Table 23: Global USA Automotive Lubricants Industry Revenue Million Forecast, by Product Type 2019 & 2032
- Table 24: Global USA Automotive Lubricants Industry Volume Billion Forecast, by Product Type 2019 & 2032
- Table 25: Global USA Automotive Lubricants Industry Revenue Million Forecast, by Country 2019 & 2032
- Table 26: Global USA Automotive Lubricants Industry Volume Billion Forecast, by Country 2019 & 2032
- Table 27: United States USA Automotive Lubricants Industry Revenue (Million) Forecast, by Application 2019 & 2032
- Table 28: United States USA Automotive Lubricants Industry Volume (Billion) Forecast, by Application 2019 & 2032
- Table 29: Canada USA Automotive Lubricants Industry Revenue (Million) Forecast, by Application 2019 & 2032
- Table 30: Canada USA Automotive Lubricants Industry Volume (Billion) Forecast, by Application 2019 & 2032
- Table 31: Mexico USA Automotive Lubricants Industry Revenue (Million) Forecast, by Application 2019 & 2032
- Table 32: Mexico USA Automotive Lubricants Industry Volume (Billion) Forecast, by Application 2019 & 2032
- Table 33: Global USA Automotive Lubricants Industry Revenue Million Forecast, by Vehicle Type 2019 & 2032
- Table 34: Global USA Automotive Lubricants Industry Volume Billion Forecast, by Vehicle Type 2019 & 2032
- Table 35: Global USA Automotive Lubricants Industry Revenue Million Forecast, by Product Type 2019 & 2032
- Table 36: Global USA Automotive Lubricants Industry Volume Billion Forecast, by Product Type 2019 & 2032
- Table 37: Global USA Automotive Lubricants Industry Revenue Million Forecast, by Country 2019 & 2032
- Table 38: Global USA Automotive Lubricants Industry Volume Billion Forecast, by Country 2019 & 2032
- Table 39: Brazil USA Automotive Lubricants Industry Revenue (Million) Forecast, by Application 2019 & 2032
- Table 40: Brazil USA Automotive Lubricants Industry Volume (Billion) Forecast, by Application 2019 & 2032
- Table 41: Argentina USA Automotive Lubricants Industry Revenue (Million) Forecast, by Application 2019 & 2032
- Table 42: Argentina USA Automotive Lubricants Industry Volume (Billion) Forecast, by Application 2019 & 2032
- Table 43: Rest of South America USA Automotive Lubricants Industry Revenue (Million) Forecast, by Application 2019 & 2032
- Table 44: Rest of South America USA Automotive Lubricants Industry Volume (Billion) Forecast, by Application 2019 & 2032
- Table 45: Global USA Automotive Lubricants Industry Revenue Million Forecast, by Vehicle Type 2019 & 2032
- Table 46: Global USA Automotive Lubricants Industry Volume Billion Forecast, by Vehicle Type 2019 & 2032
- Table 47: Global USA Automotive Lubricants Industry Revenue Million Forecast, by Product Type 2019 & 2032
- Table 48: Global USA Automotive Lubricants Industry Volume Billion Forecast, by Product Type 2019 & 2032
- Table 49: Global USA Automotive Lubricants Industry Revenue Million Forecast, by Country 2019 & 2032
- Table 50: Global USA Automotive Lubricants Industry Volume Billion Forecast, by Country 2019 & 2032
- Table 51: United Kingdom USA Automotive Lubricants Industry Revenue (Million) Forecast, by Application 2019 & 2032
- Table 52: United Kingdom USA Automotive Lubricants Industry Volume (Billion) Forecast, by Application 2019 & 2032
- Table 53: Germany USA Automotive Lubricants Industry Revenue (Million) Forecast, by Application 2019 & 2032
- Table 54: Germany USA Automotive Lubricants Industry Volume (Billion) Forecast, by Application 2019 & 2032
- Table 55: France USA Automotive Lubricants Industry Revenue (Million) Forecast, by Application 2019 & 2032
- Table 56: France USA Automotive Lubricants Industry Volume (Billion) Forecast, by Application 2019 & 2032
- Table 57: Italy USA Automotive Lubricants Industry Revenue (Million) Forecast, by Application 2019 & 2032
- Table 58: Italy USA Automotive Lubricants Industry Volume (Billion) Forecast, by Application 2019 & 2032
- Table 59: Spain USA Automotive Lubricants Industry Revenue (Million) Forecast, by Application 2019 & 2032
- Table 60: Spain USA Automotive Lubricants Industry Volume (Billion) Forecast, by Application 2019 & 2032
- Table 61: Russia USA Automotive Lubricants Industry Revenue (Million) Forecast, by Application 2019 & 2032
- Table 62: Russia USA Automotive Lubricants Industry Volume (Billion) Forecast, by Application 2019 & 2032
- Table 63: Benelux USA Automotive Lubricants Industry Revenue (Million) Forecast, by Application 2019 & 2032
- Table 64: Benelux USA Automotive Lubricants Industry Volume (Billion) Forecast, by Application 2019 & 2032
- Table 65: Nordics USA Automotive Lubricants Industry Revenue (Million) Forecast, by Application 2019 & 2032
- Table 66: Nordics USA Automotive Lubricants Industry Volume (Billion) Forecast, by Application 2019 & 2032
- Table 67: Rest of Europe USA Automotive Lubricants Industry Revenue (Million) Forecast, by Application 2019 & 2032
- Table 68: Rest of Europe USA Automotive Lubricants Industry Volume (Billion) Forecast, by Application 2019 & 2032
- Table 69: Global USA Automotive Lubricants Industry Revenue Million Forecast, by Vehicle Type 2019 & 2032
- Table 70: Global USA Automotive Lubricants Industry Volume Billion Forecast, by Vehicle Type 2019 & 2032
- Table 71: Global USA Automotive Lubricants Industry Revenue Million Forecast, by Product Type 2019 & 2032
- Table 72: Global USA Automotive Lubricants Industry Volume Billion Forecast, by Product Type 2019 & 2032
- Table 73: Global USA Automotive Lubricants Industry Revenue Million Forecast, by Country 2019 & 2032
- Table 74: Global USA Automotive Lubricants Industry Volume Billion Forecast, by Country 2019 & 2032
- Table 75: Turkey USA Automotive Lubricants Industry Revenue (Million) Forecast, by Application 2019 & 2032
- Table 76: Turkey USA Automotive Lubricants Industry Volume (Billion) Forecast, by Application 2019 & 2032
- Table 77: Israel USA Automotive Lubricants Industry Revenue (Million) Forecast, by Application 2019 & 2032
- Table 78: Israel USA Automotive Lubricants Industry Volume (Billion) Forecast, by Application 2019 & 2032
- Table 79: GCC USA Automotive Lubricants Industry Revenue (Million) Forecast, by Application 2019 & 2032
- Table 80: GCC USA Automotive Lubricants Industry Volume (Billion) Forecast, by Application 2019 & 2032
- Table 81: North Africa USA Automotive Lubricants Industry Revenue (Million) Forecast, by Application 2019 & 2032
- Table 82: North Africa USA Automotive Lubricants Industry Volume (Billion) Forecast, by Application 2019 & 2032
- Table 83: South Africa USA Automotive Lubricants Industry Revenue (Million) Forecast, by Application 2019 & 2032
- Table 84: South Africa USA Automotive Lubricants Industry Volume (Billion) Forecast, by Application 2019 & 2032
- Table 85: Rest of Middle East & Africa USA Automotive Lubricants Industry Revenue (Million) Forecast, by Application 2019 & 2032
- Table 86: Rest of Middle East & Africa USA Automotive Lubricants Industry Volume (Billion) Forecast, by Application 2019 & 2032
- Table 87: Global USA Automotive Lubricants Industry Revenue Million Forecast, by Vehicle Type 2019 & 2032
- Table 88: Global USA Automotive Lubricants Industry Volume Billion Forecast, by Vehicle Type 2019 & 2032
- Table 89: Global USA Automotive Lubricants Industry Revenue Million Forecast, by Product Type 2019 & 2032
- Table 90: Global USA Automotive Lubricants Industry Volume Billion Forecast, by Product Type 2019 & 2032
- Table 91: Global USA Automotive Lubricants Industry Revenue Million Forecast, by Country 2019 & 2032
- Table 92: Global USA Automotive Lubricants Industry Volume Billion Forecast, by Country 2019 & 2032
- Table 93: China USA Automotive Lubricants Industry Revenue (Million) Forecast, by Application 2019 & 2032
- Table 94: China USA Automotive Lubricants Industry Volume (Billion) Forecast, by Application 2019 & 2032
- Table 95: India USA Automotive Lubricants Industry Revenue (Million) Forecast, by Application 2019 & 2032
- Table 96: India USA Automotive Lubricants Industry Volume (Billion) Forecast, by Application 2019 & 2032
- Table 97: Japan USA Automotive Lubricants Industry Revenue (Million) Forecast, by Application 2019 & 2032
- Table 98: Japan USA Automotive Lubricants Industry Volume (Billion) Forecast, by Application 2019 & 2032
- Table 99: South Korea USA Automotive Lubricants Industry Revenue (Million) Forecast, by Application 2019 & 2032
- Table 100: South Korea USA Automotive Lubricants Industry Volume (Billion) Forecast, by Application 2019 & 2032
- Table 101: ASEAN USA Automotive Lubricants Industry Revenue (Million) Forecast, by Application 2019 & 2032
- Table 102: ASEAN USA Automotive Lubricants Industry Volume (Billion) Forecast, by Application 2019 & 2032
- Table 103: Oceania USA Automotive Lubricants Industry Revenue (Million) Forecast, by Application 2019 & 2032
- Table 104: Oceania USA Automotive Lubricants Industry Volume (Billion) Forecast, by Application 2019 & 2032
- Table 105: Rest of Asia Pacific USA Automotive Lubricants Industry Revenue (Million) Forecast, by Application 2019 & 2032
- Table 106: Rest of Asia Pacific USA Automotive Lubricants Industry Volume (Billion) Forecast, by Application 2019 & 2032
Frequently Asked Questions
1. What is the projected Compound Annual Growth Rate (CAGR) of the USA Automotive Lubricants Industry?
The projected CAGR is approximately 0.99%.
2. Which companies are prominent players in the USA Automotive Lubricants Industry?
Key companies in the market include CITGO, ExxonMobil Corporation, BP PLC (Castrol), Phillips 66 Lubricants, Motul, Royal Dutch Shell Plc, Chevron Corporation, TotalEnergies, Valvoline Inc, AMSOIL Inc.
3. What are the main segments of the USA Automotive Lubricants Industry?
The market segments include Vehicle Type, Product Type.
4. Can you provide details about the market size?
The market size is estimated to be USD XX Million as of 2022.
5. What are some drivers contributing to market growth?
Increasing Automotive Production and Sales; Increasing Adoption of High-performance Lubricants.
6. What are the notable trends driving market growth?
Largest Segment By Vehicle Type : <span style="font-family: 'regular_bold';color:#0e7db3;">Passenger Vehicles</span>.
7. Are there any restraints impacting market growth?
Extended Drain Intervals; Modest Impact of Electric Vehicles (EVs) in the Future.
8. Can you provide examples of recent developments in the market?
January 2022: Effective April 1, ExxonMobil Corporation was organized along three business lines - ExxonMobil Upstream Company, ExxonMobil Product Solutions and ExxonMobil Low Carbon Solutions.October 2021: Valvoline and Cummins extended their long-standing marketing and technology collaboration agreement for another five years. Cummins will endorse and promote Valvoline's Premium Blue engine oil for its heavy-duty diesel engines and generators and will distribute Valvoline products through its global distribution networks.July 2021: Mighty Distributing System (Mighty Auto Parts), a pioneer in automotive aftermarket goods and services, announced a new relationship with Total Specialties USA. It would target the Quartz Ineo and Quartz 9000 sub-ranges, geared for light automobiles and meet European OEMs' most stringent criteria.
9. What pricing options are available for accessing the report?
Pricing options include single-user, multi-user, and enterprise licenses priced at USD 3800, USD 4500, and USD 5800 respectively.
10. Is the market size provided in terms of value or volume?
The market size is provided in terms of value, measured in Million and volume, measured in Billion.
11. Are there any specific market keywords associated with the report?
Yes, the market keyword associated with the report is "USA Automotive Lubricants Industry," which aids in identifying and referencing the specific market segment covered.
12. How do I determine which pricing option suits my needs best?
The pricing options vary based on user requirements and access needs. Individual users may opt for single-user licenses, while businesses requiring broader access may choose multi-user or enterprise licenses for cost-effective access to the report.
13. Are there any additional resources or data provided in the USA Automotive Lubricants Industry report?
While the report offers comprehensive insights, it's advisable to review the specific contents or supplementary materials provided to ascertain if additional resources or data are available.
14. How can I stay updated on further developments or reports in the USA Automotive Lubricants Industry?
To stay informed about further developments, trends, and reports in the USA Automotive Lubricants Industry, consider subscribing to industry newsletters, following relevant companies and organizations, or regularly checking reputable industry news sources and publications.
Methodology
Step 1 - Identification of Relevant Samples Size from Population Database


Step 2 - Approaches for Defining Global Market Size (Value, Volume* & Price*)

Note*: In applicable scenarios
Step 3 - Data Sources
Primary Research
- Web Analytics
- Survey Reports
- Research Institute
- Latest Research Reports
- Opinion Leaders
Secondary Research
- Annual Reports
- White Paper
- Latest Press Release
- Industry Association
- Paid Database
- Investor Presentations

Step 4 - Data Triangulation
Involves using different sources of information in order to increase the validity of a study
These sources are likely to be stakeholders in a program - participants, other researchers, program staff, other community members, and so on.
Then we put all data in single framework & apply various statistical tools to find out the dynamic on the market.
During the analysis stage, feedback from the stakeholder groups would be compared to determine areas of agreement as well as areas of divergence
