

Key Insights
The US Insurtech market, valued at $49.82 billion in 2025, is projected to experience robust growth, exceeding a 6% CAGR from 2025 to 2033. This expansion is fueled by several key factors. Firstly, increasing consumer adoption of digital technologies and the demand for personalized, convenient insurance solutions are driving significant market penetration. Secondly, the emergence of innovative business models, such as usage-based insurance and micro-insurance, caters to evolving consumer needs and preferences, further boosting market growth. Furthermore, strategic partnerships between established insurers and tech startups are fostering innovation and expanding market reach. The competitive landscape is dynamic, with companies like Gusto, Oscar, Bright Health, and Lemonade leading the charge alongside innovative players in niche areas such as auto insurance (Root, Metromile, Next Insurance) and telehealth (American Well). These companies are continuously enhancing their product offerings and leveraging advanced technologies like AI and big data analytics to improve efficiency and customer experience.
However, the market faces certain challenges. Regulatory hurdles and data security concerns are potential restraints. Maintaining customer trust in a digital-first environment is critical for sustainable growth. The market's segmentation likely includes various insurance lines (auto, health, home, life), each exhibiting unique growth trajectories. While precise segment-wise market share data is unavailable, it's reasonable to expect health and auto insurtech to occupy substantial portions due to the significant technological advancements and high consumer interaction in these sectors. The forecast period of 2025-2033 suggests continuous market expansion, driven by ongoing technological innovation and increasing consumer demand for digital insurance solutions. Future growth will largely depend on the continued evolution of technology, regulatory changes, and the ability of insurtech companies to adapt to a constantly changing market landscape.

USA Insurtech Industry Market Report: 2019-2033
This comprehensive report provides a detailed analysis of the burgeoning USA Insurtech market, offering invaluable insights for investors, industry professionals, and strategic decision-makers. With a study period spanning 2019-2033, a base year of 2025, and a forecast period of 2025-2033, this report leverages extensive data and expert analysis to deliver a clear understanding of market dynamics, growth trends, and future opportunities. The report covers key segments within the broader Insurtech landscape, including Personal Lines, Commercial Lines, HealthTech, and Embedded Insurance, providing a granular view of each market segment’s growth trajectory.
USA Insurtech Industry Market Dynamics & Structure
This section analyzes the competitive landscape, technological advancements, regulatory influences, and market consolidation trends within the US Insurtech sector. The report delves into market concentration, identifying key players and their respective market shares. We examine the role of technological innovation, including AI, machine learning, and blockchain, in driving market growth. Regulatory frameworks and their impact on market expansion are also explored. Finally, the report examines the impact of mergers and acquisitions (M&A) activity on market structure and competition.
- Market Concentration: The US Insurtech market exhibits a moderately concentrated structure with a few dominant players alongside numerous smaller, niche players. Market share data for 2024 indicates that the top 5 players hold approximately xx% of the market.
- Technological Innovation: AI-powered underwriting, personalized pricing models, and telematics are key drivers of innovation. The adoption of cloud computing and APIs is facilitating greater efficiency and scalability.
- Regulatory Framework: Regulations like GDPR and CCPA influence data privacy and security practices, shaping product development and market access.
- M&A Activity: The period 2019-2024 witnessed xx M&A deals, indicating significant consolidation and strategic expansion within the sector. This trend is expected to continue, driven by the pursuit of scale and technological capabilities.
- Competitive Substitutes: Traditional insurance providers represent a primary source of competition, while emerging technologies continually reshape the competitive landscape.
USA Insurtech Industry Growth Trends & Insights
This section presents a comprehensive analysis of the US Insurtech market’s growth trajectory from 2019 to 2033. The analysis utilizes a combination of quantitative and qualitative data to provide a robust understanding of market size evolution, adoption rates, and technological disruptions impacting the industry. Key metrics, including the Compound Annual Growth Rate (CAGR) and market penetration rates, are analyzed to offer detailed insights. We examine shifting consumer behaviors, preferences towards digital solutions, and the impact of these changes on market expansion. The analysis also forecasts market size for 2025 and projects growth through 2033, providing a roadmap for future investments and strategic planning.

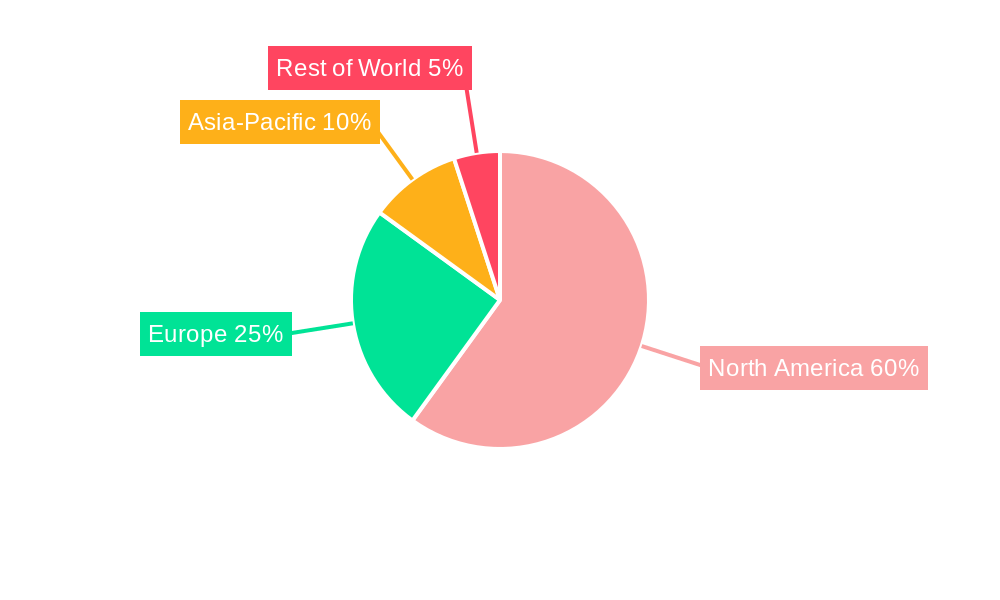
Dominant Regions, Countries, or Segments in USA Insurtech Industry
This section identifies the leading geographical regions and market segments driving the growth of the US Insurtech industry. The analysis utilizes detailed data on market share and growth potential to pinpoint key regions and segments. The report highlights the factors contributing to the dominance of these regions, including favorable economic conditions, robust technological infrastructure, and supportive regulatory environments.
- California: Silicon Valley's concentration of technology companies and venture capital makes California the leading state for Insurtech innovation and growth.
- New York: A strong financial services ecosystem and a large insured population contribute to New York's prominence in the Insurtech market.
- Leading Segment: The Personal Lines segment (auto, home) currently represents the largest share of the market, driven by high consumer adoption of digital platforms.
USA Insurtech Industry Product Landscape
The US Insurtech market showcases a diverse range of products, driven by rapid technological advancements and evolving customer needs. Innovative products include AI-powered underwriting tools, telematics-based auto insurance, and personalized health insurance solutions. These products leverage technology to offer enhanced efficiency, improved risk assessment, and more personalized customer experiences. The unique selling propositions (USPs) often lie in cost savings, convenience, and customer-centric features.
Key Drivers, Barriers & Challenges in USA Insurtech Industry
Several factors propel the growth of the US Insurtech market. Technological advancements, such as AI and machine learning, are automating processes and improving accuracy. Favorable regulatory frameworks fostering innovation contribute significantly. Increased consumer demand for digital and personalized services further fuels market growth.
Challenges include regulatory hurdles related to data privacy and security, as well as stiff competition from established insurance providers. Supply chain disruptions can also affect the delivery of technology solutions. These challenges represent significant obstacles that need to be addressed to unlock the full potential of the Insurtech market.
Emerging Opportunities in USA Insurtech Industry
Untapped market segments, such as micro-insurance and the application of Insurtech solutions in emerging industries, offer significant growth opportunities. The development of innovative products and services tailored to specific demographics and market needs represents a substantial avenue for expansion. Moreover, the integration of Insurtech solutions with other emerging technologies, such as IoT devices, will create new avenues for growth.
Growth Accelerators in the USA Insurtech Industry Industry
Technological breakthroughs, such as advancements in AI and big data analytics, are key drivers of long-term growth. Strategic partnerships between Insurtech companies and traditional insurance providers facilitate market expansion and knowledge sharing. Expansion into new geographical markets and the development of new product categories further contribute to sustainable growth.
Key Players Shaping the USA Insurtech Industry Market
- Gusto
- Oscar
- Bright Health
- Clover Health
- Root Insurance
- American Well
- Lemonade
- Outsystems
- Next Insurance
- Metromile
- Hippo
- List Not Exhaustive
Notable Milestones in USA Insurtech Industry Sector
- March 2023: Duck Creek Technologies acquired by Vista Equity Partners. This acquisition strengthens Duck Creek's position in the P&C insurance market.
- January 2023: Encora's acquisition of Excellarate enhances its capabilities in AI, analytics, and automation, boosting its presence in the Insurtech sector.
In-Depth USA Insurtech Industry Market Outlook
The US Insurtech market is poised for continued robust growth, driven by technological innovation, evolving consumer preferences, and strategic partnerships. The market's future potential lies in leveraging emerging technologies like AI, blockchain, and IoT to deliver personalized, efficient, and cost-effective insurance solutions. Strategic investments in data analytics and cybersecurity will be crucial for sustained success in this dynamic market. Expanding into underserved markets and developing innovative product offerings will also be vital for capturing market share and driving long-term growth.
USA Insurtech Industry Segmentation
-
1. Business Model
- 1.1. Carrier
- 1.2. Enabler
- 1.3. Distributor
-
2. Insurance Type
- 2.1. Life Insurance
- 2.2. Non-Life Insurance
USA Insurtech Industry Segmentation By Geography
-
1. North America
- 1.1. United States
- 1.2. Canada
- 1.3. Mexico
-
2. South America
- 2.1. Brazil
- 2.2. Argentina
- 2.3. Rest of South America
-
3. Europe
- 3.1. United Kingdom
- 3.2. Germany
- 3.3. France
- 3.4. Italy
- 3.5. Spain
- 3.6. Russia
- 3.7. Benelux
- 3.8. Nordics
- 3.9. Rest of Europe
-
4. Middle East & Africa
- 4.1. Turkey
- 4.2. Israel
- 4.3. GCC
- 4.4. North Africa
- 4.5. South Africa
- 4.6. Rest of Middle East & Africa
-
5. Asia Pacific
- 5.1. China
- 5.2. India
- 5.3. Japan
- 5.4. South Korea
- 5.5. ASEAN
- 5.6. Oceania
- 5.7. Rest of Asia Pacific
USA Insurtech Industry REPORT HIGHLIGHTS
| Aspects | Details |
|---|---|
| Study Period | 2019-2033 |
| Base Year | 2024 |
| Estimated Year | 2025 |
| Forecast Period | 2025-2033 |
| Historical Period | 2019-2024 |
| Growth Rate | CAGR of > 6.00% from 2019-2033 |
| Segmentation |
|
Table of Contents
- 1. Introduction
- 1.1. Research Scope
- 1.2. Market Segmentation
- 1.3. Research Methodology
- 1.4. Definitions and Assumptions
- 2. Executive Summary
- 2.1. Introduction
- 3. Market Dynamics
- 3.1. Introduction
- 3.2. Market Drivers
- 3.2.1. Growing Demand for Data Analytics and Artificial Intelligence; Increasing Adoption of Digital Technologies
- 3.3. Market Restrains
- 3.3.1. Growing Demand for Data Analytics and Artificial Intelligence; Increasing Adoption of Digital Technologies
- 3.4. Market Trends
- 3.4.1. Surged Funding towards Insurtech Companies
- 4. Market Factor Analysis
- 4.1. Porters Five Forces
- 4.2. Supply/Value Chain
- 4.3. PESTEL analysis
- 4.4. Market Entropy
- 4.5. Patent/Trademark Analysis
- 5. Global USA Insurtech Industry Analysis, Insights and Forecast, 2019-2031
- 5.1. Market Analysis, Insights and Forecast - by Business Model
- 5.1.1. Carrier
- 5.1.2. Enabler
- 5.1.3. Distributor
- 5.2. Market Analysis, Insights and Forecast - by Insurance Type
- 5.2.1. Life Insurance
- 5.2.2. Non-Life Insurance
- 5.3. Market Analysis, Insights and Forecast - by Region
- 5.3.1. North America
- 5.3.2. South America
- 5.3.3. Europe
- 5.3.4. Middle East & Africa
- 5.3.5. Asia Pacific
- 5.1. Market Analysis, Insights and Forecast - by Business Model
- 6. North America USA Insurtech Industry Analysis, Insights and Forecast, 2019-2031
- 6.1. Market Analysis, Insights and Forecast - by Business Model
- 6.1.1. Carrier
- 6.1.2. Enabler
- 6.1.3. Distributor
- 6.2. Market Analysis, Insights and Forecast - by Insurance Type
- 6.2.1. Life Insurance
- 6.2.2. Non-Life Insurance
- 6.1. Market Analysis, Insights and Forecast - by Business Model
- 7. South America USA Insurtech Industry Analysis, Insights and Forecast, 2019-2031
- 7.1. Market Analysis, Insights and Forecast - by Business Model
- 7.1.1. Carrier
- 7.1.2. Enabler
- 7.1.3. Distributor
- 7.2. Market Analysis, Insights and Forecast - by Insurance Type
- 7.2.1. Life Insurance
- 7.2.2. Non-Life Insurance
- 7.1. Market Analysis, Insights and Forecast - by Business Model
- 8. Europe USA Insurtech Industry Analysis, Insights and Forecast, 2019-2031
- 8.1. Market Analysis, Insights and Forecast - by Business Model
- 8.1.1. Carrier
- 8.1.2. Enabler
- 8.1.3. Distributor
- 8.2. Market Analysis, Insights and Forecast - by Insurance Type
- 8.2.1. Life Insurance
- 8.2.2. Non-Life Insurance
- 8.1. Market Analysis, Insights and Forecast - by Business Model
- 9. Middle East & Africa USA Insurtech Industry Analysis, Insights and Forecast, 2019-2031
- 9.1. Market Analysis, Insights and Forecast - by Business Model
- 9.1.1. Carrier
- 9.1.2. Enabler
- 9.1.3. Distributor
- 9.2. Market Analysis, Insights and Forecast - by Insurance Type
- 9.2.1. Life Insurance
- 9.2.2. Non-Life Insurance
- 9.1. Market Analysis, Insights and Forecast - by Business Model
- 10. Asia Pacific USA Insurtech Industry Analysis, Insights and Forecast, 2019-2031
- 10.1. Market Analysis, Insights and Forecast - by Business Model
- 10.1.1. Carrier
- 10.1.2. Enabler
- 10.1.3. Distributor
- 10.2. Market Analysis, Insights and Forecast - by Insurance Type
- 10.2.1. Life Insurance
- 10.2.2. Non-Life Insurance
- 10.1. Market Analysis, Insights and Forecast - by Business Model
- 11. Competitive Analysis
- 11.1. Global Market Share Analysis 2024
- 11.2. Company Profiles
- 11.2.1 Gusto
- 11.2.1.1. Overview
- 11.2.1.2. Products
- 11.2.1.3. SWOT Analysis
- 11.2.1.4. Recent Developments
- 11.2.1.5. Financials (Based on Availability)
- 11.2.2 Oscar
- 11.2.2.1. Overview
- 11.2.2.2. Products
- 11.2.2.3. SWOT Analysis
- 11.2.2.4. Recent Developments
- 11.2.2.5. Financials (Based on Availability)
- 11.2.3 Bright Health
- 11.2.3.1. Overview
- 11.2.3.2. Products
- 11.2.3.3. SWOT Analysis
- 11.2.3.4. Recent Developments
- 11.2.3.5. Financials (Based on Availability)
- 11.2.4 Clover Health
- 11.2.4.1. Overview
- 11.2.4.2. Products
- 11.2.4.3. SWOT Analysis
- 11.2.4.4. Recent Developments
- 11.2.4.5. Financials (Based on Availability)
- 11.2.5 Root Insurance
- 11.2.5.1. Overview
- 11.2.5.2. Products
- 11.2.5.3. SWOT Analysis
- 11.2.5.4. Recent Developments
- 11.2.5.5. Financials (Based on Availability)
- 11.2.6 American Well
- 11.2.6.1. Overview
- 11.2.6.2. Products
- 11.2.6.3. SWOT Analysis
- 11.2.6.4. Recent Developments
- 11.2.6.5. Financials (Based on Availability)
- 11.2.7 Lemonade
- 11.2.7.1. Overview
- 11.2.7.2. Products
- 11.2.7.3. SWOT Analysis
- 11.2.7.4. Recent Developments
- 11.2.7.5. Financials (Based on Availability)
- 11.2.8 Outsystems
- 11.2.8.1. Overview
- 11.2.8.2. Products
- 11.2.8.3. SWOT Analysis
- 11.2.8.4. Recent Developments
- 11.2.8.5. Financials (Based on Availability)
- 11.2.9 Next Insurance
- 11.2.9.1. Overview
- 11.2.9.2. Products
- 11.2.9.3. SWOT Analysis
- 11.2.9.4. Recent Developments
- 11.2.9.5. Financials (Based on Availability)
- 11.2.10 Metromile
- 11.2.10.1. Overview
- 11.2.10.2. Products
- 11.2.10.3. SWOT Analysis
- 11.2.10.4. Recent Developments
- 11.2.10.5. Financials (Based on Availability)
- 11.2.11 Hippo**List Not Exhaustive
- 11.2.11.1. Overview
- 11.2.11.2. Products
- 11.2.11.3. SWOT Analysis
- 11.2.11.4. Recent Developments
- 11.2.11.5. Financials (Based on Availability)
- 11.2.1 Gusto
List of Figures
- Figure 1: Global USA Insurtech Industry Revenue Breakdown (Million, %) by Region 2024 & 2032
- Figure 2: Global USA Insurtech Industry Volume Breakdown (Billion, %) by Region 2024 & 2032
- Figure 3: North America USA Insurtech Industry Revenue (Million), by Business Model 2024 & 2032
- Figure 4: North America USA Insurtech Industry Volume (Billion), by Business Model 2024 & 2032
- Figure 5: North America USA Insurtech Industry Revenue Share (%), by Business Model 2024 & 2032
- Figure 6: North America USA Insurtech Industry Volume Share (%), by Business Model 2024 & 2032
- Figure 7: North America USA Insurtech Industry Revenue (Million), by Insurance Type 2024 & 2032
- Figure 8: North America USA Insurtech Industry Volume (Billion), by Insurance Type 2024 & 2032
- Figure 9: North America USA Insurtech Industry Revenue Share (%), by Insurance Type 2024 & 2032
- Figure 10: North America USA Insurtech Industry Volume Share (%), by Insurance Type 2024 & 2032
- Figure 11: North America USA Insurtech Industry Revenue (Million), by Country 2024 & 2032
- Figure 12: North America USA Insurtech Industry Volume (Billion), by Country 2024 & 2032
- Figure 13: North America USA Insurtech Industry Revenue Share (%), by Country 2024 & 2032
- Figure 14: North America USA Insurtech Industry Volume Share (%), by Country 2024 & 2032
- Figure 15: South America USA Insurtech Industry Revenue (Million), by Business Model 2024 & 2032
- Figure 16: South America USA Insurtech Industry Volume (Billion), by Business Model 2024 & 2032
- Figure 17: South America USA Insurtech Industry Revenue Share (%), by Business Model 2024 & 2032
- Figure 18: South America USA Insurtech Industry Volume Share (%), by Business Model 2024 & 2032
- Figure 19: South America USA Insurtech Industry Revenue (Million), by Insurance Type 2024 & 2032
- Figure 20: South America USA Insurtech Industry Volume (Billion), by Insurance Type 2024 & 2032
- Figure 21: South America USA Insurtech Industry Revenue Share (%), by Insurance Type 2024 & 2032
- Figure 22: South America USA Insurtech Industry Volume Share (%), by Insurance Type 2024 & 2032
- Figure 23: South America USA Insurtech Industry Revenue (Million), by Country 2024 & 2032
- Figure 24: South America USA Insurtech Industry Volume (Billion), by Country 2024 & 2032
- Figure 25: South America USA Insurtech Industry Revenue Share (%), by Country 2024 & 2032
- Figure 26: South America USA Insurtech Industry Volume Share (%), by Country 2024 & 2032
- Figure 27: Europe USA Insurtech Industry Revenue (Million), by Business Model 2024 & 2032
- Figure 28: Europe USA Insurtech Industry Volume (Billion), by Business Model 2024 & 2032
- Figure 29: Europe USA Insurtech Industry Revenue Share (%), by Business Model 2024 & 2032
- Figure 30: Europe USA Insurtech Industry Volume Share (%), by Business Model 2024 & 2032
- Figure 31: Europe USA Insurtech Industry Revenue (Million), by Insurance Type 2024 & 2032
- Figure 32: Europe USA Insurtech Industry Volume (Billion), by Insurance Type 2024 & 2032
- Figure 33: Europe USA Insurtech Industry Revenue Share (%), by Insurance Type 2024 & 2032
- Figure 34: Europe USA Insurtech Industry Volume Share (%), by Insurance Type 2024 & 2032
- Figure 35: Europe USA Insurtech Industry Revenue (Million), by Country 2024 & 2032
- Figure 36: Europe USA Insurtech Industry Volume (Billion), by Country 2024 & 2032
- Figure 37: Europe USA Insurtech Industry Revenue Share (%), by Country 2024 & 2032
- Figure 38: Europe USA Insurtech Industry Volume Share (%), by Country 2024 & 2032
- Figure 39: Middle East & Africa USA Insurtech Industry Revenue (Million), by Business Model 2024 & 2032
- Figure 40: Middle East & Africa USA Insurtech Industry Volume (Billion), by Business Model 2024 & 2032
- Figure 41: Middle East & Africa USA Insurtech Industry Revenue Share (%), by Business Model 2024 & 2032
- Figure 42: Middle East & Africa USA Insurtech Industry Volume Share (%), by Business Model 2024 & 2032
- Figure 43: Middle East & Africa USA Insurtech Industry Revenue (Million), by Insurance Type 2024 & 2032
- Figure 44: Middle East & Africa USA Insurtech Industry Volume (Billion), by Insurance Type 2024 & 2032
- Figure 45: Middle East & Africa USA Insurtech Industry Revenue Share (%), by Insurance Type 2024 & 2032
- Figure 46: Middle East & Africa USA Insurtech Industry Volume Share (%), by Insurance Type 2024 & 2032
- Figure 47: Middle East & Africa USA Insurtech Industry Revenue (Million), by Country 2024 & 2032
- Figure 48: Middle East & Africa USA Insurtech Industry Volume (Billion), by Country 2024 & 2032
- Figure 49: Middle East & Africa USA Insurtech Industry Revenue Share (%), by Country 2024 & 2032
- Figure 50: Middle East & Africa USA Insurtech Industry Volume Share (%), by Country 2024 & 2032
- Figure 51: Asia Pacific USA Insurtech Industry Revenue (Million), by Business Model 2024 & 2032
- Figure 52: Asia Pacific USA Insurtech Industry Volume (Billion), by Business Model 2024 & 2032
- Figure 53: Asia Pacific USA Insurtech Industry Revenue Share (%), by Business Model 2024 & 2032
- Figure 54: Asia Pacific USA Insurtech Industry Volume Share (%), by Business Model 2024 & 2032
- Figure 55: Asia Pacific USA Insurtech Industry Revenue (Million), by Insurance Type 2024 & 2032
- Figure 56: Asia Pacific USA Insurtech Industry Volume (Billion), by Insurance Type 2024 & 2032
- Figure 57: Asia Pacific USA Insurtech Industry Revenue Share (%), by Insurance Type 2024 & 2032
- Figure 58: Asia Pacific USA Insurtech Industry Volume Share (%), by Insurance Type 2024 & 2032
- Figure 59: Asia Pacific USA Insurtech Industry Revenue (Million), by Country 2024 & 2032
- Figure 60: Asia Pacific USA Insurtech Industry Volume (Billion), by Country 2024 & 2032
- Figure 61: Asia Pacific USA Insurtech Industry Revenue Share (%), by Country 2024 & 2032
- Figure 62: Asia Pacific USA Insurtech Industry Volume Share (%), by Country 2024 & 2032
List of Tables
- Table 1: Global USA Insurtech Industry Revenue Million Forecast, by Region 2019 & 2032
- Table 2: Global USA Insurtech Industry Volume Billion Forecast, by Region 2019 & 2032
- Table 3: Global USA Insurtech Industry Revenue Million Forecast, by Business Model 2019 & 2032
- Table 4: Global USA Insurtech Industry Volume Billion Forecast, by Business Model 2019 & 2032
- Table 5: Global USA Insurtech Industry Revenue Million Forecast, by Insurance Type 2019 & 2032
- Table 6: Global USA Insurtech Industry Volume Billion Forecast, by Insurance Type 2019 & 2032
- Table 7: Global USA Insurtech Industry Revenue Million Forecast, by Region 2019 & 2032
- Table 8: Global USA Insurtech Industry Volume Billion Forecast, by Region 2019 & 2032
- Table 9: Global USA Insurtech Industry Revenue Million Forecast, by Business Model 2019 & 2032
- Table 10: Global USA Insurtech Industry Volume Billion Forecast, by Business Model 2019 & 2032
- Table 11: Global USA Insurtech Industry Revenue Million Forecast, by Insurance Type 2019 & 2032
- Table 12: Global USA Insurtech Industry Volume Billion Forecast, by Insurance Type 2019 & 2032
- Table 13: Global USA Insurtech Industry Revenue Million Forecast, by Country 2019 & 2032
- Table 14: Global USA Insurtech Industry Volume Billion Forecast, by Country 2019 & 2032
- Table 15: United States USA Insurtech Industry Revenue (Million) Forecast, by Application 2019 & 2032
- Table 16: United States USA Insurtech Industry Volume (Billion) Forecast, by Application 2019 & 2032
- Table 17: Canada USA Insurtech Industry Revenue (Million) Forecast, by Application 2019 & 2032
- Table 18: Canada USA Insurtech Industry Volume (Billion) Forecast, by Application 2019 & 2032
- Table 19: Mexico USA Insurtech Industry Revenue (Million) Forecast, by Application 2019 & 2032
- Table 20: Mexico USA Insurtech Industry Volume (Billion) Forecast, by Application 2019 & 2032
- Table 21: Global USA Insurtech Industry Revenue Million Forecast, by Business Model 2019 & 2032
- Table 22: Global USA Insurtech Industry Volume Billion Forecast, by Business Model 2019 & 2032
- Table 23: Global USA Insurtech Industry Revenue Million Forecast, by Insurance Type 2019 & 2032
- Table 24: Global USA Insurtech Industry Volume Billion Forecast, by Insurance Type 2019 & 2032
- Table 25: Global USA Insurtech Industry Revenue Million Forecast, by Country 2019 & 2032
- Table 26: Global USA Insurtech Industry Volume Billion Forecast, by Country 2019 & 2032
- Table 27: Brazil USA Insurtech Industry Revenue (Million) Forecast, by Application 2019 & 2032
- Table 28: Brazil USA Insurtech Industry Volume (Billion) Forecast, by Application 2019 & 2032
- Table 29: Argentina USA Insurtech Industry Revenue (Million) Forecast, by Application 2019 & 2032
- Table 30: Argentina USA Insurtech Industry Volume (Billion) Forecast, by Application 2019 & 2032
- Table 31: Rest of South America USA Insurtech Industry Revenue (Million) Forecast, by Application 2019 & 2032
- Table 32: Rest of South America USA Insurtech Industry Volume (Billion) Forecast, by Application 2019 & 2032
- Table 33: Global USA Insurtech Industry Revenue Million Forecast, by Business Model 2019 & 2032
- Table 34: Global USA Insurtech Industry Volume Billion Forecast, by Business Model 2019 & 2032
- Table 35: Global USA Insurtech Industry Revenue Million Forecast, by Insurance Type 2019 & 2032
- Table 36: Global USA Insurtech Industry Volume Billion Forecast, by Insurance Type 2019 & 2032
- Table 37: Global USA Insurtech Industry Revenue Million Forecast, by Country 2019 & 2032
- Table 38: Global USA Insurtech Industry Volume Billion Forecast, by Country 2019 & 2032
- Table 39: United Kingdom USA Insurtech Industry Revenue (Million) Forecast, by Application 2019 & 2032
- Table 40: United Kingdom USA Insurtech Industry Volume (Billion) Forecast, by Application 2019 & 2032
- Table 41: Germany USA Insurtech Industry Revenue (Million) Forecast, by Application 2019 & 2032
- Table 42: Germany USA Insurtech Industry Volume (Billion) Forecast, by Application 2019 & 2032
- Table 43: France USA Insurtech Industry Revenue (Million) Forecast, by Application 2019 & 2032
- Table 44: France USA Insurtech Industry Volume (Billion) Forecast, by Application 2019 & 2032
- Table 45: Italy USA Insurtech Industry Revenue (Million) Forecast, by Application 2019 & 2032
- Table 46: Italy USA Insurtech Industry Volume (Billion) Forecast, by Application 2019 & 2032
- Table 47: Spain USA Insurtech Industry Revenue (Million) Forecast, by Application 2019 & 2032
- Table 48: Spain USA Insurtech Industry Volume (Billion) Forecast, by Application 2019 & 2032
- Table 49: Russia USA Insurtech Industry Revenue (Million) Forecast, by Application 2019 & 2032
- Table 50: Russia USA Insurtech Industry Volume (Billion) Forecast, by Application 2019 & 2032
- Table 51: Benelux USA Insurtech Industry Revenue (Million) Forecast, by Application 2019 & 2032
- Table 52: Benelux USA Insurtech Industry Volume (Billion) Forecast, by Application 2019 & 2032
- Table 53: Nordics USA Insurtech Industry Revenue (Million) Forecast, by Application 2019 & 2032
- Table 54: Nordics USA Insurtech Industry Volume (Billion) Forecast, by Application 2019 & 2032
- Table 55: Rest of Europe USA Insurtech Industry Revenue (Million) Forecast, by Application 2019 & 2032
- Table 56: Rest of Europe USA Insurtech Industry Volume (Billion) Forecast, by Application 2019 & 2032
- Table 57: Global USA Insurtech Industry Revenue Million Forecast, by Business Model 2019 & 2032
- Table 58: Global USA Insurtech Industry Volume Billion Forecast, by Business Model 2019 & 2032
- Table 59: Global USA Insurtech Industry Revenue Million Forecast, by Insurance Type 2019 & 2032
- Table 60: Global USA Insurtech Industry Volume Billion Forecast, by Insurance Type 2019 & 2032
- Table 61: Global USA Insurtech Industry Revenue Million Forecast, by Country 2019 & 2032
- Table 62: Global USA Insurtech Industry Volume Billion Forecast, by Country 2019 & 2032
- Table 63: Turkey USA Insurtech Industry Revenue (Million) Forecast, by Application 2019 & 2032
- Table 64: Turkey USA Insurtech Industry Volume (Billion) Forecast, by Application 2019 & 2032
- Table 65: Israel USA Insurtech Industry Revenue (Million) Forecast, by Application 2019 & 2032
- Table 66: Israel USA Insurtech Industry Volume (Billion) Forecast, by Application 2019 & 2032
- Table 67: GCC USA Insurtech Industry Revenue (Million) Forecast, by Application 2019 & 2032
- Table 68: GCC USA Insurtech Industry Volume (Billion) Forecast, by Application 2019 & 2032
- Table 69: North Africa USA Insurtech Industry Revenue (Million) Forecast, by Application 2019 & 2032
- Table 70: North Africa USA Insurtech Industry Volume (Billion) Forecast, by Application 2019 & 2032
- Table 71: South Africa USA Insurtech Industry Revenue (Million) Forecast, by Application 2019 & 2032
- Table 72: South Africa USA Insurtech Industry Volume (Billion) Forecast, by Application 2019 & 2032
- Table 73: Rest of Middle East & Africa USA Insurtech Industry Revenue (Million) Forecast, by Application 2019 & 2032
- Table 74: Rest of Middle East & Africa USA Insurtech Industry Volume (Billion) Forecast, by Application 2019 & 2032
- Table 75: Global USA Insurtech Industry Revenue Million Forecast, by Business Model 2019 & 2032
- Table 76: Global USA Insurtech Industry Volume Billion Forecast, by Business Model 2019 & 2032
- Table 77: Global USA Insurtech Industry Revenue Million Forecast, by Insurance Type 2019 & 2032
- Table 78: Global USA Insurtech Industry Volume Billion Forecast, by Insurance Type 2019 & 2032
- Table 79: Global USA Insurtech Industry Revenue Million Forecast, by Country 2019 & 2032
- Table 80: Global USA Insurtech Industry Volume Billion Forecast, by Country 2019 & 2032
- Table 81: China USA Insurtech Industry Revenue (Million) Forecast, by Application 2019 & 2032
- Table 82: China USA Insurtech Industry Volume (Billion) Forecast, by Application 2019 & 2032
- Table 83: India USA Insurtech Industry Revenue (Million) Forecast, by Application 2019 & 2032
- Table 84: India USA Insurtech Industry Volume (Billion) Forecast, by Application 2019 & 2032
- Table 85: Japan USA Insurtech Industry Revenue (Million) Forecast, by Application 2019 & 2032
- Table 86: Japan USA Insurtech Industry Volume (Billion) Forecast, by Application 2019 & 2032
- Table 87: South Korea USA Insurtech Industry Revenue (Million) Forecast, by Application 2019 & 2032
- Table 88: South Korea USA Insurtech Industry Volume (Billion) Forecast, by Application 2019 & 2032
- Table 89: ASEAN USA Insurtech Industry Revenue (Million) Forecast, by Application 2019 & 2032
- Table 90: ASEAN USA Insurtech Industry Volume (Billion) Forecast, by Application 2019 & 2032
- Table 91: Oceania USA Insurtech Industry Revenue (Million) Forecast, by Application 2019 & 2032
- Table 92: Oceania USA Insurtech Industry Volume (Billion) Forecast, by Application 2019 & 2032
- Table 93: Rest of Asia Pacific USA Insurtech Industry Revenue (Million) Forecast, by Application 2019 & 2032
- Table 94: Rest of Asia Pacific USA Insurtech Industry Volume (Billion) Forecast, by Application 2019 & 2032
Frequently Asked Questions
1. What is the projected Compound Annual Growth Rate (CAGR) of the USA Insurtech Industry?
The projected CAGR is approximately > 6.00%.
2. Which companies are prominent players in the USA Insurtech Industry?
Key companies in the market include Gusto, Oscar, Bright Health, Clover Health, Root Insurance, American Well, Lemonade, Outsystems, Next Insurance, Metromile, Hippo**List Not Exhaustive.
3. What are the main segments of the USA Insurtech Industry?
The market segments include Business Model, Insurance Type.
4. Can you provide details about the market size?
The market size is estimated to be USD 49.82 Million as of 2022.
5. What are some drivers contributing to market growth?
Growing Demand for Data Analytics and Artificial Intelligence; Increasing Adoption of Digital Technologies.
6. What are the notable trends driving market growth?
Surged Funding towards Insurtech Companies.
7. Are there any restraints impacting market growth?
Growing Demand for Data Analytics and Artificial Intelligence; Increasing Adoption of Digital Technologies.
8. Can you provide examples of recent developments in the market?
March 2023: Duck Creek Technologies, the intelligent solutions provider defining the future of property and casualty (P&C) and general insurance acquired by Vista Equity Partners, a leading global investment firm.
9. What pricing options are available for accessing the report?
Pricing options include single-user, multi-user, and enterprise licenses priced at USD 3800, USD 4500, and USD 5800 respectively.
10. Is the market size provided in terms of value or volume?
The market size is provided in terms of value, measured in Million and volume, measured in Billion.
11. Are there any specific market keywords associated with the report?
Yes, the market keyword associated with the report is "USA Insurtech Industry," which aids in identifying and referencing the specific market segment covered.
12. How do I determine which pricing option suits my needs best?
The pricing options vary based on user requirements and access needs. Individual users may opt for single-user licenses, while businesses requiring broader access may choose multi-user or enterprise licenses for cost-effective access to the report.
13. Are there any additional resources or data provided in the USA Insurtech Industry report?
While the report offers comprehensive insights, it's advisable to review the specific contents or supplementary materials provided to ascertain if additional resources or data are available.
14. How can I stay updated on further developments or reports in the USA Insurtech Industry?
To stay informed about further developments, trends, and reports in the USA Insurtech Industry, consider subscribing to industry newsletters, following relevant companies and organizations, or regularly checking reputable industry news sources and publications.
Methodology
Step 1 - Identification of Relevant Samples Size from Population Database


Step 2 - Approaches for Defining Global Market Size (Value, Volume* & Price*)

Note*: In applicable scenarios
Step 3 - Data Sources
Primary Research
- Web Analytics
- Survey Reports
- Research Institute
- Latest Research Reports
- Opinion Leaders
Secondary Research
- Annual Reports
- White Paper
- Latest Press Release
- Industry Association
- Paid Database
- Investor Presentations

Step 4 - Data Triangulation
Involves using different sources of information in order to increase the validity of a study
These sources are likely to be stakeholders in a program - participants, other researchers, program staff, other community members, and so on.
Then we put all data in single framework & apply various statistical tools to find out the dynamic on the market.
During the analysis stage, feedback from the stakeholder groups would be compared to determine areas of agreement as well as areas of divergence
